ELK - log collection system
1. What logs do you want to collect?
① System log – prepare for monitoring
② Service log – database – MySQL – slow query log, error log and normal log
③ Business log – log4j (business log must be collected)
Note: log4j - data business log of Java class
(1) To be targeted to collect
(2) Adjust log level
2. How to display logs after collection? (visualization)
①kibana
②grafana
3. How to use the log after it is collected and displayed?
① It is used to analyze big data as a data source for three-dimensional display
② For R & D (troubleshooting, bug solving, etc.)
③ Statistical data flow, as the data source of analysis report
ELK working principle
[APPServer cluster] – [logstash Agent collector] – [elasticsearch cluster] – [Kibana Server] – [Browser]
Logstash collects the logs generated by the AppServer and stores them in the ElasticSearh cluster, while Kibana queries the data production chart from the ES cluster and returns it to the Browser. In short, the following steps are generally required for log processing and analysis
① Centralized log management (beats)
filebeat
topbeat
② Format log (logstash)
③ Index and store the formatted data (elastic search)
④ Display of front-end data (kibana)
elasticsearch
Elasticsearch is a Lucene based search server. It provides a distributed multi-user full-text search engine based on RESTful web interface. Elasticsearch is developed in Java and released as an open source under the Apache license terms. It is the second most popular enterprise search engine. Designed for cloud computing, it can achieve real-time search, stable, reliable, fast, easy to install and use.
Basic and core concepts of elastic search
1. Near real time (NRT)
Is a near real-time search platform, which means that there is a slight delay (usually 1 second) from indexing a document until the document can be searched
2. cluster
A cluster is organized by one or more nodes. They jointly hold your entire data and provide indexing and search functions together. One of the nodes is the primary node, which can be elected, and provides cross node joint index and search functions. The cluster has a unique name. The default is elastic search. The cluster name is very important. Each node is added to its cluster based on the cluster name. Therefore, ensure that different cluster names are used in different environments.
A cluster can have only one node. It is strongly recommended to configure elasticsearch in cluster mode.
3. node
A node is a single server, which is a part of a cluster. It stores data and participates in the index and search functions of the cluster Like clusters, nodes are identified by name, which is the character name randomly assigned when the node is started by default Of course, you can define it yourself This name is also very important. It is used to identify the node corresponding to the server in the cluster
Nodes can join the cluster by specifying the cluster name. By default, each node is set to join the elastic search cluster. If multiple nodes are started, assuming that they can automatically find each other, they will automatically form a cluster called elastic search.
4. index
An index is a collection of documents with somewhat similar characteristics. For example, you can have an index of customer data, another index of product catalog, and an index of order data. An index is identified by a name (which must be all lowercase letters), and we should use this name when we want to index, search, update and delete the documents corresponding to this index. In a cluster, you can define as many indexes as you want.
Index a library relative to a relational database.
5. type
In an index, you can define one or more types. A type is a logical classification / partition of your index, and its semantics is entirely up to you. Typically, a type is defined for a document that has a common set of fields. For example, let's say you run a blog platform and store all your data in an index. In this index, you can define one type for user data, another type for blog data, and of course, another type for comment data.
Table type relative to relational database
6. document
A document is a basic information unit that can be indexed. For example, you can have a document for a customer, a document for a product, and, of course, a document for an order. Documents are represented in JSON(Javascript Object Notation) format, and uSON is a ubiquitous Internet data interaction format.
In an index/type, you can store as many documents as you want. Note that although a document is physically located in an index, in fact, a document must be indexed and assigned a type within an index.
Columns of a document relative to a relational database.
7. Shards & replicas
In practice, the data stored in the index may exceed the hardware limit of a single node. If a 1 billion document needs 1TB of space, it may not be suitable for storage on a single node disk Or the search request from a single node is too slow to fly down. To solve this problem, elastic search n provides the function of dividing the index into multiple slices. When creating an index, you can define the number of slices you want to slice. Each partition is a fully functional independent index, which can be located on any node in the cluster.
**Note: * * function of slice:
1. Expand horizontally to increase the storage capacity
2. Distributed parallel cross slice operation to improve performance and throughput
Role of copy:
1. High availability to deal with fragmentation or node failure. For this reason, shards and replicas are on different nodes
2. Increase the throughput, and the search can be performed on all replicas in parallel
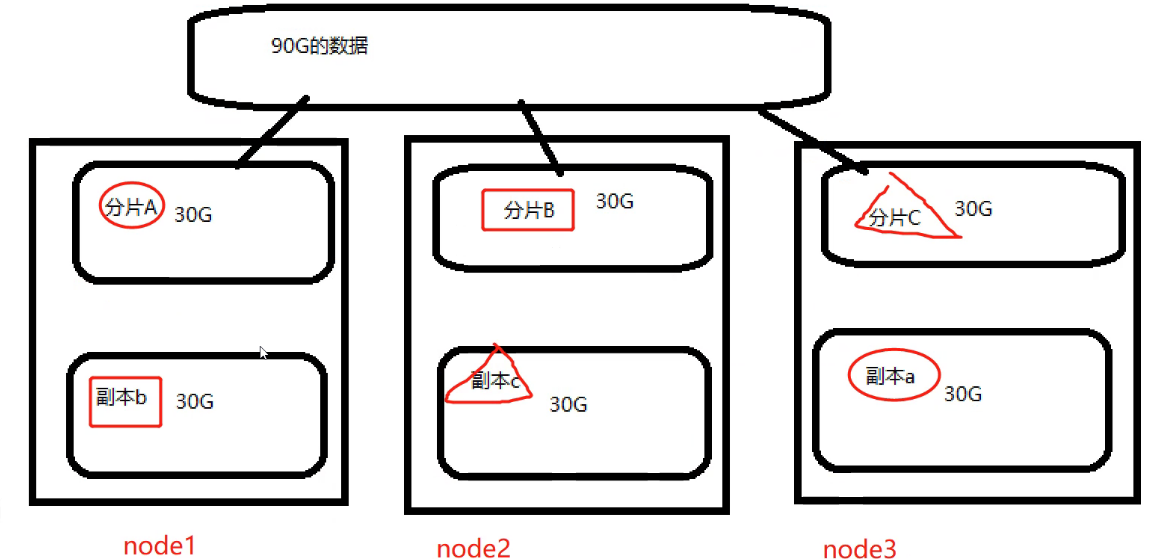
By default, ES is 5 tiles and one copy
logstash
Logstash is written in JRuby language, based on the simple message based architecture, and runs on the Java virtual machine (JWM). Different from the separate agent or server, logstash can configure a single agent to combine with other open source software to realize different functions
The concept of Logstash is very simple. It only does three things:
① Collect: data entry
② Enrich: data processing, such as filtering, rewriting, etc
③ Transport: data output
Main components of logstash
1.Shipper: log collector
Be responsible for monitoring the changes of local log files and collecting the latest contents of log files in time. Usually, the remote agent only needs to run this component;
2.Indexer: log store
Responsible for receiving logs and writing them to local files.
3.Broker: log Hub
Responsible for connecting multiple shipper s and multiple indexers
4.Search and Storage: allows searching and storage of events;
5.web Interface: web-based display interface
kibana
Kibana is an open source analysis and visualization platform for Elasticsearch. It uses meters to search, view and interactively store data in Elasticsearch index. With kibana, advanced data analysis and display can be carried out through various charts. Kibana makes massive data easier to understand. It is easy to operate, and the browser based user interface can quickly create a dashboard to display the Elasticsearch query dynamics in real time. Setting up kibana is very simple. Kibana installation can be completed and Elasticsearch index monitoring can be started in a few minutes without writing code.
major function
1. Seamless integration of Elasticsearch. Kibana architecture is customized for Elasticsearch and can add any structured and unstructured data to Elasticsearch index. Kibana also makes full use of the powerful search and analysis capabilities of Elasticsearch.
2. Integrate your data. Kibana can better handle massive data and create column charts, line charts, scatter charts, histograms, pie charts and maps.
3. Complex data analysis. Kibana improves Elasticsearch's analysis capabilities, enabling it to analyze data more intelligently, perform mathematical transformations, and cut and block data as required.
4. Benefit more team members. The powerful database visualization interface enables all business posts to benefit from the data collection.
5. Flexible interface and easier sharing. Kibana makes it easier to create, save, share data, and quickly communicate visual data.
6. Simple configuration. Kibana is very simple to configure and enable, and the user experience is very friendly. Kibana comes with its own web server, which can start and run quickly.
7. Visualize multiple data sources. Kibana can easily integrate data from Logstash, ES Hadoop, Beats or third-party technologies into slasticsearch. The supported third-party technologies include Apache Flume, fluent, etc.
8. Simple data export. Kibana can easily export the data of interest, merge and fuse with other data sets, quickly model and analyze, and find new results.
Note: the versions of ES production environment are 7.10 and 7.20:, which must be started by non root users
Actual operation
1. Create cluster
1. Configure the base environment
#Turn off firewall
[root@localhost ~]#systemctl stop firewalld.service
[root@localhost ~]#setenforce 0
[root@localhost ~]#hostnamectl set-hostname node1
[root@localhost ~]#su
[root@node1 ~]#vim /etc/hosts
192.168.223.101 node1
192.168.223.102 node2
192.168.223.103 httpd
#View java environment
[root@node1 ~]#java -version
openjdk version "1.8.0_131"
OpenJDK Runtime Environment (build 1.8.0_131-b12)
OpenJDK 64-Bit Server VM (build 25.131-b12, mixed mode)
2. Deploying the elasticserch environment
#1. Install elasticserch RPM package
[root@node1 ~]#cd /opt/
[root@node1 opt]#ls
rh
[root@node1 opt]#rz -E
rz waiting to receive.
[root@node1 opt]#rpm -ivh elasticsearch-5.5.0.rpm
Warning: elasticsearch-5.5.0.rpm: head V4 RSA/SHA512 Signature, secret key ID d88e42b4: NOKEY
 In preparation...                          ################################# [100%]
Creating elasticsearch group... OK
Creating elasticsearch user... OK
 Upgrading/install...
   1:elasticsearch-0:5.5.0-1          ################################# [100%]
### NOT starting on installation, please execute the following statements to configure elasticsearch service to start automatically using systemd
 sudo systemctl daemon-reload
 sudo systemctl enable elasticsearch.service
### You can start elasticsearch service by executing
 sudo systemctl start elasticsearch.service
#Load system services
[root@node1 opt]#systemctl daemon-reload
[root@node1 opt]#systemctl enable elasticsearch.service
Created symlink from /etc/systemd/system/multi-user.target.wants/elasticsearch.service to /usr/lib/systemd/system/elasticsearch.service.
3. Change profile
[root@node1 opt]#cd /etc/elasticsearch/
[root@node1 elasticsearch]#ls
elasticsearch.yml  jvm.options  log4j2.properties  scripts
[root@node1 elasticsearch]#vim elasticsearch.yml   ##A backup copy is recommended for production environment
 17 cluster.name: my-cluster
#Modify cluster name
23 node.name: node1
#Just turn it on
33 path.data: /data/elk_data
#Data directory
37 path.logs: /var/log/elasticsearch/
#log file path
43 bootstrap.memory_lock: false
#Memory lock cancellation
55 network.host: 0.0.0.0
#Listening address
59 http.port: 9200
#port
68 discovery.zen.ping.unicast.hosts: ["node1", "node2"]
#Automatic cluster discovery, adding host name
[root@node1 elasticsearch]#grep -v "^#" elasticsearch.yml
cluster.name: my-cluster
node.name: node1
path.data: /data/elk_data
path.logs: /var/log/elasticsearch/
bootstrap.memory_lock: false
network.host: 0.0.0.0
http.port: 9200
discovery.zen.ping.unicast.hosts: ["node1", "nide2"]

#Create data storage path and authorize
[root@node1 elasticsearch]#mkdir -p /data/elk_data
[root@node1 elasticsearch]#chown elasticsearch.elasticsearch /data/elk_data/

#start-up
[root@node1 elasticsearch]#systemctl start elasticsearch.service
[root@node1 elasticsearch]#netstat -ntap|grep 9200
tcp6       0      0 :::9200                 :::*                    LISTEN      42939/java
4. View node information
View cluster status
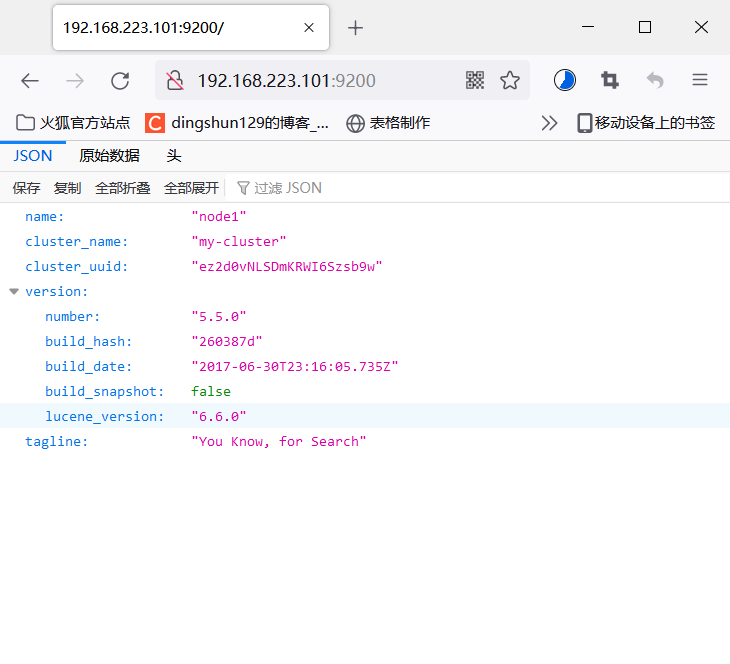
[root@node1 elasticsearch]#curl http://192.168.223.101:9200/_cluster/health?pretty
{
  "cluster_name" : "my-cluster",
  "status" : "green",
  "timed_out" : false,
  "number_of_nodes" : 2,
  "number_of_data_nodes" : 2,
  "active_primary_shards" : 0,
  "active_shards" : 0,
  "relocating_shards" : 0,
  "initializing_shards" : 0,
  "unassigned_shards" : 0,
  "delayed_unassigned_shards" : 0,
  "number_of_pending_tasks" : 0,
  "number_of_in_flight_fetch" : 0,
  "task_max_waiting_in_queue_millis" : 0,
  "active_shards_percent_as_number" : 100.0
}
[root@node1 elasticsearch]#curl http://192.168.223.101:9200/_cluster/stats?pretty
{
  "_nodes" : {
    "total" : 2,
    "successful" : 2,
    "failed" : 0
  },
  "cluster_name" : "my-cluster",
  "timestamp" : 1641217410030,
  "status" : "green",
  "indices" : {
    "count" : 0,
    "shards" : { },
    "docs" : {
      "count" : 0,
      "deleted" : 0
    },
    "store" : {
      "size_in_bytes" : 0,
      "throttle_time_in_millis" : 0
    },
    "fielddata" : {
      "memory_size_in_bytes" : 0,
      "evictions" : 0
    },
    "query_cache" : {
      "memory_size_in_bytes" : 0,
      "total_count" : 0,
      "hit_count" : 0,
      "miss_count" : 0,
      "cache_size" : 0,
      "cache_count" : 0,
      "evictions" : 0
    },
    "completion" : {
      "size_in_bytes" : 0
    },
    "segments" : {
      "count" : 0,
      "memory_in_bytes" : 0,
      "terms_memory_in_bytes" : 0,
      "stored_fields_memory_in_bytes" : 0,
      "term_vectors_memory_in_bytes" : 0,
      "norms_memory_in_bytes" : 0,
      "points_memory_in_bytes" : 0,
      "doc_values_memory_in_bytes" : 0,
      "index_writer_memory_in_bytes" : 0,
      "version_map_memory_in_bytes" : 0,
      "fixed_bit_set_memory_in_bytes" : 0,
      "max_unsafe_auto_id_timestamp" : -9223372036854775808,
      "file_sizes" : { }
    }
  },
  "nodes" : {
    "count" : {
      "total" : 2,
      "data" : 2,
      "coordinating_only" : 0,
      "master" : 2,
      "ingest" : 2
    },
    "versions" : [
      "5.5.0"
    ],
    "os" : {
      "available_processors" : 4,
      "allocated_processors" : 4,
      "names" : [
        {
          "name" : "Linux",
          "count" : 2
        }
      ],
      "mem" : {
        "total_in_bytes" : 7635124224,
        "free_in_bytes" : 713814016,
        "used_in_bytes" : 6921310208,
        "free_percent" : 9,
        "used_percent" : 91
      }
    },
    "process" : {
      "cpu" : {
        "percent" : 0
      },
      "open_file_descriptors" : {
        "min" : 163,
        "max" : 163,
        "avg" : 163
      }
    },
    "jvm" : {
      "max_uptime_in_millis" : 540964,
      "versions" : [
        {
          "version" : "1.8.0_131",
          "vm_name" : "OpenJDK 64-Bit Server VM",
          "vm_version" : "25.131-b12",
          "vm_vendor" : "Oracle Corporation",
          "count" : 2
        }
      ],
      "mem" : {
        "heap_used_in_bytes" : 263309320,
        "heap_max_in_bytes" : 4260102144
      },
      "threads" : 54
    },
    "fs" : {
      "total_in_bytes" : 75645067264,
      "free_in_bytes" : 67942158336,
      "available_in_bytes" : 67942158336
    },
    "plugins" : [ ],
    "network_types" : {
      "transport_types" : {
        "netty4" : 2
      },
      "http_types" : {
        "netty4" : 2
      }
    }
  }
}
2. The host installs the elasticsearch plug-in
1. Install node
[root@httpd ~]#yum install gcc gcc-c++ make -y
[root@httpd ~]#cd /opt/
[root@httpd opt]#ls
gfsrepo  gfsrepo.tar.gz  rh
[root@httpd opt]#rz -E
rz waiting to receive.
[root@httpd opt]#ls
gfsrepo  gfsrepo.tar.gz  node-v8.2.1.tar.gz  rh
[root@httpd opt]#tar xzf node-v8.2.1.tar.gz
[root@httpd opt]#ls
gfsrepo  gfsrepo.tar.gz  node-v8.2.1  node-v8.2.1.tar.gz  rh
[root@httpd opt]#cd node-v8.2.1/
[root@httpd node-v8.2.1]#./configure
[root@httpd node-v8.2.1]#make -j2 && make install
2. Install phantomjs
[root@httpd opt]#cd /usr/local/src/
[root@httpd src]#rz -E
rz waiting to receive.
[root@httpd src]#ls
phantomjs-2.1.1-linux-x86_64.tar.bz2
[root@httpd src]#tar xf phantomjs-2.1.1-linux-x86_64.tar.bz2
[root@httpd src]#cd phantomjs-2.1.1-linux-x86_64/
[root@httpd phantomjs-2.1.1-linux-x86_64]#cd /bin/
[root@httpd bin]#ln -s /usr/local/src/phantomjs-2.1.1-linux-x86_64/bin/* /usr/local/bin/
3. Install elasticsearch head
[root@httpd opt]#cd /usr/local/src/
[root@httpd src]#rz -E
[root@httpd src]#tar zxvf elasticsearch-head.tar.gz
[root@httpd src]#cd elasticsearch-head/
[root@httpd elasticsearch-head]#npm install
npm WARN deprecated fsevents@1.2.13: fsevents 1 will break on node v14+ and could be using insecure binaries. Upgrade to fsevents 2.
npm WARN optional SKIPPING OPTIONAL DEPENDENCY: fsevents@^1.0.0 (node_modules/karma/node_modules/chokidar/node_modules/fsevents):
npm WARN notsup SKIPPING OPTIONAL DEPENDENCY: Unsupported platform for fsevents@1.2.13: wanted {"os":"darwin","arch":"any"} (current: {"os":"linux","arch":"x64"})
npm WARN elasticsearch-head@0.0.0 license should be a valid SPDX license expression

up to date in 3.968s

#Modify profile
[root@httpd opt]#vim /etc/elasticsearch/elasticsearch.yml
#Face profile, insert end
http.cors.enabled: true
#Enable cross domain access support. The default value is false
http.cors.allow-origin: "*"
#Specify that the domain names and addresses allowed for cross domain access are all
http.cors.enabled: true
http.cors.allow-origin: "*"

[root@httpd opt]#systemctl restart elasticsearch.service
[root@httpd opt]#netstat -natp | grep 9200
tcp6       0      0 127.0.0.1:9200          :::*                    LISTEN      49063/java
tcp6       0      0 ::1:9200                :::*                    LISTEN      49063/java
[root@node1 elasticsearch-head]#npm run start &