Catalog
Problems to be noticed during construction
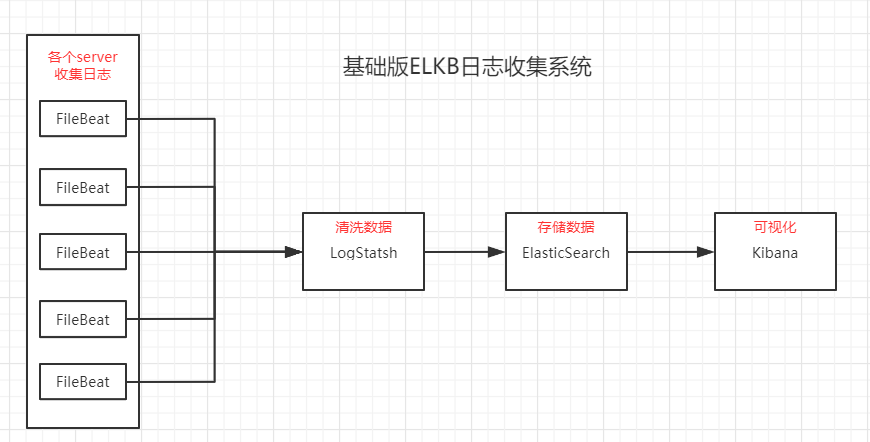
What is ELKB
ELKB is a popular solution for log system, which is composed by a set of components. This set of components are ElasticSearch, LogStash, Kibana and FileBeat.
The functions of each component are as follows:
Elastic search (es): Based on Apache Lucene, it can store, search and analyze large capacity data in near real time.
LogStatsh: data collection extra processing and data engine. It supports the dynamic collection of data from various data sources, filtering, analyzing, enriching, unifying the format of data, and then storing it to the location specified by the user.
Kibanna: data analysis and visualization platform. It is usually used with elastic search to search, analyze and display the data in the form of statistical charts.
Filebeat: install filebeat on the server that needs to collect log data. After specifying the log directory or log file, filebeat can read the data, send it to Logstash for analysis, or directly send it to ElasticSearch for centralized storage and analysis. Among them, filebeat is just one commonly used in the beat series. The rest of beats include Packetbeat (collect network traffic data); Topbeat (collect CPU and memory usage data at system, process and file system levels); filebeat (collect file data); Winlogbeat (collect Windows event log data)
ELKB infrastructure
Architecture optimization of each module
- Clustering elastic search
- To deploy the above modules on different servers, LogStash chooses the ones with strong computing power and abundant CPU and memory; ElasticSearch chooses the ones with large disk capacity and abundant CPU and memory.
Building ELKB system
es depends on JDK and has built-in JDK. However, if JAVA_HOME is configured locally, the configured JDK will be used. At this time, version dependency should be considered. The corresponding version dependency can be found in https://www.elastic.co/cn/support/matrix#matrix_jvm Check;
At present, ELKB has realized version synchronization, so when building, select a version and use it for all components.
Here, choose the 7.6.2 version to build. The corresponding JDK version is 11, so you need to install jdk11 first. The installation steps of jdk11 are not shown here. At the same time, because it is only a test environment, all modules are no longer optimized, only on one machine, choose infrastructure to build.
1: Download components
The official download site is https://elasticsearch.cn/download , but because of some magical power, it is very slow to download directly on the official website, so you can find some mirror websites to download.
Huawei image website Express (recommended to join your favorites)
Download the corresponding components on the server:
# Switch to download directory
cd /tmp

# Download es
wget https://mirrors.huaweicloud.com/elasticsearch/7.6.2/elasticsearch-7.6.2-linux-x86_64.tar.gz

# Download logstash
wget https://mirrors.huaweicloud.com/logstash/7.6.2/logstash-7.6.2.tar.gz

# Download kibana
wget https://mirrors.huaweicloud.com/kibana/7.6.2/kibana-7.6.2-linux-x86_64.tar.gz

# Download filebeat
wget https://mirrors.huaweicloud.com/filebeat/7.6.2/filebeat-7.6.2-linux-x86_64.tar.gz
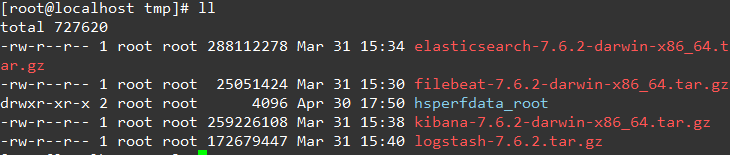
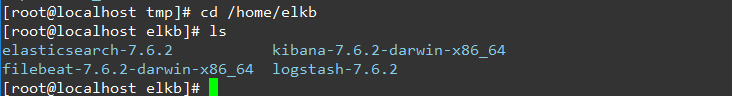
2: Unzip
# Decompress es
tar -zxvf elasticsearch-7.6.2-darwin-x86_64.tar.gz -C /home/elkb
# Unzip logstash
tar -zxvf logstash-7.6.2.tar.gz -C /home/elkb
# Decompress kibana
tar -zxvf kibana-7.6.2-darwin-x86_64.tar.gz -C /home/elkb
# Unzip filebeat
tar zxvf filebeat-7.6.2-darwin-x86_64.tar.gz -C /home/elkb
3: Configure components, start
Create a user first, and then use this user for subsequent operations
# Create start user elkb (can't start with a log)
useradd elkb
# Change Password
passwd elkb
chown -R elkb:elkb /home/elkb
Configuration es
Create the data directory in the es installation directory
cd /home/elkb/elasticsearch-7.6.2

mkdir data
Modify profile
cd config

vim elasticsearch.yml
Modify the following options
# Cluster name
cluster.name: elkb
# Node name
node.name: elkb-node-1
# master node, single here, just use the node name directly
cluster.initial_master_nodes: elkb-node-1
# The data storage directory of ES, which is under the es? Home / data directory by default
path.data: /home/elkb/elasticsearch-7.6.2/data
# Log storage directory, which is under es? Home / logs directory by default
path.logs: /home/elkb/elasticsearch-7.6.2/logs
# Lock the physical memory address to prevent the elastic search memory from being swapped out, that is to say, es is not allowed to use swap to exchange partitions
bootstrap.memory_lock: false
bootstrap.system_call_filter: false
# Allowed ip address
network.host: 0.0.0.0
# External port
http.port: 9200
# Allow cross domain
http.cors.enabled: true
http.cors.allow-origin: "*"
# Setting of automatic index creation - disable automatic index creation, + allow index creation, multiple indexes are separated by "," "
action.auto_create_index: +log*,+.watches*,+.triggered_watches,+.watcher-history-*,+.kibana*,+.monitoring*,+logstash*
Configure native files
Repair to modify some file configurations of linux, otherwise similar errors will appear as follows.

vi /etc/security/limits.conf
# Add the following settings
* soft nofile 65536
* hard nofile 131072
* soft nproc 2048
* hard nproc 4096


# 20-nproc.conf for centos 7 and 90-nproc.conf for CentOS 6
vi /etc/security/limits.d/20-nproc.conf
#Change to
* soft nproc 4096


vi /etc/sysctl.conf
# Add the following configuration:
vm.max_map_count=655360


# Let kernel parameters take effect
sysctl -p
Start es
cd /home/elkb/elasticsearch-7.6.2/
nohup /home/elkb/elasticsearch-7.6.2/bin/elasticsearch &
If This could be due to running on an unsupported OS or distribution, missing OS libraries, or a problem with the temp directory. To bypass this problem by running Elasticsearch without machine learning functionality set [xpack.ml.enabled: false] error occurs
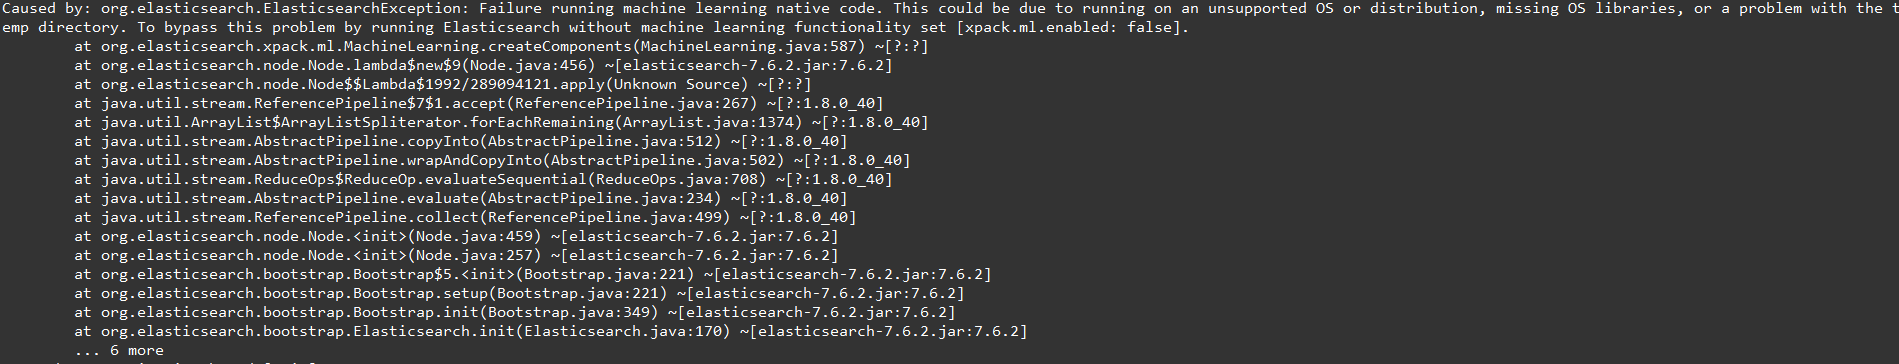
Add the following configuration to the profile:
# Disable X-Pack machine learning
xpack.ml.enabled: false
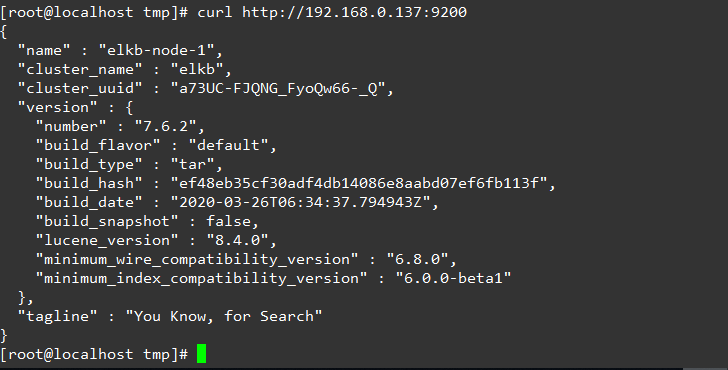
Verify es
curl http://192.168.0.137:9200
Configure kibana
Modify profile
cd /home/elkb/kibana-7.6.2-linux-x86_64/config/

vi kibana.yml

# Modify the following configuration
# Kibana port
server.port: 5601
# kibana address
server.host: "192.168.0.137"
server.name: "192.168.0.137"
# es address
elasticsearch.hosts: ["http://192.168.0.137:9200"]
# Take kibanna's search as an index of es
kibana.index: ".kibana"
Start kibana
nohup /home/elkb/kibana-7.6.2-linux-x86_64/bin/kibana &
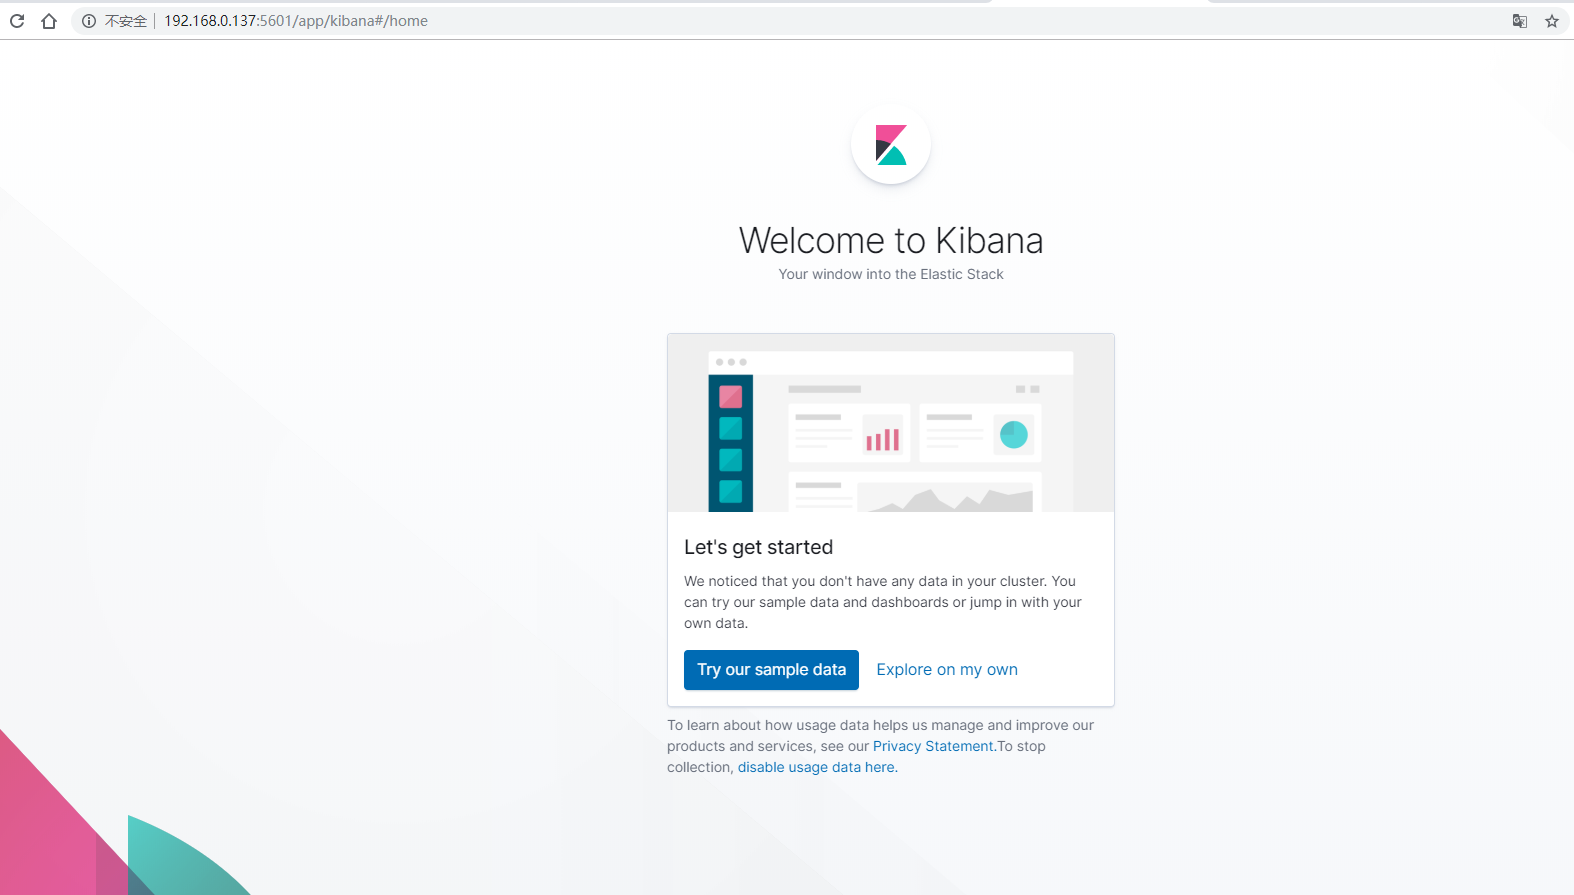
Verification
Visit http://192.168.0.137:5601/ show kibana Homepage
Configure logstash
The syntax of logstash is section input {},filter {},output {}.
The process is to collect, filter and process.
Modify profile
# Copy base profile
cd /home/elkb/logstash-7.6.2/config
cp logstash-sample.conf logstash-log.conf

# Modify the configuration file as follows
vi logstash-log.conf

# ==================Start===================
# Sample Logstash configuration for creating a simple
# Beats -> Logstash -> Elasticsearch pipeline.

input {
  beats {
    port => 5044
  }
}

grok {
  match => {
    "message" => "\[%{DATA:app}\] \[%{DATA:timestamp}\] \[%{DATA:thread}\] \[%{LOGLEVEL:level}\] \[%{DATA:class}\] (?<msg>(.|\r|\n)*)"
  }
  }
  date {
    match => ["createtime", "yyyy-MM-dd HH:mm:ss"]
    target => "@timestamp"
  }
  mutate{
    remove_field => ["beat.name"]
  }
}

output {
  elasticsearch {
    hosts => ["http://192.168.0.137:9200"]
	index => "log-%{+YYYY.MM.dd}"
    document_type => "log"
    #host => "%{[@host][beat]}"
    #user => "elastic"
    #password => "changeme"
  }
}
# ==================End===================
The above configuration is to listen to the local port 5044, pass the filter, and output to the specified output.
Start logstash
cd /home/elkb/logstash-7.6.2/

nohup bin/logstash -f config/logstash-log.conf --config.reload.automatic &
Configure filebeat
Modify profile
# Copy base profile
cd /home/elkb/filebeat-7.6.2-linux-x86_64
cp filebeat.yml filebeat-log.yml

vi filebeat-log.yml

#=========================== Filebeat inputs =============================
# Remember to open the configuration
enabled: true
# Set read file path
paths:
    - /home/ad/logs/*/all.log
#Open exclusion file
exclude_files: ['.gz$']
# Add additional custom fields
fields
    host: 192.168.0.137
 # Configure Multiline to match Multiline messages
multiline.pattern: ^\[
multiline.negate: true
multiline.match: after
#============================= Logstash output ===============================
#output setting
output.logstash:
    # The Logstash hosts
    hosts: ["192.168.0.137:5044"]
#===========================Tuning=============================
## Tuning to avoid taking up too much memory
## Whether a large number of files are monitored at the same time due to wildcards
## Whether the single line content of the file is huge and the log record is not standardized
## Whether the output is always blocked, and the event queue always caches the event
max_procs: 1
queue.mem.events: 256
queue.mem.flush.min_events: 128
Multiple input s can be configured.
Start filebeat
# File must belong to root
chown -R root /home/elkb/filebeat-7.6.2-linux-x86_64
# View the list of enabled or disabled modules
./filebeat modules list
# Enable logstash module
./filebeat modules enable logstash
# Check if the configuration file is correct
./filebeat test config
## Start filebeat
cd /home/elkb/filebeat-7.6.2-linux-x86_64/
nohup ./filebeat -e -c filebeat-log.yml &
# If debugging
nohup ./filebeat -e -c filebeat-log.yml -d "*" &
test
Filebeat listens to / home/ad/logs/*/all.log, so modify the file to simulate real-time log.
- Modify the file according to the format of grok in logstash
[consumer-log] [2020-04-30 18:47:42,710] [org.springframework.kafka.KafkaListenerEndpointContainer#4-0-C-1] [INFO] [com.consumer.log.consumer.LogKafkaConsumer.listenerCommonLog(LogKafkaConsumer.java:272)] public log processing start: 1588243662710
- Check whether es creates indexes synchronously,
# Get the specified date index log-YYYY.MM.dd
curl http://192.168.0.137:9200/log-2020.05.01?pretty

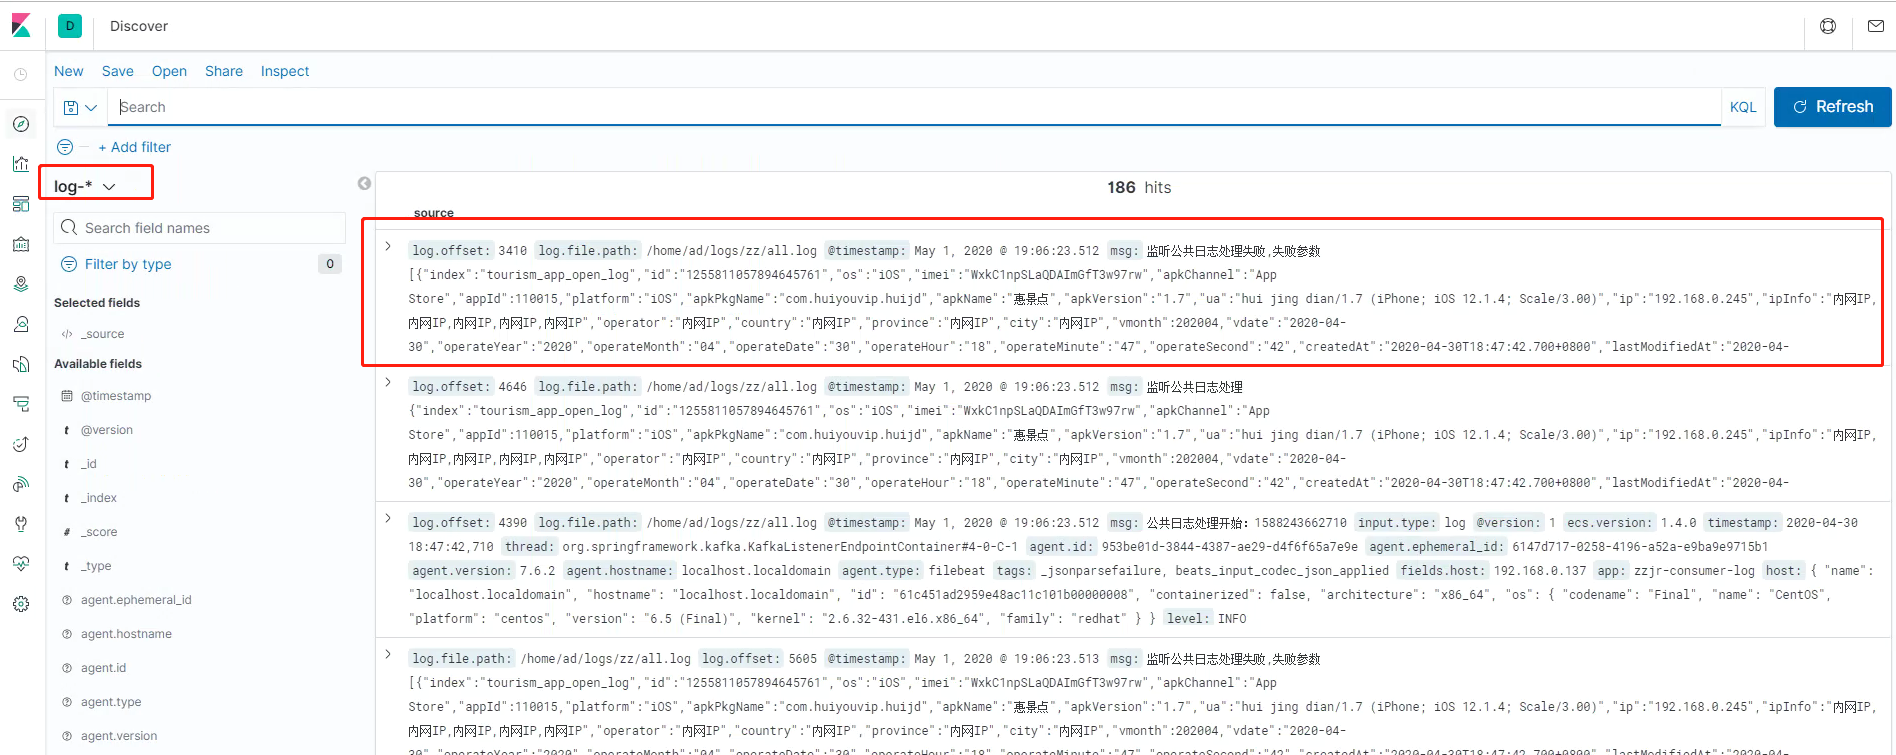
- After kibana configures index Patterns, can you view the corresponding information
Select create index patterns from management - > kibana - > index patterns in kibana, and create new panel information according to the prompts.
After creation, view the corresponding index information on discovery.
Problems to be noticed during construction
- elasticsearc related files cannot belong to root
- filebeat can only be started with root
- The grok in the filter of logstash must be configured correctly, or the connection reset by peer will appear, that is, after the filteat is passed to logstash, it cannot be synchronized to es, grok grammar portal