Hello, in the process of using Pandas, in addition to data, we deal more with tables. In order to better display a table data, there must be good settings in the early stage.
This article introduces the common configuration skills of Pandas, mainly based on options and settings. Welcome to collect and learn, like praise and support.
Note: technical exchange group is provided at the end of the text
Import
This is a conventional import method!
import pandas as pd
Ignore warning
Due to the update of the version, some usage of Pandas may be removed in the near future. Some warnings (not errors) often appear. The relevant warnings can be ignored with the following code:
# Ignore warning
import warnings
warnings.filterwarnings('ignore')
float data accuracy
View default precision
The default is to keep 6 decimal places. Print the current accuracy by:
pd.get_option( 'display.precision')
6
Modify accuracy
Set the precision to 2 bits
pd.set_option( 'display.precision',2)
# Writing 2: PD options. display. precision = 2
Then we print again, and the current accuracy becomes 2 bits:
pd.get_option( 'display.precision')
2
Display rows
The default number of rows displayed is 60
pd.get_option("display.max_rows")  # The default is 60
60
The default minimum number of rows is 10 bits:
pd.get_option("display.min_rows")  # Minimum display rows
10
Modify the number of rows displayed
Modify the maximum number of displayed lines to 999, and then view:
pd.set_option("display.max_rows",999)  # Maximum number of rows to display
pd.get_option("display.max_rows")
999
Modify the minimum number of rows displayed:
pd.set_option("display.min_rows",20)
pd.get_option("display.min_rows")
20
Reset function
Reset using reset_ After the option method, the setting will change to the default form (numerical value):
pd.reset_option("display.max_rows")
pd.get_option("display.max_rows")  # Back to 60
60
pd.reset_option("display.min_rows")
pd.get_option("display.min_rows")  # Back to 10
10
Regular function
If we modify the settings of multiple options and want to restore them at the same time, we can reset multiple options using regular expressions.
Here, it means that all settings starting with display are reset:
# ^It means to start with a character. Here, it means to start all resets with display
pd.reset_option("^display")
reset all
If all is used, all settings are reset:
pd.reset_option('all')
Display column
Since you can control the number of rows displayed, you can also control the number of columns displayed
View the number of columns displayed
The number of columns displayed by default is 20:
pd.get_option('display.max_columns')

#Another way to write: through attributes
pd.options.display.max_columns
20
Change the number of columns
Modify the number of columns displayed to 100:
# Change to 100
pd.set_option('display.max_columns',100)
To view the number of modified columns:
# View modified values
pd.get_option('display.max_columns')
100
Show all columns
If set to None, all columns are displayed:
pd.set_option('display.max_columns',None)
Reset
pd.reset_option('display.max_columns')
Modify column width
The above is to view the number of columns, and the following is to set the width of each column. The width of a single column of data, calculated in the number of characters, is indicated by an ellipsis when it exceeds.
Default column width
The default column width is 50 characters:
pd.get_option ('display.max_colwidth')
50
Modify column width
Modify the displayed column width to 100:
# Change to 100
pd.set_option ('display.max_colwidth', 100)
To view the displayed column width and length:
pd.get_option ('display.max_colwidth')
100
Show all columns
Show all columns:
pd.set_option ('display.max_colwidth', None)
Folding function
Whether to collapse when the output data width exceeds the set width. Generally, False is not used to collapse, but True is used to collapse.
pd.set_option("expand_frame_repr", True) # fold
pd.set_option("expand_frame_repr", False) # No folding
Snippet modification settings
The settings described above, if modified, are the of the whole environment; We can also make temporary settings for only one code block.
If you run out of the current code block, it will fail and return to the original setting.
Suppose this is the first code block:
print(pd.get_option("display.max_rows"))
print(pd.get_option("display.max_columns"))
60
20
Here is the second code block:
# Set the current code block

with pd.option_context("display.max_rows", 20, "display.max_columns", 10):
    print(pd.get_option("display.max_rows"))
    print(pd.get_option("display.max_columns"))
20
10
Here is the third code block:
print(pd.get_option("display.max_rows"))
print(pd.get_option("display.max_columns"))
60
20
In the above example, we can find that the setting is invalid outside the specified code block
Number formatting
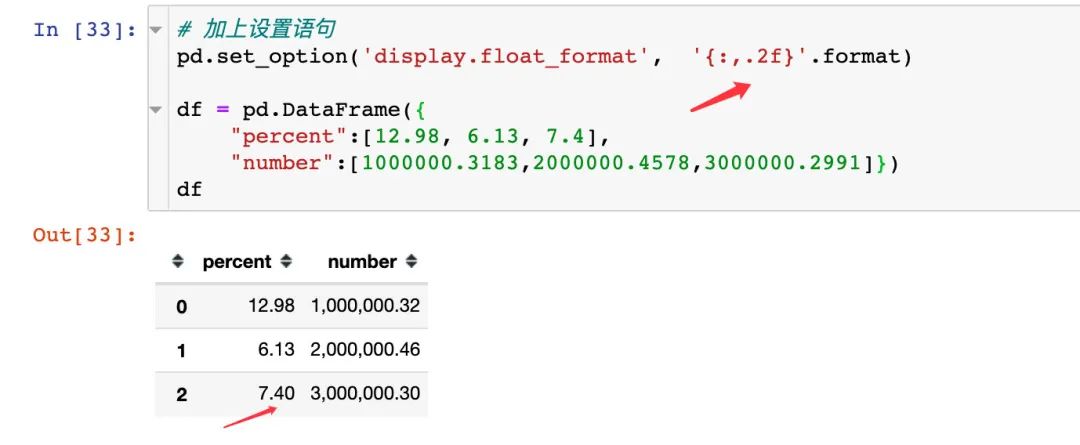
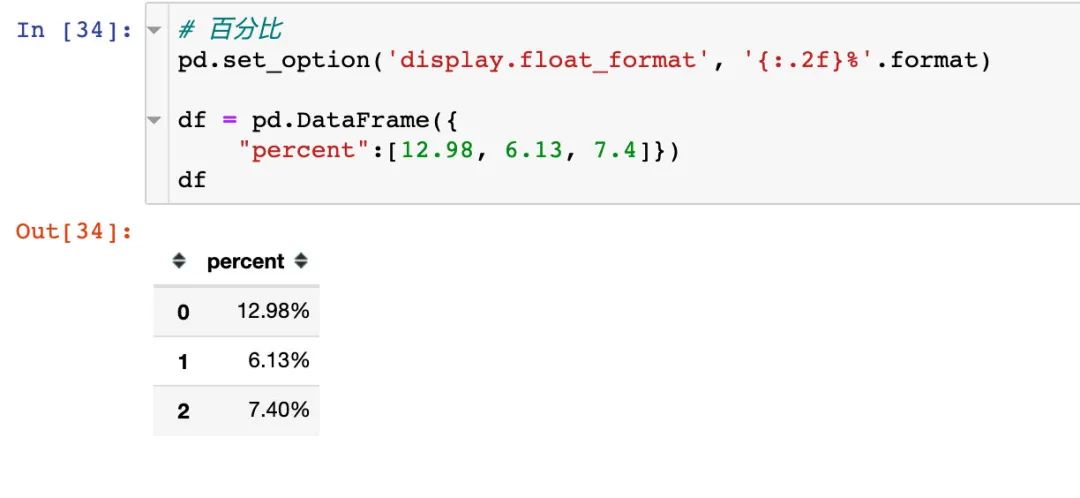
There is a display in Pandas float_ Format method can format and output floating-point numbers, such as expressed in thousandths, percentages, fixed decimal places, etc.
You can also use this method if other data types can be converted to floating point numbers.
The callable should accept a floating point number and return a string with the desired format of the number
Millennial representation
When the data is relatively large, it is hoped to express the data in the form of thousandths, which is clear at a glance:
df = pd.DataFrame({
    "percent":[12.98, 6.13, 7.4],
    "number":[1000000.3183,2000000.4578,3000000.2991]})
df

percentage
Special symbols
In addition to the% sign, we can also use other special symbols:

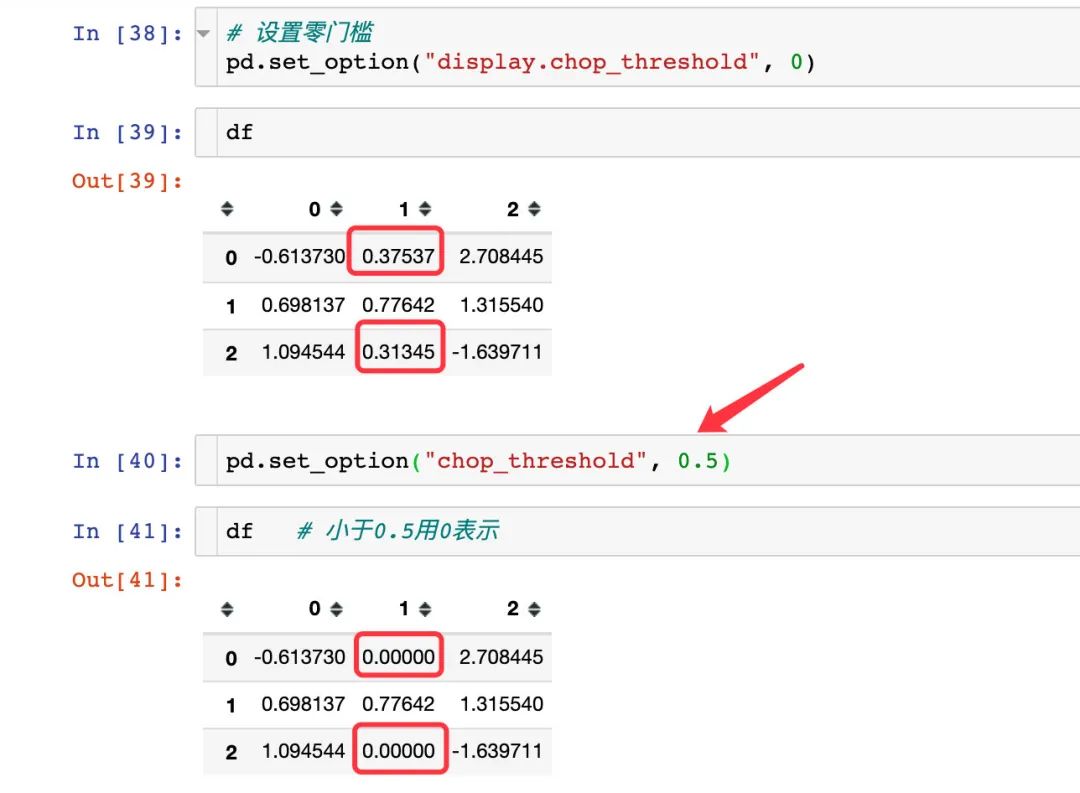
Zero threshold conversion
What does threshold conversion mean? First, the implementation of this function uses display chop_ Threshold method.
Indicates the threshold for displaying data in Series or DF as a number. If it is greater than this number, it will be displayed directly; If less than, it is displayed with 0.

Change drawing method
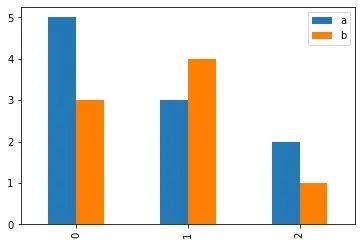
By default, pandas uses matplotlib as the drawing back end. We can modify the settings:
import matplotlib.pyplot as plt
%matplotlib inline

# Default
df1 = pd.DataFrame(dict(a=[5,3,2], b=[3,4,1]))
df1.plot(kind="bar")
plt.show()
Change the back end of the drawing to become a powerful plot:
# Writing method 1
pd.options.plotting.backend = "plotly"

df = pd.DataFrame(dict(a=[5,3,2], b=[3,4,1]))
fig = df.plot()
fig.show()

# Writing method 2
df = pd.DataFrame(dict(a=[5,3,2], b=[3,4,1]))
fig = df.plot(backend='plotly') # Specify here
fig.show()

Modify column head alignment direction
By default, the attribute fields (column headers) are aligned to the right and can be set. Here is an example from the official website:

Print out the current settings and reset all options
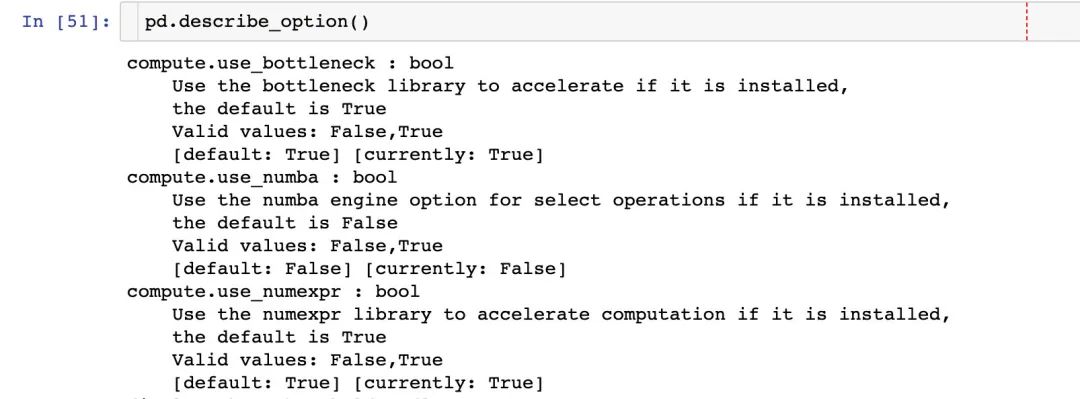
pd.describe_option() prints all current settings and resets all options. Here are some setting options:
Configuration skills
Common configurations are summarized below, which can be used after copying:
import pandas as pd  # International practice

import warnings
warnings.filterwarnings('ignore')  # Ignore warnings in text

pd.set_option( 'display.precision',2)
pd.set_option("display.max_rows",999)  # Maximum number of rows to display
pd.set_option("display.min_rows",20)   # Minimum number of rows to display
pd.set_option('display.max_columns',None)  # All columns
pd.set_option ('display.max_colwidth', 100)   # Modify column width
pd.set_option("expand_frame_repr", True)  # fold
pd.set_option('display.float_format',  '{:,.2f}'.format)  # Thousandth
pd.set_option('display.float_format', '{:.2f}%'.format)  # Percentage form
pd.set_option('display.float_format', '{:.2f}¥'.format)  # Special symbols
pd.options.plotting.backend = "plotly"  # Modify drawing
pd.set_option("colheader_justify","left")  # Column field alignment
pd.reset_option('all')  # Reset
Technical exchange
Welcome to reprint, collect, gain, praise and support!

At present, a technical exchange group has been opened, with more than 2000 group friends. The best way to add notes is: source + Interest direction, which is convenient to find like-minded friends
- Method ① send the following pictures to wechat, long press identification, and the background replies: add group;
- Mode ②. Add micro signal: dkl88191, remarks: from CSDN
- WeChat search official account: Python learning and data mining, background reply: add group
