hello everyone! Here is a record of a non professional Xiaobai's path to learn python, which is completely zero basic self-study. As the author just graduated from college, he doesn't like the job he found in his major, has a long free time, and studies Python on the job. He wants to use this platform to record his learning path. I hope the leaders can actively point out any mistakes in the article. Thank you very much! I hope to learn and make progress with you. Thank you. Book based Python Programming: from introduction to practice Author: Eric Matthes [beauty]
1, Review yesterday's study
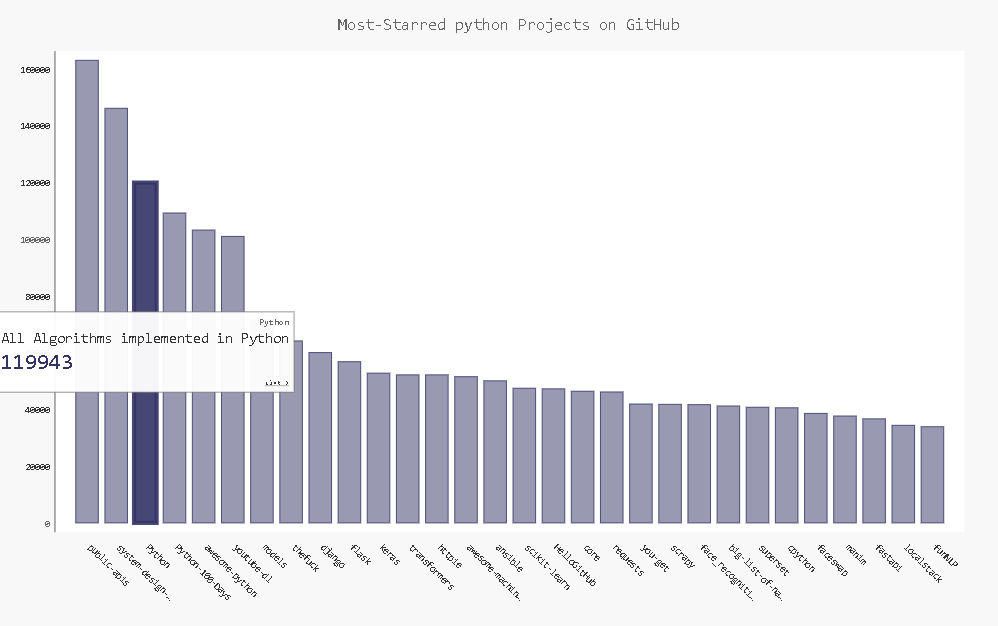
Yesterday, I mainly learned to use pygal to visualize the file data obtained from the website. Yesterday's content was mainly the setting of pygal chart, such as chart title, font size, label, hiding useless horizontal lines, setting chart size, adding links, etc, If you want to know more about these contents, you can pay attention to the author and read the learning diary written by the author for joint learning and research.
design sketch:
Yesterday's knowledge point exercise:
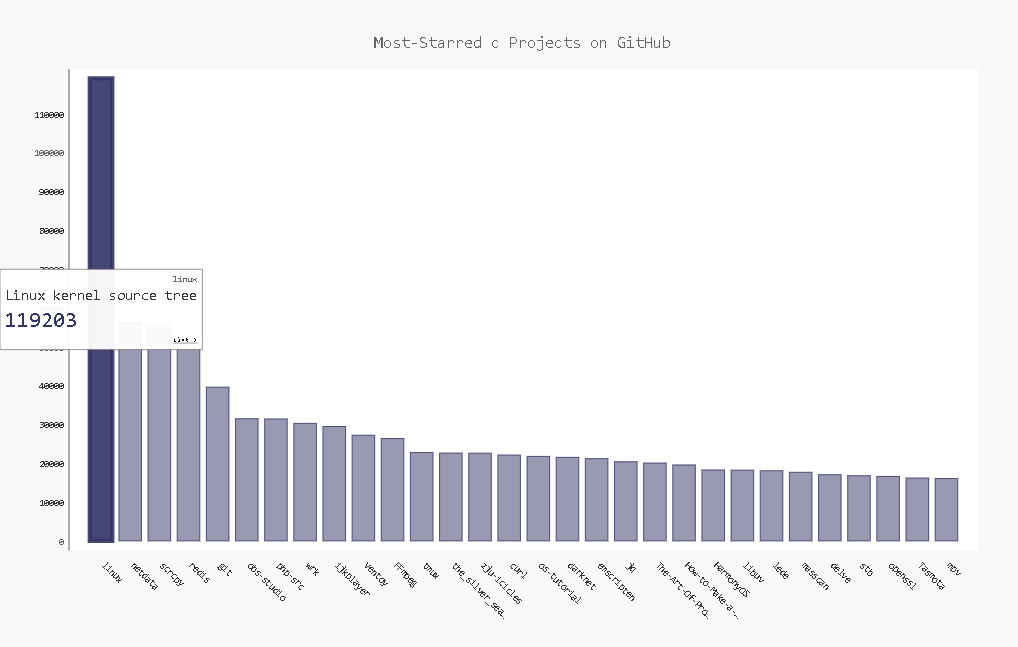
17-1 other languages: modifying Python_ API calls in repos.py to show the most popular projects written in other languages in the generated diagram. Try the languages JavaScript, Ruby, C, Java, Perl, Haskell, Go, etc.
Change python in yesterday's source code to the language you need to try, such as c language
url = 'https://api.github.com/search/repositories?q=language:c&stats'
Change the title of the chart to the required language. The source code of yesterday can be obtained by referring to the author's yesterday study diary
2, web API chapter review
This chapter mainly learned how to use web API to obtain data from the network and clearly define the required data, so as to facilitate the use of pygal visual data. What is a URL and what is the role of a URL?, requests is installed as the media for obtaining data, pygal, some settings for drawing charts, and so on.
Chapter summary review questions:
17-2 the most active discussion: using HN_ Based on the data in submissions.py, create a bar chart to display the most active discussions on Hacker News. The height of the bar should correspond to the number of comments received by the article. The label of the bar should contain the title of the article, and each bar should be a link to the discussion page of the article.
Source code:
#coding=gbk

#hn_submissions.py


import requests
from operator import itemgetter

import pygal
from pygal.style import LightColorizedStyle as LCS, LightenStyle as LS


#Execute the API call and store the response

#Get uniform resource locator

url = 'https://hacker-news.firebaseio.com/v0/topstories.json'
r = requests.get(url)

print("Status code:",r.status_code)#Verify response

#Process information about each article
#Store the API response in a variable
submission_ids = r.json()#Using json format to convert data into json dictionary
submission_dicts = []
for submission_id in submission_ids[:30]:
	#For each article, an API call is executed
	url = ('https://hacker-news.firebaseio.com/v0/item/'+
			str(submission_id)+'.json')

	submission_r = requests.get(url)
	print(submission_r.status_code)
	response_dict = submission_r.json()


	submission_dict = {
				'title':response_dict['title'],
				'link':'http://news.ycombinator.com/item?id='+str(submission_id),
				'comments':response_dict.get('descendants',0)

				}
	submission_dicts.append(submission_dict)

submission_dicts = sorted(submission_dicts,key=itemgetter('comments'),reverse=True)


for submission_dict in submission_dicts:
	print('\nTitle:',submission_dict['title'])
	print('DIscussion link:',submission_dict['link'])
	print('Comments:',submission_dict['comments'])


#Explore information about the warehouse

titles, plot_dicts = [],[]
for submission_dict in submission_dicts:
	titles.append(submission_dict['title'])

	#To plot_ The dictionary list is passed in dicts to facilitate the display of item description and star number during chart interaction
	plot_dict = {
		'value':submission_dict ['comments'],
		'label':submission_dict['title'],
		'xlink':repo_dict['link'],#Add clickable links to the chart
		}
	plot_dicts.append(plot_dict)

#visualization
my_style = LS('#333366',base_style=LCS) #Set the base color to dark blue

my_config = pygal.Config()#Create instance
my_config.x_label_rotation=45#Rotate the x-axis label 45 degrees to prevent overlap
my_config.show_legend = False#Hide legend
my_config.title_font_size = 24#Set title, label font size
my_config.label_font_size = 14
my_config.major_label_font_size = 18
my_config.truncate_label = 15
my_config.show_y_guides = False#Hide horizontal lines in chart
my_config.width = 1000#Defines the width of the chart for easy reading


chart = pygal.Bar(my_config,style=my_style)
chart.title ='Most-comment python Projects on Hacker News'
chart.x_labels = titles

chart.add("",plot_dicts)
chart.render_to_file('python_submissions.svg')