Original address: https://mysqlserverteam.com/mysql-explain-analyze/
MySQL 8.0.18 was just released. October 17, 2019 ), which includes a new feature to analyze and understand how queries are executed: explain analyze.
What is explain analyze
EXPLAIN ANALYZE is a query analysis tool that tells you how much time MySQL spends on queries and why.It plans, measures, and executes queries, counts rows, and measures the time spent at different stages of executing the plan.
When execution is complete, EXPLAIN ANALYZE prints the plan and measurements, not the query results.(Translator's Note: To be frank, explain analyze will actually execute the current query, return execution plans and cost information, but will not return the results of the query itself)
This new feature was built on top of the regular EXPLAIN query plan checking tool and can be seen as an extension of explain forat = tree that was previously added in MySQL 8.0.
In addition to the query plan and estimated cost that ordinary explainers will print, explain analyze also outputs the actual cost of a single iterator in the execution plan.
How to use explain analyze
As an example, we will use data from the Sakila Sample database and a query that lists the total amount of work each employee completed in August 2005.The question is simple:
SELECT first_name, last_name, SUM(amount) AS total
FROM staff INNER JOIN payment
  ON staff.staff_id = payment.staff_id
     AND
     payment_date LIKE '2005-08%'
GROUP BY first_name, last_name;

+------------+-----------+----------+
| first_name | last_name | total    |
+------------+-----------+----------+
| Mike       | Hillyer   | 11853.65 |
| Jon        | Stephens  | 12218.48 |
+------------+-----------+----------+
2 rows in set (0,02 sec)
Only two people, Mike and Jon, we got their total in August 2005, EXPLAIN FORMAT=TREE will show the execution plan and cost information
 1 EXPLAIN FORMAT=TREE
 2 SELECT first_name, last_name, SUM(amount) AS total
 3 FROM staff INNER JOIN payment
 4   ON staff.staff_id = payment.staff_id
 5      AND
 6      payment_date LIKE '2005-08%'
 7 GROUP BY first_name, last_name;
 8
 9 -> Table scan on <temporary>10     -> Aggregate using temporary table
11         -> Nested loop inner join  (cost=1757.30 rows=1787)
12             -> Table scan on staff  (cost=3.20 rows=2)
13             -> Filter: (payment.payment_date like '2005-08%')  (cost=117.43 rows=894)
14                 -> Index lookup on payment using idx_fk_staff_id (staff_id=staff.staff_id)  (cost=117.43 rows=8043)
But it doesn't tell us if these estimates are correct or what operations in the query plan actually take time.EXPLAIN ANALYZE does this:
 1 EXPLAIN ANALYZE
 2 SELECT first_name, last_name, SUM(amount) AS total
 3 FROM staff INNER JOIN payment
 4   ON staff.staff_id = payment.staff_id
 5      AND
 6      payment_date LIKE '2005-08%'
 7 GROUP BY first_name, last_name;
 8
 9 -> Table scan on <temporary>  (actual time=0.001..0.001 rows=2 loops=1)
10     -> Aggregate using temporary table  (actual time=58.104..58.104 rows=2 loops=1)
11         -> Nested loop inner join  (cost=1757.30 rows=1787) (actual time=0.816..46.135 rows=5687 loops=1)
12             -> Table scan on staff  (cost=3.20 rows=2) (actual time=0.047..0.051 rows=2 loops=1)
13             -> Filter: (payment.payment_date like '2005-08%')  (cost=117.43 rows=894) (actual time=0.464..22.767 rows=2844 loops=2)
14                 -> Index lookup on payment using idx_fk_staff_id (staff_id=staff.staff_id)  (cost=117.43 rows=8043) (actual time=0.450..19.988 rows=8024 loops=2)
Here are some new measures:
- Get the actual time of the first row (milliseconds)
- Get the actual time for all rows in milliseconds
- Actual number of rows read
- Actual number of loops
Let's look at a specific example of filtering the iterator's cost estimates and actual measurements by selecting the August 2005 sales (line 13 in the EXPLAIN ANALYZE output above).
Filter: (payment.payment_date like '2005-08%')
(cost=117.43 rows=894)
(actual time=0.464..22.767 rows=2844 loops=2)
The estimated cost of the filter is 117.43 and the estimated return is 894 rows, which the query optimizer makes based on available statistics before executing the query.This information also appears as an EXPLAIN FORMAT=TREE output.
From the number of loops, the number of loops for this filter iterator is 2.What does this mean? To understand this number, we have to look at filtering iterators in the query plan.
There is a nested loop join in line 11 and a table scan of the staff table in line 12.
This means that we are performing a nested loop join where we scan the staff table and for each row in the table, we use index lookups and filter payment dates to find the corresponding row in the payment table.
Because there are two rows in the staff table (Mike and Jon), we iterate twice through the filter and index lookup on row 14.
For many people, one interesting piece of information provided by EXPLAIN ANALYZE is the actual time consumed,'0.464..22.767'.
This means an average reading time of 0.464 ms for the first row and 22.767 ms for all rows.
Is it an average? Yes, because of loops, we have to time the iterator twice, and the reported number is the average for all loop iterations.
This means that filtering actually takes twice as long as these numbers, so if we look at the time it takes to receive all rows in a nested loop iterator (line 11), it is 46.135 ms, more than twice as long as running a filter iterator at a time.
Translator's Note:
The rule of time cost calculation here is that the execution time of each step is the sum of the execution time of its sub-steps, and the time-containment relationship of these steps is as follows:
The total time for the Nested loop inner join layer is 58.104ms, which is the time cost for the entire join and includes
"Table scan on staff table" and "Time of Filter on payment table"
The filter's time also includes "index lookup" + "where condition filter condition". The most time-consuming step is index lookup, which is also the process of data query.
The index lookup step takes 19.988*2, which means two iterations, so most of the time spent in the whole loop join process is in this index lookup lookup lookup lookup lookup lookup.
Filter (22.767) = payment_twice on averageDate like'2005-08%'filter + Index lookup on payment lookup (19.988)
The actual number of rows read is 2844, while the estimate is 894.The optimizer missed a factor 3.
Similarly, due to loops, both estimated and actual numbers are averages for all loop iterations.
If we look at the table structure, payment_There is no index or histogram on the date column, so the statistics provided to the optimizer to calculate filter selectivity are limited.
For examples where better statistics produce more accurate estimates, we can look again at the index lookup iterator.We see that the index provides more accurate statistics: a comparison of actual reads between 8043 rows and 8024 rows.
That's good, because the index comes with extra statistics, not with index columns.
So what can you do with this information? Analyzing queries and understanding why they don't perform well requires some practice.But here are some simple tips to get you started:
- If you want to know why it took so long, look at the time and what step did it take to execute it?
-
If you want to know why the optimizer chose the plan, look at the row counters.There is a large difference between the estimated number of rows and the actual number of rows (that is, several orders of magnitude or more), which indicates that you should take a closer look.
The optimizer chooses a plan based on estimates, but looking at actual execution may tell you that another plan is better.
If you want to know why the optimizer chose this plan, look at the row counters.Huge differences.Several orders of magnitude or more between the estimated number of rows and the actual number of rows) is a sign that you should look at it more closely.
The optimizer chooses a plan based on estimates, but looking at actual execution may tell you that another plan is better.
This is it!Another tool in the MySQL Query Analysis toolbox:
- To check the query plan: EXPLAIN FORMAT=TREE
- To track query execution: EXPLAIN ANALYZE
- To understand plan choices: Optimizer trace
I hope you enjoy a quick tour of this new feature, and explanatory analysis will help you analyze and understand slow queries.
Translator Supplement:
For several presentations of MySQL execution plans, explain/explain format=tree/explain format=json/optimizer_trace
Essentially, they are the same, but with different levels of detail. For information that explain analyze rs can also explicitly predict + actually execute, here are some of the information that will be displayed when the sample database used in the translation is imported locally, slightly different from the information above.
1,explain
The simplest or coarsest way to explicitly execute a plan can be explicit: how tables are accessed, the order in which they are driven, and other information in the Extra column, including whether sorting is generated, the use of temporary table spaces, and so on.
2,expalin format = tree
Similar to explain analyze, it also contains cost information for each step of the estimate, only estimate information, not actual execution information
1 -> Table scan on <temporary>
2     -> Aggregate using temporary table
3         -> Nested loop inner join  (cost=1757.30 rows=1787)
4             -> Table scan on staff  (cost=3.20 rows=2)
5             -> Filter: (payment.payment_date like '2005-08%')  (cost=117.43 rows=894)
6                 -> Index lookup on payment using idx_fk_staff_id (staff_id=staff.staff_id)  (cost=117.43 rows=8043)
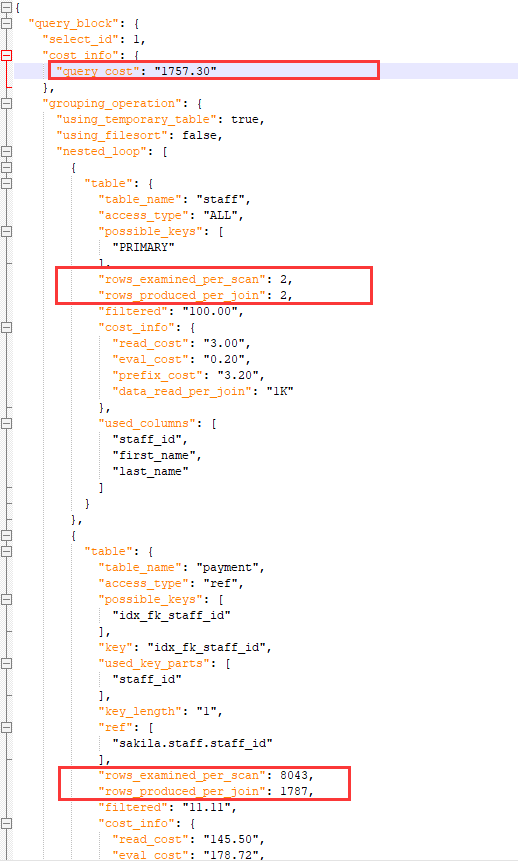
3,explain format = json
Explicitly in json format is similar to expalin format = tree in that, to be honest, readability is not included in expalin format = tree
 1 {
 2   "query_block": {
 3     "select_id": 1,
 4     "cost_info": {
 5       "query_cost": "1757.30"
 6     },
 7     "grouping_operation": {
 8       "using_temporary_table": true,
 9       "using_filesort": false,
10       "nested_loop": [
11         {
12           "table": {
13             "table_name": "staff",
14             "access_type": "ALL",
15             "possible_keys": [
16               "PRIMARY"
17             ],
18             "rows_examined_per_scan": 2,
19             "rows_produced_per_join": 2,
20             "filtered": "100.00",
21             "cost_info": {
22               "read_cost": "3.00",
23               "eval_cost": "0.20",
24               "prefix_cost": "3.20",
25               "data_read_per_join": "1K"
26             },
27             "used_columns": [
28               "staff_id",
29               "first_name",
30               "last_name"
31             ]
32           }
33         },
34         {
35           "table": {
36             "table_name": "payment",
37             "access_type": "ref",
38             "possible_keys": [
39               "idx_fk_staff_id"
40             ],
41             "key": "idx_fk_staff_id",
42             "used_key_parts": [
43               "staff_id"
44             ],
45             "key_length": "1",
46             "ref": [
47               "sakila.staff.staff_id"
48             ],
49             "rows_examined_per_scan": 8043,
50             "rows_produced_per_join": 1787,
51             "filtered": "11.11",
52             "cost_info": {
53               "read_cost": "145.50",
54               "eval_cost": "178.72",
55               "prefix_cost": "1757.30",
56               "data_read_per_join": "41K"
57             },
58             "used_columns": [
59               "payment_id",
60               "staff_id",
61               "amount",
62               "payment_date"
63             ],
64             "attached_condition": "(`sakila`.`payment`.`payment_date` like '2005-08%')"
65           }
66         }
67       ]
68     }
69   }
70 }
4,trace
set session optimizer_trace='enabled=ON';
explain sql
In fact, this information is consistent with the predictions in explain format = json or explain analyze, and the data is consistent with expalin format = tree, except that each possibility at the time of access is enumerated in trace.