The official account is rich in data statistics, but there may still be no statistical indicators that I want. For example official account official account is not high but the reading rate is very high. Can I draw a scatter map according to the reading rate of each article in my official account to show my public number operation results?
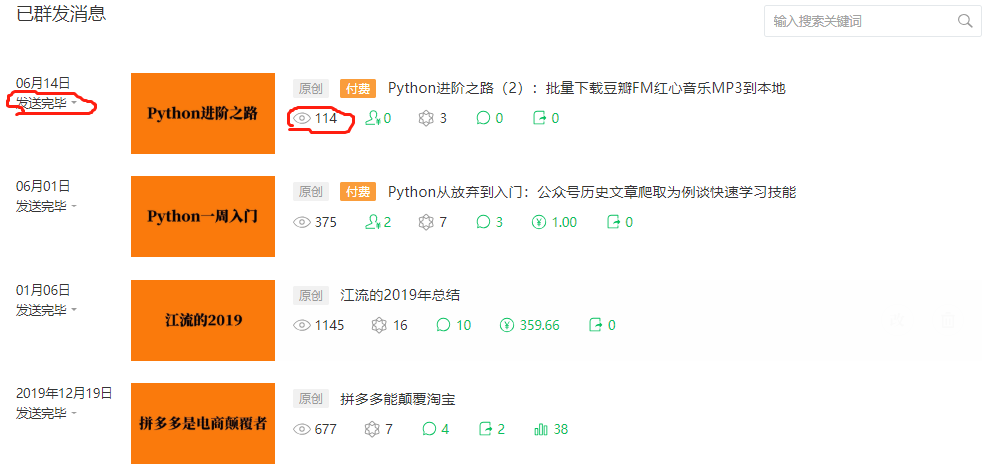
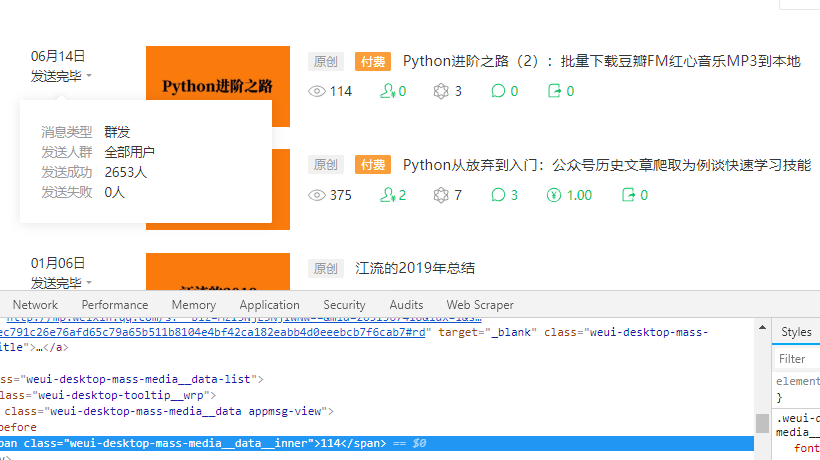
The official account is official account. The master button sends the button to the left side of the public address, and the number of people can be seen. This is the number of fans before the public issue, and the number of reading is below the title. Through the crawler, the number of delivered articles and the number of read articles are extracted in turn. According to the formula: reading rate = number of read articles / number of delivered articles, the reading rate of each article can be calculated.
Idea 1: in data visualization, the current number of fans of this article is used as the horizontal axis, and the reading rate of this article is used as the vertical axis to draw the reading rate distribution of each article. Official account official account is added to the average reading rate, which can show the reading rate of the official account compared with what the general public number is.
Idea two: another way of thinking is to sort the reading rate from small to large, and the horizontal axis is the number of the article, and the vertical axis is the reading rate. This can draw a Pareto progressive graph, plus a supplementary line of average reading rate of the official account. It can intuitively see that the proportion of articles is higher than the average reading rate, and it can let readers ignore the information of fans.
On the basis of scatter chart, we can add the reading amount of the article, which is expressed by the size of scatter. But considering that I have 100 articles representing 100 points, some articles have a very high reading rate, which is inconvenient to read if expressed by the size of scatter, so I give up this idea.
Expected programming logic:
(1) log on to official account home page.
This step has been implemented in the first project that I crawled through the official account url link to generate pdf documents, and I can apply it directly.
(2) Define an action to capture the number of people delivered and read.
This is a difficulty.
(3) Carry out the circulation, grab 7 pieces of article data of each page in turn, and write them into a dictionary data.
The for cycle of public number turning over has been implemented in the first official account of the official account. This is a slightly adapted application.
(4) Save the data to a csv file.
This has been done before.
(5) Import the data in the csv file through pandas, and clean the data, such as calculating the reading rate.
(6) Through matplotlib and other libraries, according to the cleaned data, drawing.
In practice, we have encountered many problems. We have solved them one by one and pushed forward step by step.
Specific steps
Import module
Later, I imported the following modules, not all of which are used. I didn't want to import them at first, but I found that I need to import some modules slowly during the process of implementing the program.
from selenium import webdriver
import re
import time
import pickle
import csv
from selenium.common.exceptions import TimeoutException
Landing official account background
Python has been talked about from giving up to getting started. A function of landing is constructed, then the login function is called, and the incoming parameter is the username and password of the official account.
def login(username, password):
    #Open the login page of WeChat official account.
    driver.get('https://mp.weixin.qq.com/')
    driver.maximize_window()
    time.sleep(3)
    driver.find_element_by_xpath("//*[@id=\"header\"]/div[2]/div/div/div[2]/a").click()
    # Auto fill in account password
    driver.find_element_by_xpath("//*[@id=\"header\"]/div[2]/div/div/div[1]/form/div[1]/div[1]/div/span/input").clear()
    driver.find_element_by_xpath("//*[@id=\"header\"]/div[2]/div/div/div[1]/form/div[1]/div[1]/div/span/input").send_keys(username)
    driver.find_element_by_xpath("//*[@id=\"header\"]/div[2]/div/div/div[1]/form/div[1]/div[2]/div/span/input").clear()
    driver.find_element_by_xpath("//*[@id=\"header\"]/div[2]/div/div/div[1]/form/div[1]/div[2]/div/span/input").send_keys(password)
    time.sleep(1)
    #Automatically click the login button to log in
    driver.find_element_by_xpath("//*[@id=\"header\"]/div[2]/div/div/div[1]/form/div[4]/a").click()
    # Scan QR code manually!
    time.sleep(15)
Define the function to capture the number of delivered and read
Use Chrome browser to login the official account background, check the web page code by F12, and click the ctrl+shift+C combination key to view a specific element on the web page. The xpath of the element containing the number of people delivered text is
“//*[@id=“list”]/li[1]/div[1]/div[1]/span/div/div/div[2]/p[1]/span”. The way to view the xpath is to click on the line of this element in the source code and right-click to select - copy copy xpath.
The xpath of reading number is "/ / * [@ id =" list "] / li[1]/div[2]/span/div/div[2]/div/div[1]/div/span. Because xpath is a precise location, there is only one xpath for an element in a web page, but I want to extract 7 same elements from this web page. If I choose xpath location, I will check the construction rules of these 7 elements. Or I can use class and other elements to locate, so I can often find the same class element seven times, and then use for loop to traverse.
I have tried several ways to locate elements. In this project, I finally decided to use xpath to locate elements. If readers don't believe in evil, they can try other ways to locate elements.
Find the law of the seven elements' xpath, and send them only to increase the I in li[i], which can be formatted with the format function.
Find the explanation of format function in the rookie tutorial.
Functions for formatting strings str.format(), which enhances string formatting.
The basic syntax is to replace the previous% with {} and:.
The format function can take any number of parameters, and the positions can be out of order.
>>>"{} {}".format("hello", "world")    # Do not set the specified location, in the default order
'hello world'
>>> "{0} {1}".format("hello", "world")  # Set specified location
'hello world'
>>> "{1} {0} {1}".format("hello", "world")  # Set specified location
'world hello world'
So I use the format function to construct the xpath path.
'readnum': driver.find_element_by_xpath('//*[@id=\"list\"]/li[{0}]/div[2]/span/div/div[2]/div/div[1]/div/span'.format(i)).text,
After the for loop is constructed, run the program, and it is found that the extracted data has not been delivered to the number of people, but has been read. Guess that the data of the number of people delivered is hidden. You need to click the number of people delivered button to call the data.
At the beginning of each cycle, the number of people who click to deliver is set. As a result, the number of people served in the first row of data has data, but there is no data in the next six rows.
Then it was found that the new data box just blocked the second row of data after clicking the number of delivered people button, resulting in the failure to extract the subsequent data.
Therefore, after each data extraction, click a certain position of the page with the mouse, and there is no response after clicking this position.
After running the program, it is found that the data can be crawled, but some data can not be crawled. When viewing the data, it is found that when there is a deleted article, the data of the next article after the deleted article cannot be extracted. So when the program fails to execute, let the mouse click on some unresponsive position on the page, and then continue to continue the program cycle.
After running, it is found that there are two pieces of data out of 100 pieces of data that have not been extracted. Run the program again, and it is found that there are two pieces of data that have not been extracted, and they are not exactly the same as the last two pieces of data. Guess it's because the program runs too fast and the server doesn't have time to return data. So it is set to sleep for one second every time.
The final code to obtain the number of delivered and read pages is as follows:
def get_postnum_readnum(html):
    lst = []
    for i in range(1, 8):
            try:
                driver.find_element_by_xpath("//*[@id=\"list\"]/li[{0}]/div[1]/div[1]".format(i)).click()
                time.sleep(1)
                temp_dict = {
                    'postnum': driver.find_element_by_xpath("//*[@id=\"list\"]/li[{0}]/div[1]/div[1]/span/div/div/div[2]/p[1]/span".format(i)).text,
                    'readnum': driver.find_element_by_xpath('//*[@id=\"list\"]/li[{0}]/div[2]/span/div/div[2]/div/div[1]/div/span'.format(i)).text,
                    'title': driver.find_element_by_xpath(
                        '//*[@id="list"]/li[{0}]/div[2]/span/div/div[2]/a/span'.format(i)).get_attribute(
                        'textContent'),
                    'date': driver.find_element_by_xpath("//*[@id=\"list\"]/li[{0}]/div[1]/em".format(i)).text,
                }
                driver.find_element_by_xpath("//*[@id=\"list_container\"]/div[1]/div[2]/div/span/input").click()
                lst.append(temp_dict)
            except:
                driver.find_element_by_xpath("//*[@id=\"list_container\"]/div[1]/div[2]/div/span/input").click()
                continue
    return lst
Cycle and grab 7 pieces of data on each page in turn
The code is similar to Python from giving up to getting started.
#Start Google browser with webdriver
chrome_driver = r"C:\Users\jiansi\PycharmProjects\jiansidata\venv\Lib\site-packages\selenium\webdriver\chrome\chromedriver.exe"
driver = webdriver.Chrome(executable_path=chrome_driver)
"""You need to manually input the official account number, password, and the name of the public number to be exported to WeChat official account."""
username = '' # account number
password = '' # password
login(username, password)
page_num = int(driver.find_elements_by_class_name('weui-desktop-pagination__num__wrp')[-1].text.split('/')[-1])
# Click Next
num_lst = get_postnum_readnum(driver.page_source)
#print(num_lst)
for _ in range(1, page_num):
        try:
            pagination = driver.find_elements_by_class_name('weui-desktop-pagination__nav')[-1]
            pagination.find_elements_by_tag_name('a')[-1].click()
            time.sleep(5)
            num_lst += get_postnum_readnum(driver.page_source)
        except:
            continue
Save data to csv file
The code is similar to Python from giving up to getting started.
with open('2.csv', 'w', encoding="utf-8", newline='') as f:
    writer = csv.DictWriter(f, fieldnames=['postnum', 'readnum', 'title', 'date'])
    writer.writeheader()
    writer.writerows(num_lst)
Import csv data through pandas and clean the data
From this step on, I created a new file write.
Import module, not all of them.
import sys
import pandas as pd
import csv
import matplotlib.pyplot as plt
from matplotlib.pyplot import savefig
import matplotlib as mpl
import numpy as np
import seaborn as sns
from datetime import datetime
from pandas import to_datetime
I read the data in the csv table first to see the reading effect.
"""use pandas read csv Data in the file, generate two-dimensional table, and merge two tables"""
df1 = pd.read_csv('1.csv', delimiter=',', sep='\t', encoding='utf-8')
df2 = pd.read_csv('2.csv', delimiter=',', sep='\t', encoding='utf-8')
print(df1)
print(df2)
df1.info()
df2.info()
Error may be reported due to encoding format, but try to change the encoding format from GBK to gbk18030, or utf-8, unicode, etc.
df.info() is to check the basic situation of the data, so as to check whether there is any error such as null value in the data. This time, there is no null value in the data, so the wrong operations such as handling null value are not adopted here.
Because I extracted data from two official account numbers, and merged the data of two official account numbers, and I only needed a few columns in csv data.
cols1 = df1[['postnum', 'readnum', 'title', 'date']]
cols2 = df2[['postnum', 'readnum', 'title', 'date']]
df3 = cols1.append(cols2, ignore_index=True)
print(df3)
df3 is the data after I merge two tables.
Since the data in my delivery number column is not a pure number, but a string of * * people, I need to remove the word and change it to integer data.
I found some pandas tutorials or formula collections, and found that there was no better way to process the data of a column.
Later, I learned that it can be implemented with the apply() function in panda. In addition, the apply function can also generate new columns by calculating some columns, so the task of calculating the reading rate can also be completed through the apply() function. In fact, Excel uses various operations of functions. In pandas, you can basically use the apply() function to complete them.
Link to this article to explain the apply (), map (), applymap () function very well. https://zhuanlan.zhihu.com/p/100064394?utm_source=wechat_session
I implement the code to remove the word "human" from the data
"""Implement changes postnum The data of 149 people in the column is 149, and the change is refreshed to dataframe Medium."""
def postnum_int(series):
    postnum = series['postnum']
    postnum_int = int(postnum[0:-1])
    return postnum_int
df3['postnum'] = df3.apply(postnum_int, axis=1)
print(df3)
In this code, I define a transformation method, then use the apply function to reference this transformation method, refresh by column, and change the generated data to the original column.
Similarly, I generated reading rate data.
"""Increase reading rate data"""
def read_rate(series):
    postnum = series['postnum']
    readnum = series['readnum']
    read_rate = readnum / postnum
    return read_rate
df3['read_rate'] = df3.apply(read_rate, axis=1)
print(df3)
Sort can be used_ The index() function sorts by sequence number, or sort_ The values() function sorts by value.
I generated two data in two sorts.
"""Yes dataframe according to postnum Sort from small to large"""
df4 = df3.sort_values(axis=0, ascending=True, by='postnum')
print(df4)
"""Yes dataframe according to read_rate Sort from small to large"""
df5 = df3.sort_values(axis=0, ascending=True, by='read_rate')
print(df5)
After passing the data into the mapping function of matplotlib, we found that some reading rates were too high, which affected the effect of the graph. So we decided to delete some data with too high reading rates and three data with reading rates higher than 1500%.
Use the drop() function to delete a row of data.
"""Delete a row of data"""
df6 = df4.drop(df4[df4.read_rate > 15].index, inplace=False)
print(df6)
df7 = df5.drop(df5[df5.read_rate > 15].index, inplace=False)
print(df7)
matplotlib drawing
Saved a png picture to a folder. I added two auxiliary lines in the figure, a red line for reading rate of 8% and a green line for reading rate of 50%.
"""use matplotlib Generate bubble chart,according to postnum sort"""
fig = plt.figure()
ax = fig.add_subplot(111)
ax.scatter(df6['postnum'], df6['read_rate'], )
ax.set_xlabel('postnum')
ax.set_ylabel('read_rate')
plt.axhline(y=0.08, ls=":", c="red")
plt.axhline(y=0.5, ls=":", c="green")
plt.savefig('readrate1.png', dpi=750, bboxinches='tight')
plt.show()
As can be seen from the figure, the reading rate is generally higher than 8% and also generally higher than 50%.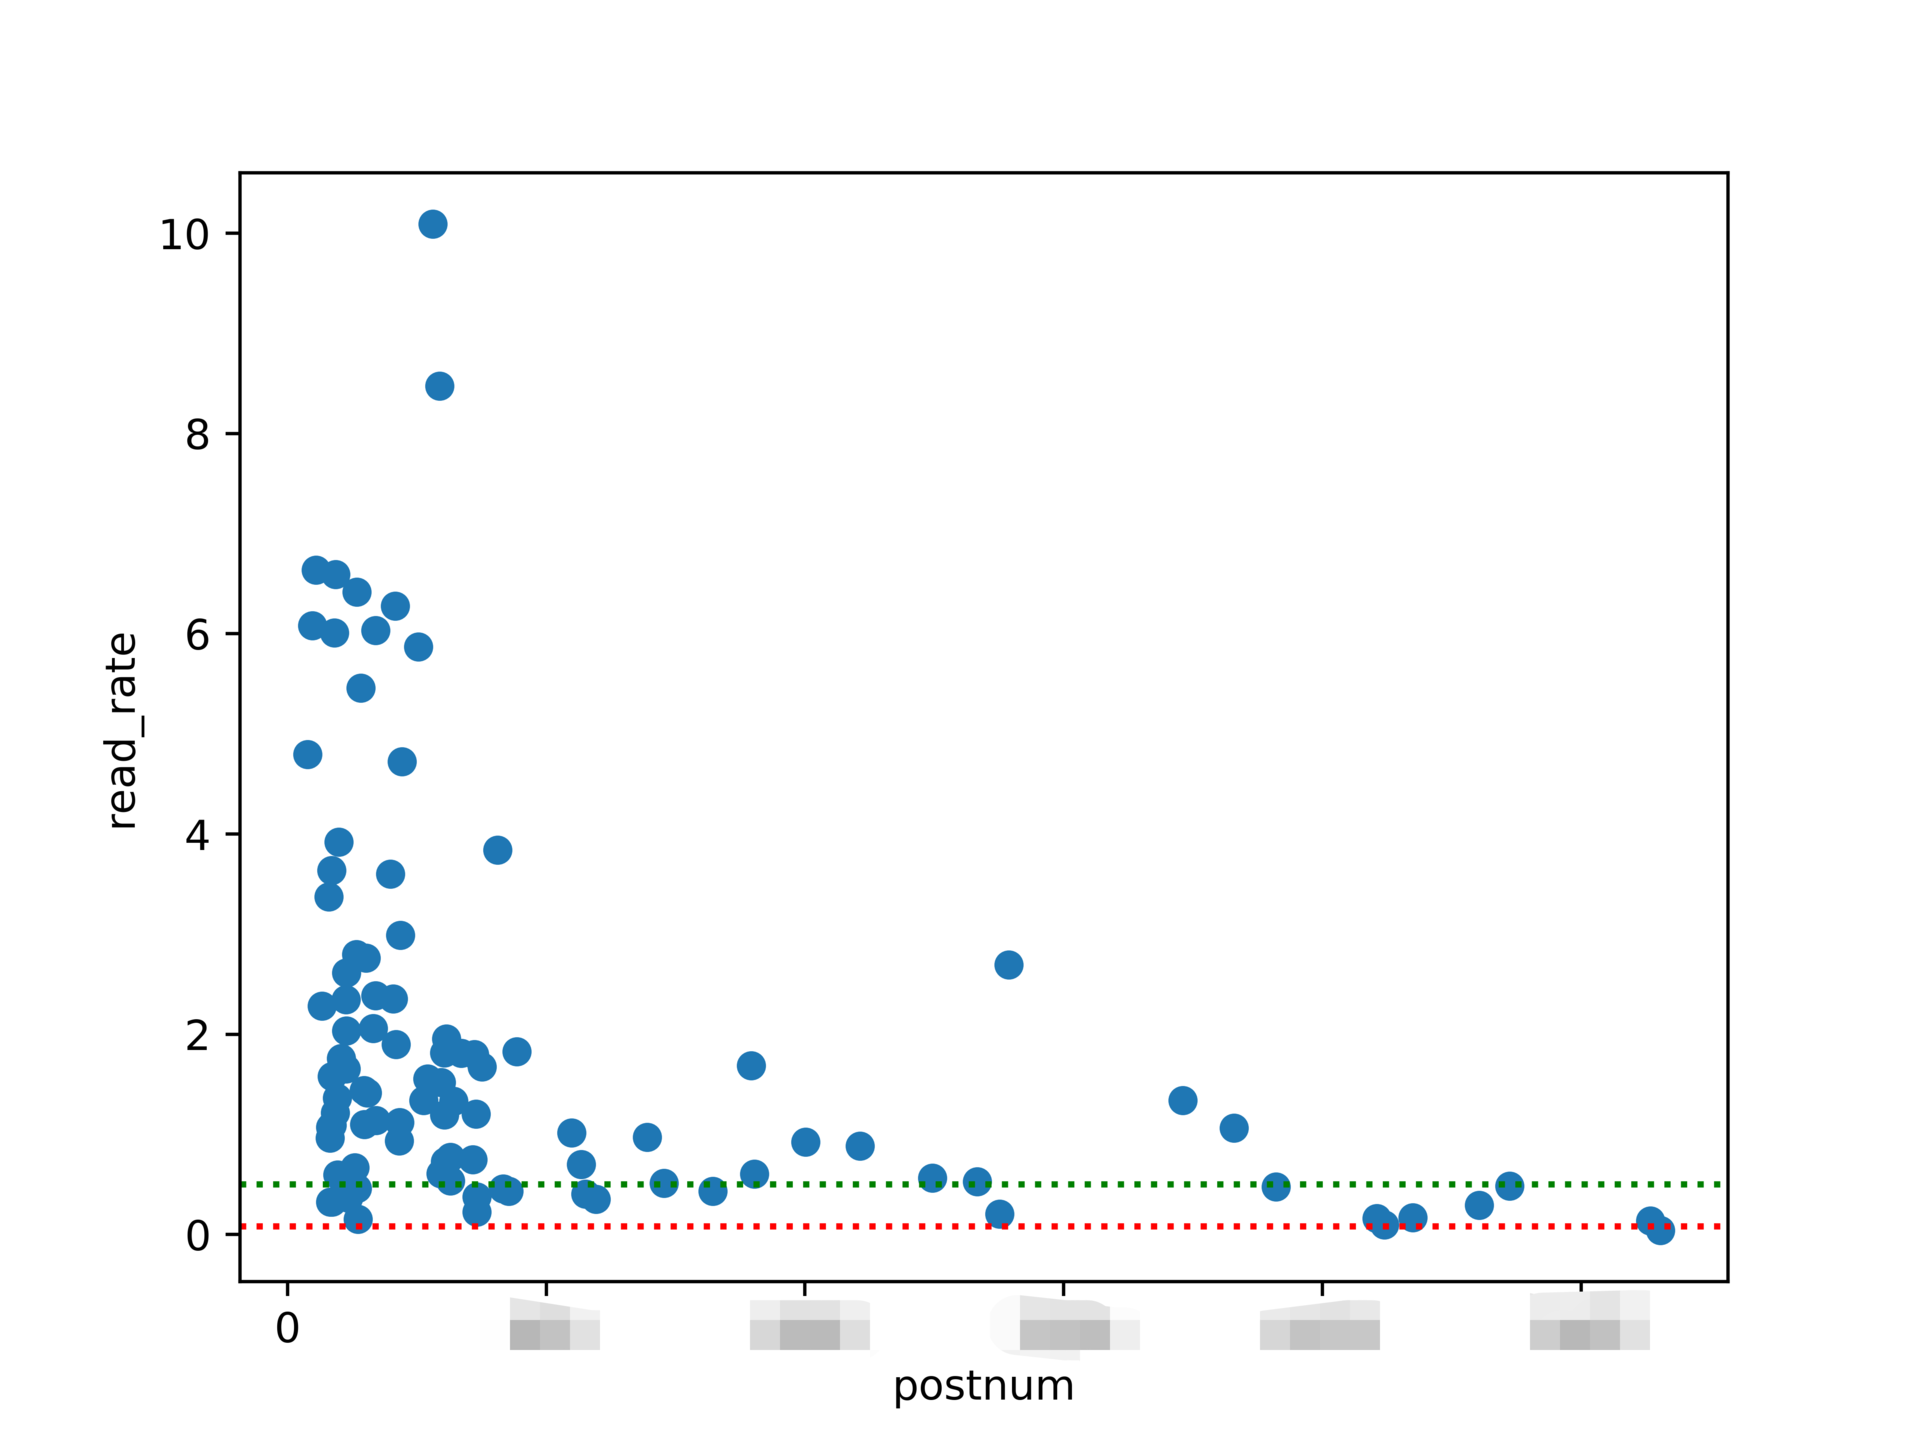
According to train of thought 2, the articles are sorted by reading rate from small to large. The horizontal axis is the article number, and the vertical axis is the reading rate. It is more intuitive to show the proportion of articles higher than a certain reading rate.
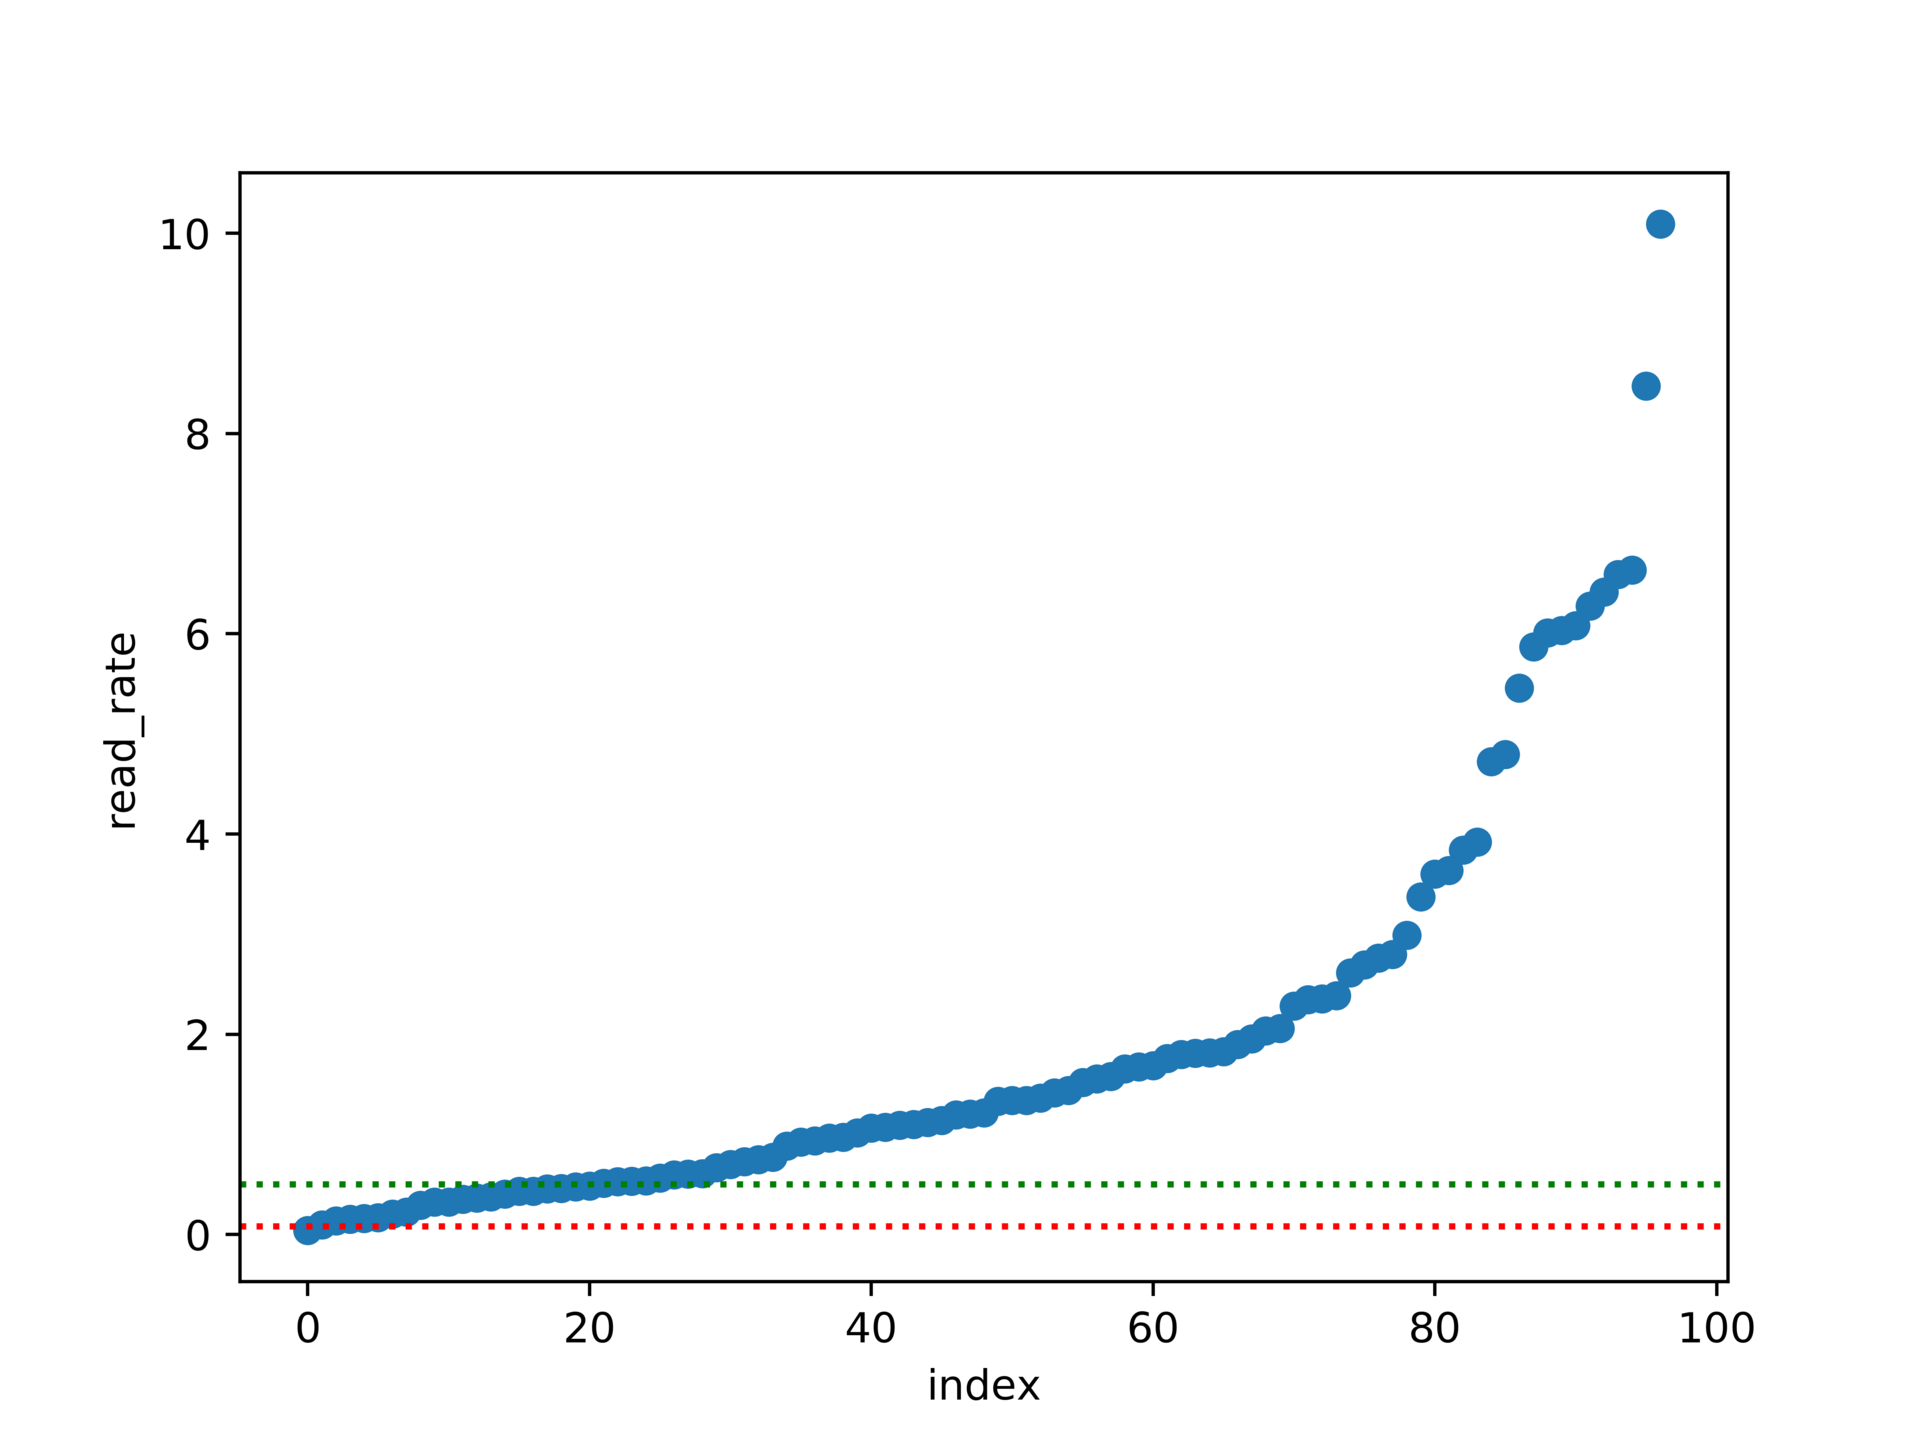
It can be seen from the figure that about 80% of my articles have a reading rate of more than 50%, over 95% of my articles have a reading rate of more than 8%, and about 20% of my articles have a reading rate of more than 400%. The following is the code implementation of this figure.
df7['index'] = np.arange(len(df7))
df7 is an array sorted by reading rate. The purpose of the above sentence is to generate a column of index and output the number according to the row number of each piece of data.
"""use matplotlib Generate a scatter chart with the horizontal axis as the article number"""
df7['index'] = np.arange(len(df7))
print(df7)
fig = plt.figure()
ax = fig.add_subplot(111)
ax.scatter(df7['index'], df7['read_rate'], )
ax.set_xlabel('index')
ax.set_ylabel('read_rate')
plt.axhline(y=0.08, ls=":", c="red")
plt.axhline(y=0.5, ls=":", c="green")
plt.savefig('readrate1.png', dpi=750, bboxinches='tight')
plt.show()
The above project is completed.
There are several packages for drawing: matplotlib, seaborn, plotnine, and pyecharts. You can experience other packages if you are interested.