With the continuous expansion of the company's business scale and the increase of the number of operation, maintenance and management machines, the introduction of automation means to reduce pressure for stretched work has become a top priority. This article shares the author's case of how to effectively combine ZABBIX API to realize batch monitoring in the process of enterprise DevOps.
1. Preconditions
1.1. Interface analysis
If there is a new monitoring requirement: the owner wants to quickly associate a monitoring item of a batch of hosts to a diagram (non grpfunc superposition), that is, compare the resource usage of these hosts vertically in terms of CPU, MEM, DISK and other dimensions. Obviously, when the number of hosts exceeds a certain amount, manual creation will be very boring and cumbersome. Fortunately, Zabbix provides an API. By analyzing the graph.create chart interface in Zabbix Docs, we know the host HostID to be provided, the monitoring item key ItemID, and the zagbix used Methods mainly include: User Host HostGroup Item Graph and other five methods.
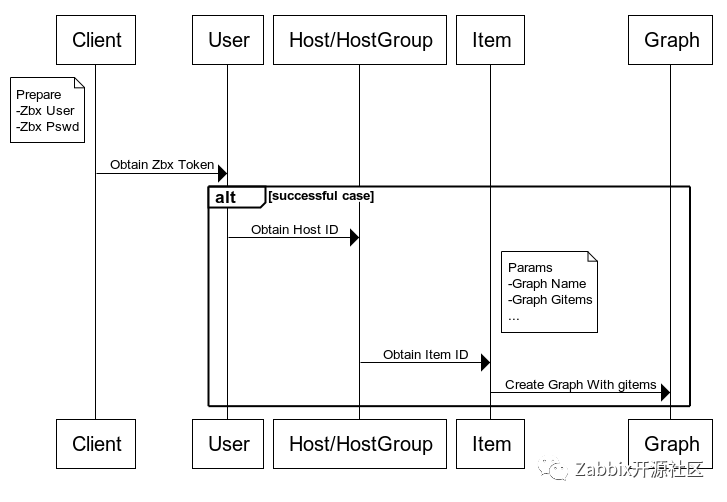
As shown in the figure above, the main script logic of this batch chart creation is described, that is, first obtain the Zabbix authentication token, then query the host or host group to obtain its HOSTID, then obtain the specified monitoring key ID in turn with the HOSTID to join the list pool, and finally request the graph at one time Create to create a chart.
1.2. Environmental agreement
System / tools | edition |
|---|---|
Zabbix | 5.0.1 |
CentOS | 7.6.1810 |
Python | 3.6.8 |
This automation case script is in zabbix5 0 passed the verification and theoretically supports zabbix5 4. The major version has backward compatibility.
2. Build interfaces
2.1. Certification class (AUTH)
Create the AUTH class and declare a private function__ init__, It is used to initialize the Zabbix interface, Zabbix user name and Zabbix password. If conditions permit, it is recommended to use SuperAdmin to override the user, and then conduct fine permission management after running through.
class AUTH(object):
    def  __init__(self):
        self.zabbix_api = set.Zabbix["api"]
        self.zabbix_user = set.Zabbix["user"]
        self.zabbix_pass = set.Zabbix["pass"]
Create the rcpResult function to bridge the Zabbix API data channel. The Zabbix API uses JSON-RPC 2.0 protocol, which is provided as part of the Web front end and supports HTTP POST protocol.
def rpcResult(self, params):
    headers = {"Content-Type": "application/json-rpc"}
    rsp = requests.post(url=self.zabbix_api, headers=headers, data=json.dumps(params))
    try:
        return  rsp.json()["result"]
    except:
        set.logger.error(rsp.json()["error"])
        exit(1)
To create the getToken function, you need to apply for an authentication token before entering the mysterious world of ZABBIX API. The official provided a user The method of login calls the method. Its user and password parameters are Web account secret information, and id is the identifier of the request. It supports three data types: integer, floating-point and string.
def getToken(self):
    params = {
        "jsonrpc": "2.0",
        "method": "user.login",
        "params": {
            "user": self.zabbix_user,
            "password": self.zabbix_pass,
        },
        "id": "Chasii"
    }
    return self.rpcResult(params)
By calling get of AUTH class_ Token function AUTH() Get_Token(), the result returned by the interface, is our key to the mysterious world.
{
    "jsonrpc": "2.0",
    "result": "22e6f614a89ccc1c1226429c4b7b08a0",
    "id": "Chasii"
}
It is worth noting that through user The authentication token requested by the login method is permanently valid and will not be released by the system. Frequent scheduling will produce a large number of opensession records, thus occupying system resources. Here are three solutions:
- 1. Check the auto logout option of the corresponding user on the Web side and set the time to make it invalid automatically.
- 2. The identity verification token is cached into text or stored in the middleware, which can be called repeatedly,
- 3. Use user Logout method, i.e. use and sell, safe and green.
The destroyToken function below provides a method to log off the Token on the official website.
def destroyToken(self, token):
    params = {
        "jsonrpc": "2.0",
        "method": "user.logout",
        "params": [],
        "auth": token,
        "id": "Chasii"
    }
    return self.rpcResult(params)
2.2. Host class (HOST)
Create the HOST class and declare__ init__ Private function, by entering parameters zbx_token to obtain the ZABBIX API identity token for this kind of function call.
class HOST(object):
    def  __init__(self, zbx_token):
        self.zbx_token = zbx_token
Create the getGroupID function, query the specified groupid group owner ID, and return all host IDs and their host names in the group.
def getHostID(self, groupid):
    params = {
        "jsonrpc": "2.0",
        "method": "host.get",
        "params": {
            "output": ["hostid","host"],
            "groupids": groupid
        },
        "auth": self.zbx_token,
        "id": "Chasii"
    }
    return AUTH().rpcResult(params)
2.3. Group class (HOSTGROUP)
Create the HOSTGROUP class and declare__ init__ Private function, by entering parameters zbx_token to obtain the ZABBIX API identity token for this kind of function call.
class HOSTGROUP(object):
    def  __init__(self, zbx_token):
        self.zbx_token = zbx_token
Create the getGroupID function and return the group ID by querying the specified group name hostgroup.
def getGroupID(self, hostgroup):
    params = {
        "jsonrpc": "2.0",
        "method": "hostgroup.get",
        "params": {
            "output": "groupid",
            "filter": {"name": [hostgroup]}
        },
        "auth": self.zbx_token,
        "id": "Chasii"
    }
    return AUTH().rpcResult(params)
2.4. Indicator class (ITEM)
Create the ITEM indicator class and declare a private function by entering the parameter zbx_token to obtain the ZABBIX API identity token for this kind of function call.
class ITEM(object):
    def  __init__(self, zbx_token):
        self.zbx_token = zbx_token
Create the getItemID function, and return the monitoring item ID by querying the specified host name host and indicator item key.
def getItemID(self, host, key):
    params = {
        "jsonrpc": "2.0",
        "method": "item.get",
        "params": {
            "output": "itemid",
            "host": host,
            "search": { "key_": key},
        },
        "auth": self.zbx_token,
        "id": "Chasii"
    }
    return AUTH().rpcResult(params)
2.5. Chart class (GRAPH)
Zabbixgraph.create Interface Parameter Description:
Required parameter | Support type | Example |
|---|---|---|
name | character string | Name of the chart, such as Biz_Group001_CPU,Biz_Group001_MEM |
width | Integer type | The height of the chart, such as 900 pixels, in config Specified in py file |
height | Integer type | The height of the chart, such as 200 pixels, in config Specified in py file |
gitems | List type | List of monitoring items of icons, such as [{"itemid":"22828","color":"00AA00"}] |
Create a GRAPH indicator class and declare a private function by entering parameters zbx_token to obtain the ZABBIX API identity token for this kind of function call.
class GRAPH(object):
    def  __init__(self, zbx_token):
        self.zbx_token = zbx_token
Create the creategraph function, specify the chart name gname, chart width gwidth, chart height, and chart monitoring item parameter gitems.
def createGrapth(self, gname, gwidth, gheight, gitems):
    params = {
        "jsonrpc": "2.0",
        "method": "graph.create",
        "params": {
            "name": gname,"width": gwidth,"height": gheight,"gitems": gitems
        },
        "auth": self.zbx_token,
        "id": "Chasii"
    }
    return AUTH().rpcResult(params)
3. Call interface
3.1. Project introduction
Through the interpretation of the official API, we already know how to use it. The next task is how to assemble these accessories and modules and make them run. In order to explain this case more conveniently, the author has uploaded the above relevant API scripts to Github. Readers can pay attention to and clone it for local use, and more functions will be supported in the future.
Project code Git address: https://github.com/Chasii/ZabbixCli.git
Project framework description
ZabbixCli
├── app # Zabbix interface
│   └── api.py
├── conf # Zabbix configuration
│   └── settings.py
├── docs # Zabbix description
│   ├── Nginx-Established.png
│   └── Sequence-Diagram.png
├── logs # Program log
│   └── zbx.log
├── readme.md
└── zbxcli.py # Unified entrance
3.2. Configuration separation
Through configuration separation, the changeable modules are taken out as independent files to enhance the stability and plasticity of the project. config.py file defines the log output format and log output mode (file and console), and specifies the default pixels of Zabbix account and chart. Readers can adjust them according to their own conditions and needs. Some codes are extracted below for display.
# Log Set
...
log_fmt = '%(asctime)s  %(filename)s [line:%(lineno)d] %(levelname)s: %(message)s'
# Export Console
....
logger.addHandler(rf_handler)
# Export Logfile
...
logger.addHandler(f_handler)
# Env Set
Zabbix = {
    "api": "http://<your_ip>/api_jsonrpc.php",
    "user": "<your_name>",
    "pass": "<your_pass>",
...
}
3.3. Create entry
Create a ZBXCLI entry class and declare a private function. Call the AUTH class to obtain the initial ZABBIX API identity token for this class of functions to call.
class  ZBXCLI(object):
    def  __init__(self):
        self.zbx_token = zbx.AUTH().getToken()
The following functions are mainly used to process the parameters passed from the CLI. The function randomColor returns the random hexadecimal color code, the function handleItem obtains the ItemID according to the host name and monitoring indicators, the functions handleHost and handleGroup are responsible for processing the HostID, and the function createGraph requests the interface to create a chart.
def  randomColor(self):
     return ("".join(random.choice("0123456789ABCDEF") for  i  in  range(6)))
def  handleItem(self, key, hosts):
     items = []
     for host in hosts:
         items.append(zbx.ITEM(self.zbx_token).getItemID(host, key)[0]["itemid"])
     return items
def  handleHost(self, hosts):
     items = self.handleItem(args.key, hosts)
     self.createGraph(items)
     ...
def  handleGroup(self, groups):
     for group  in  groups:
         result = zbx.HOSTGROUP(self.zbx_token).getGroupID(group)
     ...
def  createGraph(self, items):
     gitems = []
     ...
3.4. Call example
ZabbixCli Parameter description
parameter | explain |
|---|---|
key | Monitoring key value (Key). Note that it is not the name of the monitoring indicator |
name | The chart name must be unique and support Chinese |
type | Support type specified host group or host. If there are special characters, please put double quotation marks |
nargs | Host group / host list parameters. Multiple parameters should be separated by spaces. Chinese is supported |
$ python3 zbxcli.py -h
usage: zbxcli.py [-h] -key KEY -name NAME -type {hostgraph,groupgraph} -nargs
                 NARGS [NARGS ...]
=== Zabbix Cli ===
optional arguments:
  -h, --help            show this help message and exit
  -key KEY              Zabbix Item Key
  -type {hostgraph,groupgraph}
  -nargs NARGS [NARGS ...]
3.4. 1. Host mode
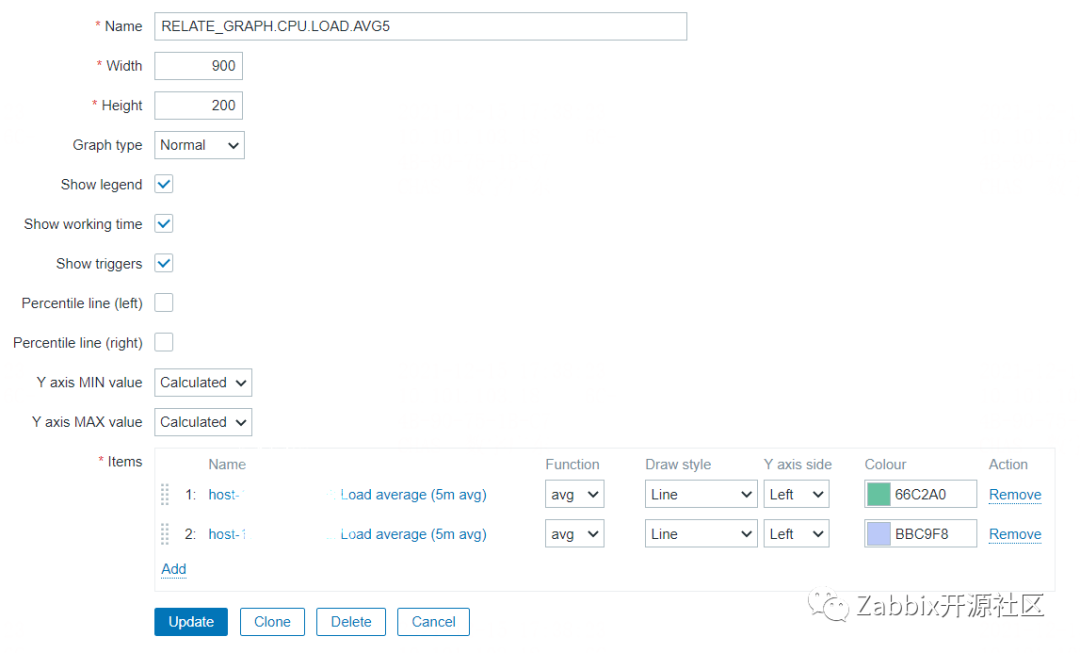
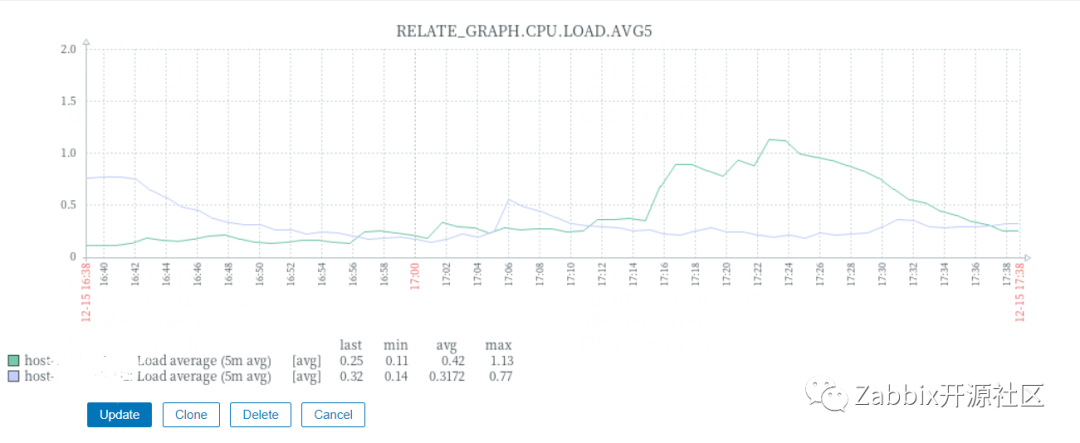
Specify the host host1, host2, and the key value system associated with the operating system CPU load cpu. Load [all, avg5], and name the chart relax_ GRAPH. CPU. LOAD. AVG5.
$ python3 zbxcli.py -key "system.cpu.load[all,avg5]" \
-name "RELATE_GRAPH.CPU.LOAD.AVG5" \
-type hostgraph \
-nargs "host1" "host2"
2021-12-11 17:32:58,507 zbxcli.py [line:52] INFO: {'graphids': ['57138']}
Open the Graph configuration item of any specified host and look for relax_ Graph. CPU. LOAD. As can be seen from the avg5 chart name, the host key value we created has been associated with a chart, which can be displayed normally through Preview.
3.4. 2. Group mode
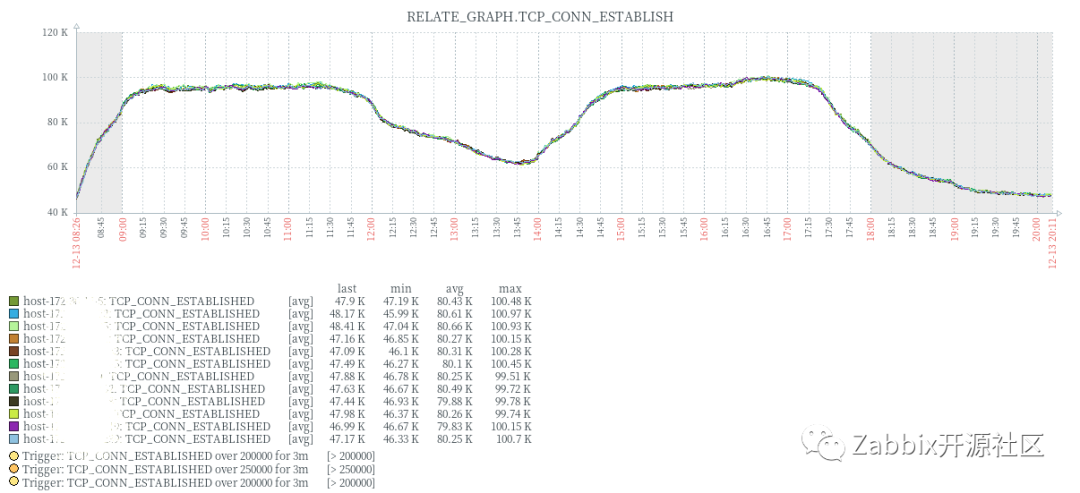
Specify the group BizGroup001 host group, BizGroup002 host group, and the number of nginx established links associated with all hosts. The Key value is TCP_ conn_ The customized Key is established, and the chart is named relax_ GRAPH. TCP_ CONN_ ESTABLISH.
$ python3 zbxcli.py -key "tcp_conn_established" -name "RELATE_GRAPH.TCP_CONN_ESTABLISH" -type groupgraph -nargs "BizGroup001 Host group" "BizGroup002 Host group"
2021-12-11 17:45:36,212 zbxcli.py [line:42] INFO: "BizGroup001 Host group" includes these hosts: host1,host2,...
2021-12-11 17:45:36,851 zbxcli.py [line:52] INFO: {'graphids': ['57139']}
2021-12-11 17:45:36,212 zbxcli.py [line:42] INFO: "BizGroup002 Host group" includes these hosts: host3,host4,...
2021-12-11 17:45:36,851 zbxcli.py [line:52] INFO: {'graphids': ['57140']}
By specifying single / multiple groups, the indicator values are automatically associated to a table. We can see from the console log, ZabbixCli Create charts with graphids of 57139 and 57140 in the hosts of BizGroup001 host group and BizGroup002 host group respectively, and quickly access HTTPS: / / < your_ ip>/chart2. php? graphid=<your_ Graphids > knows that they display the same data.
Starting with the analysis of monitoring requirements, this paper introduces the whole automation idea, Zabbix API call method, graphical interface construction and integration, and unified Cli entrance. I believe it can be easily understood by students who are getting started with Zabbix and Python. Finally, I hope this case can bring inspiration to all friends. If you have any questions, welcome to communicate with us.