use the fast r-cnn algorithm to realize target detection on NWPU VHR-10 data set.
detailed steps of target detection on VOC2007 dataset using fast r-cnn algorithm → Windows10 + fast-rcnn-tensorflow-python 3-master + voc2007 dataset.
1, Required file download link
- Fast r-cnn source code and operation steps Github link → Faster-RCNN-TensorFlow-Python3.
- Fast-rcnn-tensorflow-python 3-master compressed package Baidu cloud disk link → Extraction code: 76wq.
- NWPU VHR-10 dataset Baidu cloud disk link → Extraction code: 1iam.
2, Basic environment configuration
- Windows10 + Anaconda3 + PyCharm 2019.3.3
- Install TensorFlow for CPU version
- Configure TensorFlow environment in PyCharm
3, Training and testing process
-
Download and unzip fast-rcnn-tensorflow-python 3-master.zip, and rename the folder fast-rcnn_ for_ NWPU VHR-10.

-
Convert the format of NWPU VHR-10 data set to that of voc207 data set And copy the converted dataset folder to. / fast RCNN_ for_ NWPU vhr-10 / data path.

-
Open fast RCNN in PyCharm with TensorFlow environment configured_ for_ NWPU vhr-10 project.

-
Install the Python package required to run the source code. Open the good fast RCNN_ for_ There is a requirement.txt file in the NWPU vhr-10 project, which records the name of the package to be installed. Enter pip install -r requirements.txt in the Terminal of PyCharm and press enter to install all required dependent packages.

-
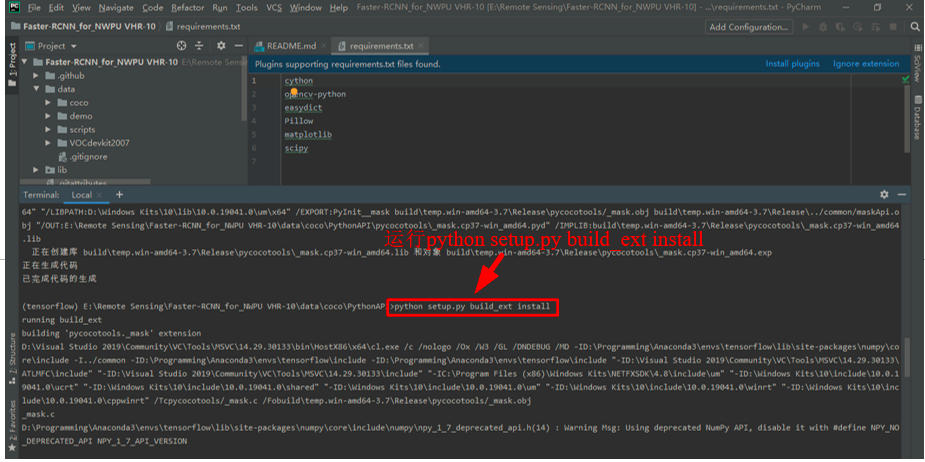
Enter CD data \ coco \ Python API in the Terminal of PyCharm, switch the path to. / data / coco / Python API, and then enter python setup.py build_ext --inplace and enter.


Then enter python setup.py build_ext install and enter.

-
Enter exit in the Terminal of PyCharm to exit the current path, then enter cd lib\utils to switch the path to. / lib/utils, and then enter python setup.py build_ext --inplace and enter.


-
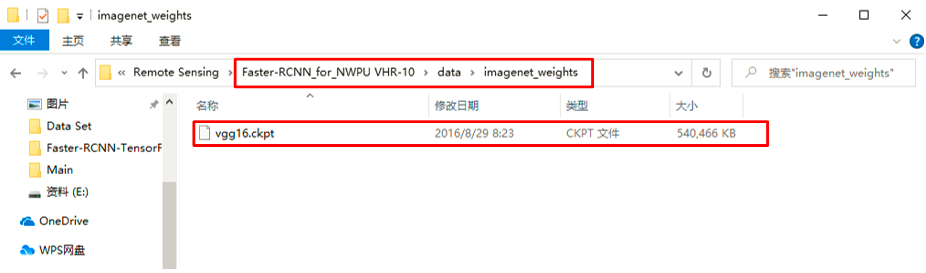
download Pre training model VGG16 , create a new folder Imagenet under the. / data folder_ Weights, the VGg will be downloaded_ 16_ 2016_ 08_ 28. Extract tar.gz to. / data/imagenet_weights path, and VGg_ Rename 16.ckpt to vgg16.ckpt.
-
Modify the config.py file. The config.py file in the. / lib/config folder is a special configuration file, which defines many parameters of the model. You can modify relevant parameters according to your needs. Here, in order to reduce the training time, I set the maximum number of iterations max_ The iters parameter is changed from 40000 to 10000. At the same time, how many iterations will the model snap be saved_ The iterations parameter is changed from 5000 to 2000, and other parameters remain unchanged.

-
Modify pascal_voc.py file. Pascal in the. / lib/datasets folder_ Voc.py file, modify self_ The detection categories specified in classes are 10 target detection categories of NWPU VHR-10 dataset.
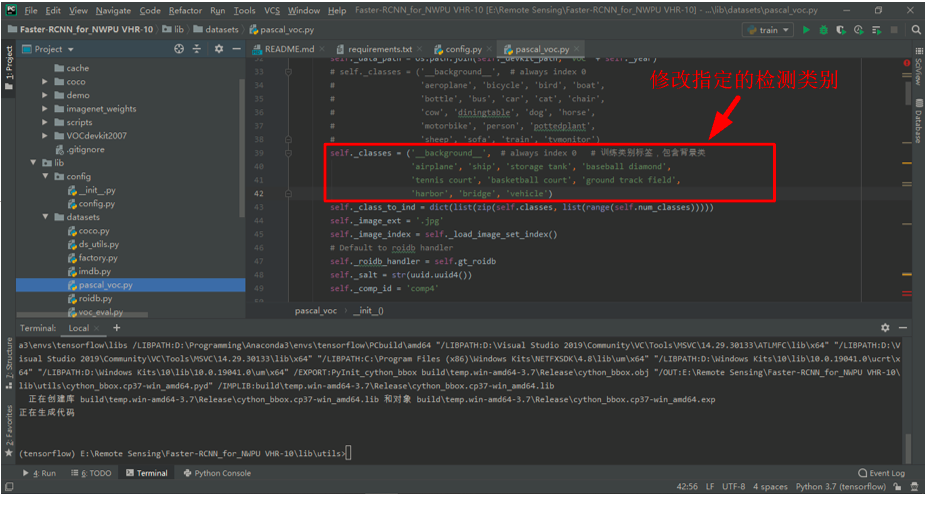
The modified code is as follows.
        self._classes = ('__background__',  # always index 0   # Training category label, including background class
                         'airplane', 'ship', 'storage tank', 'baseball diamond',
                         'tennis court', 'basketball court', 'ground track field',
                         'harbor', 'bridge', 'vehicle')
- Open the train.py file in PyCharm. If you want to visualize loss later, you need to add code in the two places shown in the figure below. If you don't need it, you can ignore this step.


The added code is as follows.
filename = './write_loss.txt' # Added code (file to save loss)
                # Added code (visual loss)
                fw = open(filename, 'a')
                fw.write(str(int(iter))+' '+str(float('%.4f' % total_loss))+"\n")
                fw.close()
                # Add end
- In the train.py file interface, right-click and click Run 'train' to start training. It should be noted that. / data/cache and. / default / VOC should be cleared before each training_ 2007_ The files in the trainval / default folder.

- total loss=nan may occur during training, as shown in the figure below.

The solution is Pascal_ The - 1 of the x1, x2, y1, y2 variables in the voc.py file is removed.

The problem of image invalid and skipping may also occur, as shown in the following figure.

The solution is to use the ROI in config.py_ bg_ threshold_ Change the value of low to 0.0.

- Clear. / data/cache and. / default / VOC_ 2007_ The files in the trainval / default folder. In the train.py file interface, right-click and click Run 'train' to restart the training until the number of iterations is 10000.

- After the training, if the visual loss code is added to the train.py file before the training, you can get a write in the root path_ The loss.txt file holds the loss value corresponding to 10 iterations. Create a new Python file visual in the root path_ Loss.py, the code is as follows. After running, you can get a loss curve in the root directory.
write_ The contents of the loss.txt file are shown in the following figure.

Run visual_loss.py file, you can get the results shown in the figure below.

visual_ The code of the loss.py file is as follows.
import numpy as np
import matplotlib.pyplot as plt

y_ticks = [0, 0, 0.5, 1.0, 2.0, 3.0, 4.0, 5.0]  # The value of the ordinate can be set by yourself.
data_path = 'E:/Remote Sensing/Faster-RCNN_for_NWPU VHR-10/write_loss.txt'  # log_ Path of loss
result_path = 'E:/Remote Sensing/Faster-RCNN_for_NWPU VHR-10/total_loss'  # Path to save results

data1_loss = np.loadtxt(data_path)
x = data1_loss[:, 0]  # To the left of the colon is the row range, and to the right of the colon is the column range. Take the first column
y = data1_loss[:, 1]  # Take column 2

# Start drawing
fig = plt.figure()
ax = fig.add_subplot(1, 1, 1)
ax.plot(x, y, label='total_loss')
plt.yticks(y_ticks)  # If you don't want to set the ordinate yourself, you can comment it out
ax.legend(loc='best')
ax.set_title('The loss curves')
ax.set_xlabel('batches')
fig.savefig(result_path)
plt.show()
-
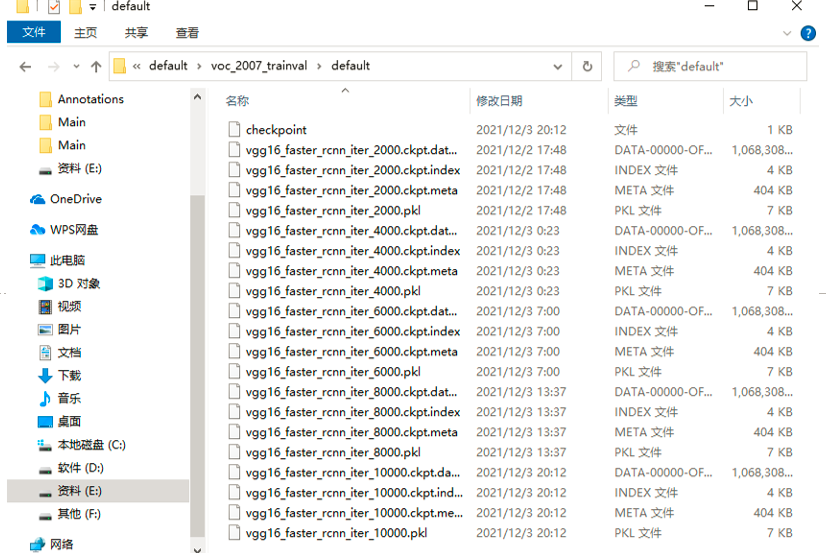
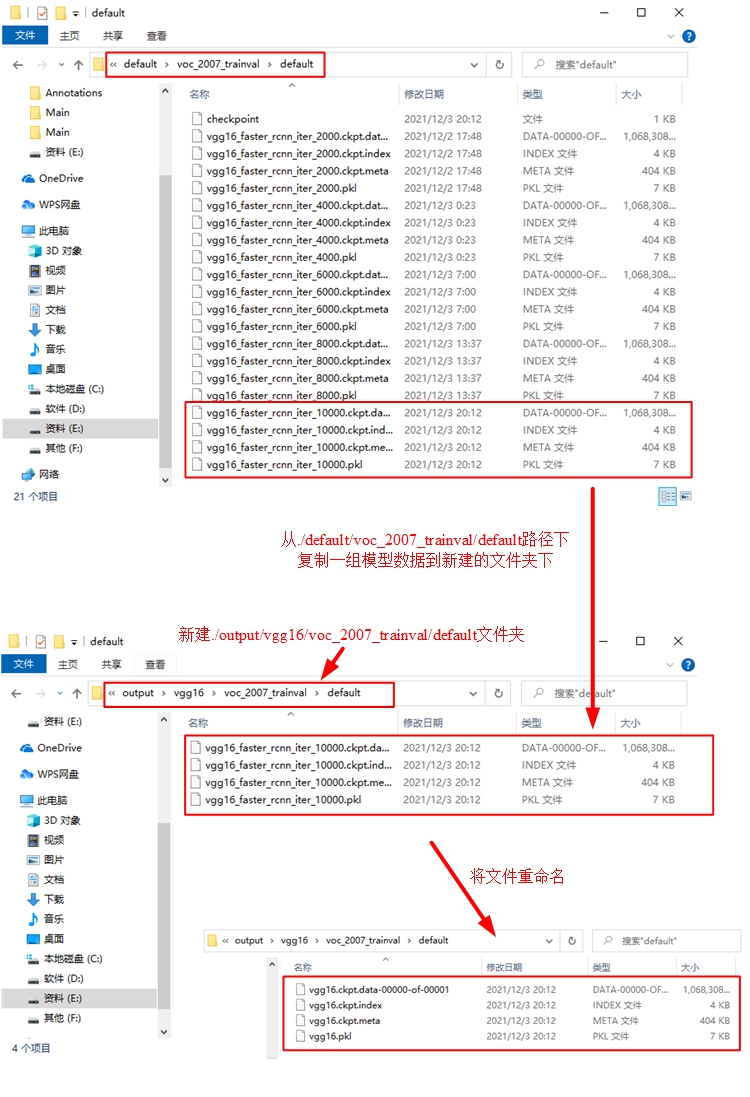
During training, the path to save the model is. / default/voc_2007_trainval/default: four files are saved each time the model is saved.
-
New. / output/vgg16/voc_2007_trainval/default folder, from. / default / VOC_ 2007_ Copy a set of model data to the new folder under trainval / default path, and change all file names to vgg16. Suffix.
-
Prepare to test the trained model. Open the demo.py file in PyCharm and modify the part shown in the following figure.

The modified code is as follows.
CLASSES = ('__background__',
           'airplane', 'ship', 'storage tank', 'baseball diamond',
           'tennis court', 'basketball court', 'ground track field',
           'harbor', 'bridge', 'vehicle')

NETS = {'vgg16': ('vgg16.ckpt',), 'res101': ('res101_faster_rcnn_iter_110000.ckpt',)}
    parser.add_argument('--net', dest='demo_net', help='Network to use [vgg16 res101]',
                        choices=NETS.keys(), default='vgg16')
    parser.add_argument('--dataset', dest='dataset', help='Trained dataset [pascal_voc pascal_voc_0712]',
                        choices=DATASETS.keys(), default='pascal_voc')
- In order to display all the target detection frames on the same picture on one picture, the following part of the demo.py file needs to be modified.


The modified code is as follows.
# def vis_detections(im, class_name, dets, thresh=0.5):  # Modify this line of code to the following line
def vis_detections(im, class_name, dets, ax, thresh=0.5):  # Added code (add ax parameter) (display all target detection boxes on the same picture on one picture)
    """Draw detected bounding boxes."""
    inds = np.where(dets[:, -1] >= thresh)[0]
    if len(inds) == 0:
        return

    # Annotated code (all target detection boxes on the same picture are displayed on one picture)
    # im = im[:, :, (2, 1, 0)]
    # fig, ax = plt.subplots(figsize=(12, 12))
    # ax.imshow(im, aspect='equal')
    # End of comment

    for i in inds:
        bbox = dets[i, :4]
        score = dets[i, -1]

        ax.add_patch(
            plt.Rectangle((bbox[0], bbox[1]),
                          bbox[2] - bbox[0],
                          bbox[3] - bbox[1], fill=False,
                          edgecolor='red', linewidth=3.5)
        )
        ax.text(bbox[0], bbox[1] - 2,
                '{:s} {:.3f}'.format(class_name, score),
                bbox=dict(facecolor='blue', alpha=0.5),
                fontsize=14, color='white')

    ax.set_title(('{} detections with '
                  'p({} | box) >= {:.1f}').format(class_name, class_name,
                                                  thresh),
                 fontsize=14)
    # Annotated code (all target detection boxes on the same picture are displayed on one picture)
    # plt.axis('off')
    # plt.tight_layout()
    # plt.draw()
    # End of comment

def demo(sess, net, image_name):
    """Detect object classes in an image using pre-computed object proposals."""

    # Load the demo image
    im_file = os.path.join(cfg.FLAGS2["data_dir"], 'demo', image_name)
    im = cv2.imread(im_file)

    # Detect all object classes and regress object bounds
    timer = Timer()
    timer.tic()
    scores, boxes = im_detect(sess, net, im)
    timer.toc()
    print('Detection took {:.3f}s for {:d} object proposals'.format(timer.total_time, boxes.shape[0]))

    # Visualize detections for each class
    CONF_THRESH = 0.4  # Make appropriate modifications
    NMS_THRESH = 0.2  # Make appropriate modifications
    # Added code (copy the 3 lines of code before the for loop in the previously commented vis_detections function to here) (display all target detection boxes on the same picture on one picture)
    im = im[:, :, (2, 1, 0)]
    fig, ax = plt.subplots(figsize=(12, 12))
    ax.imshow(im, aspect='equal')
    # Add end
    for cls_ind, cls in enumerate(CLASSES[1:]):
        cls_ind += 1  # because we skipped background
        cls_boxes = boxes[:, 4 * cls_ind:4 * (cls_ind + 1)]
        cls_scores = scores[:, cls_ind]
        dets = np.hstack((cls_boxes,
                          cls_scores[:, np.newaxis])).astype(np.float32)
        keep = nms(dets, NMS_THRESH)
        dets = dets[keep, :]
        # vis_detections(im, cls, dets, thresh=CONF_THRESH)  # Modify this line of code to the following line
        vis_detections(im, cls, dets, ax,
                       thresh=CONF_THRESH)  # Added code (pass ax as a parameter to vis_detections) (display all target detection boxes on the same picture)
    # Added code (copy the 3 lines of code after the for loop in the vis_detections function commented out above to here) (display all target detection boxes on the same picture on one picture)
    plt.axis('off')
    plt.tight_layout()
    plt.draw()
    # Add end
- In order to batch read the pictures in JPEGImages folder during testing and save the target detection results to a new folder, you need to modify the demo.py file as shown below.


The modified code is as follows.
   # im_file = os.path.join(cfg.FLAGS2["data_dir"], 'demo', image_name)
    im_file = os.path.join('E:/Remote Sensing/Faster-RCNN_for_NWPU VHR-10/data/VOCdevkit2007/VOC2007/JPEGImages', image_name)  # Modify test picture path
    # im_names = ['000456.jpg', '000457.jpg', '000542.jpg', '001150.jpg',
    #             '001763.jpg', '004545.jpg']
    im_names = os.listdir(
        'E:/Remote Sensing/Faster-RCNN_for_NWPU VHR-10/data/VOCdevkit2007/VOC2007/JPEGImages')  # The path of the picture to be tested
    for im_name in im_names:
        print('~~~~~~~~~~~~~~~~~~~~~~~~~~~~~~~~~~~')
        print('Demo for data/demo/{}'.format(im_name))
        demo(sess, net, im_name)

        # Save the target detection results of the test picture and set the output format
        plt.savefig('E:/Remote Sensing/Faster-RCNN_for_NWPU VHR-10/test_result/' + im_name, format='png',
                    transparent=True, pad_inches=0, dpi=300, bbox_inches='tight')

    # plt.show()
-
Create a new test under the root path_ The result folder, and then run demo.py, which can be found in test_ The target detection results of NWPU VHR-10 data set are obtained in the result folder.

-
The running results of the above code do not look very beautiful for the images with many and concentrated targets. As shown in the figure below, even the category and accuracy labels of one target will overwrite the prediction boxes of other targets.
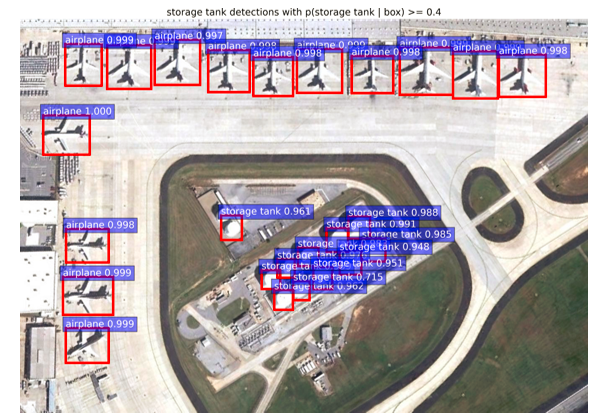
Therefore, in order to get better visualization results, continue to modify the demo.py file as follows.

Modify the saving path of target detection results.

Create a new test under the root path_ Result1 folder, and then run demo.py, which can be found in test_ Retrieve the target detection results of NWPU VHR-10 dataset in result1 folder.

For the pictures with many and concentrated targets, the visual results of target detection obtained this time look more beautiful, as shown in the figure below.

-
If you want to output the PR curve and calculate the AP value during the test, you first need to open Pascal in the. \ lib\datasets path_ Voc.py file, with the following modifications.

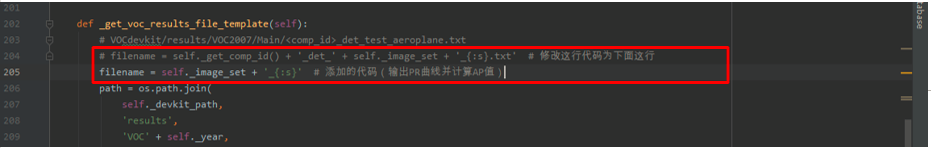


The modified and added codes are as follows.
# Added code (output PR curve and calculate AP value)
import matplotlib.pyplot as plt
import pylab as pl
# Add end
        # filename = self._get_comp_id() + '_det_' + self._image_set + '_{:s}.txt'  # Modify this line of code to the following line
        filename = self._image_set + '_{:s}'  # Added code (output PR curve and calculate AP value)
    def _do_python_eval(self, output_dir='output'):
        annopath = self._devkit_path + '\\VOC' + self._year + '\\Annotations\\' + '{:s}.xml'
        imagesetfile = os.path.join(
            self._devkit_path,
            'VOC' + self._year,
            'ImageSets',
            'Main',
            self._image_set + '.txt')
        cachedir = os.path.join(self._devkit_path, 'annotations_cache')
        aps = []
        # The PASCAL VOC metric changed in 2010
        use_07_metric = True if int(self._year) < 2010 else False
        print('VOC07 metric? ' + ('Yes' if use_07_metric else 'No'))
        if not os.path.isdir(output_dir):
            os.mkdir(output_dir)
        for i, cls in enumerate(self._classes):
            if cls == '__background__':
                continue
            filename = self._get_voc_results_file_template().format(cls)
            rec, prec, ap = voc_eval(
                filename, annopath, imagesetfile, cls, cachedir, ovthresh=0.5,
                use_07_metric=use_07_metric)
            aps += [ap]
            # Added code (output PR curve and calculate AP value)
            recs = []
            precs = []
            recs += [rec[-1]]
            precs += [prec[-1]]
            print('recall for {} = {:.4f}'.format(cls, rec[-1]))
            print('precision for {} = {:.4f}'.format(cls, prec[-1]))
            pl.plot(rec, prec, lw=2,
                    label='Precision-recall curve of class {} (area = {:.4f})'
                          ''.format(cls, ap))
            # Add end
            print(('AP for {} = {:.4f}'.format(cls, ap)))
            with open(os.path.join(output_dir, cls + '_pr.pkl'), 'wb') as f:
                pickle.dump({'rec': rec, 'prec': prec, 'ap': ap}, f)
            # Added code (output PR curve and calculate AP value)
            pl.xlabel('Recall')
            pl.ylabel('Precision')
            plt.grid(True)
            pl.ylim([0.0, 1.05])
            pl.xlim([0.0, 1.05])
            pl.title('Precision-Recall')
            pl.legend(loc="upper right")
            plt.savefig('E:/Remote Sensing/Faster-RCNN_for_NWPU VHR-10/PR_result/' + cls + '_PR.jpg')
            plt.show()
            # Add end
        print(('Mean AP = {:.4f}'.format(np.mean(aps))))
        print('~~~~~~~~')
        print('Results:')
        for ap in aps:
            print(('{:.3f}'.format(ap)))
        print(('{:.3f}'.format(np.mean(aps))))
        print('~~~~~~~~')
        print('')
        print('--------------------------------------------------------------')
        print('Results computed with the **unofficial** Python eval code.')
        print('Results should be very close to the official MATLAB eval code.')
        print('Recompute with `./tools/reval.py --matlab ...` for your paper.')
        print('-- Thanks, The Management')
        print('--------------------------------------------------------------')
- Create a new PR under the root path_ Result folder, and then open VOC in the. \ lib\datasets path_ Eval.py file, with the following modifications.
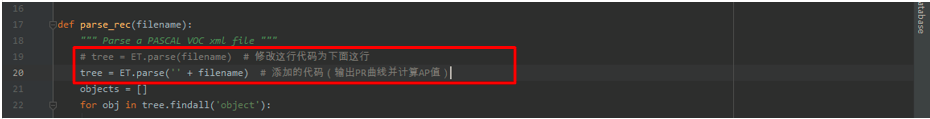
The modified code is as follows.
    # tree = ET.parse(filename)  # Modify this line of code to the following line
    tree = ET.parse('' + filename)  # Added code (enter PR curve and calculate AP value)
- Finally, create a new test under the root path_ Net.py file, the code is as follows.
""""
Demo script showing detections in sample images.
See README.md for installation instructions before running.
"""
from __future__ import absolute_import
from __future__ import division
from __future__ import print_function

import argparse
import os

import tensorflow as tf
from lib.nets.vgg16 import vgg16
from lib.datasets.factory import get_imdb
from lib.utils.test import test_net

NETS = {'vgg16': ('vgg16.ckpt',)}  # You need to modify: training output model
DATASETS = {'pascal_voc': ('voc_2007_trainval',), 'pascal_voc_0712': ('voc_2007_trainval+voc_2012_trainval',)}


def parse_args():
    """Parse input arguments."""
    parser = argparse.ArgumentParser(description='Tensorflow Faster R-CNN test')
    parser.add_argument('--net', dest='demo_net', help='Network to use [vgg16 res101]',
                        choices=NETS.keys(), default='vgg16')
    parser.add_argument('--dataset', dest='dataset', help='Trained dataset [pascal_voc pascal_voc_0712]',
                        choices=DATASETS.keys(), default='pascal_voc')
    args = parser.parse_args()
    return args


if __name__ == '__main__':
    args = parse_args()
    # model path
    demonet = args.demo_net
    dataset = args.dataset
    tfmodel = os.path.join('output', demonet, DATASETS[dataset][0], 'default', NETS[demonet][0])  # Model path
    # Get model file name
    filename = (os.path.splitext(tfmodel)[0]).split('\\')[-1]
    filename = 'default' + '/' + filename
    imdb = get_imdb("voc_2007_test")  # obtain
    imdb.competition_mode('competition mode')
    if not os.path.isfile(tfmodel + '.meta'):
        print(tfmodel)
        raise IOError(('{:s} not found.\nDid you download the proper networks from '
                       'our server and place them properly?').format(tfmodel + '.meta'))
    # set config
    tfconfig = tf.ConfigProto(allow_soft_placement=True)
    tfconfig.gpu_options.allow_growth = True
    # init session
    sess = tf.Session(config=tfconfig)
    # load network
    if demonet == 'vgg16':
        net = vgg16(batch_size=1)
    # elif demonet == 'res101':
    #     net = resnetv1(batch_size=1, num_layers=101)
    else:
        raise NotImplementedError
    net.create_architecture(sess, "TEST", 11,  # You need to modify: category quantity + 1
                            tag='default', anchor_scales=[8, 16, 32])
    saver = tf.train.Saver()
    saver.restore(sess, tfmodel)
    print('Loaded network {:s}'.format(tfmodel))
    print(filename)
    test_net(sess, net, imdb, filename, max_per_image=100)
    sess.close()
- In test_net.py file interface, right-click and click Run 'test_net ', start the test. It should be noted that. / data / vocdevkit2007 / annotation should be cleared before each test_ Files in the cache folder.
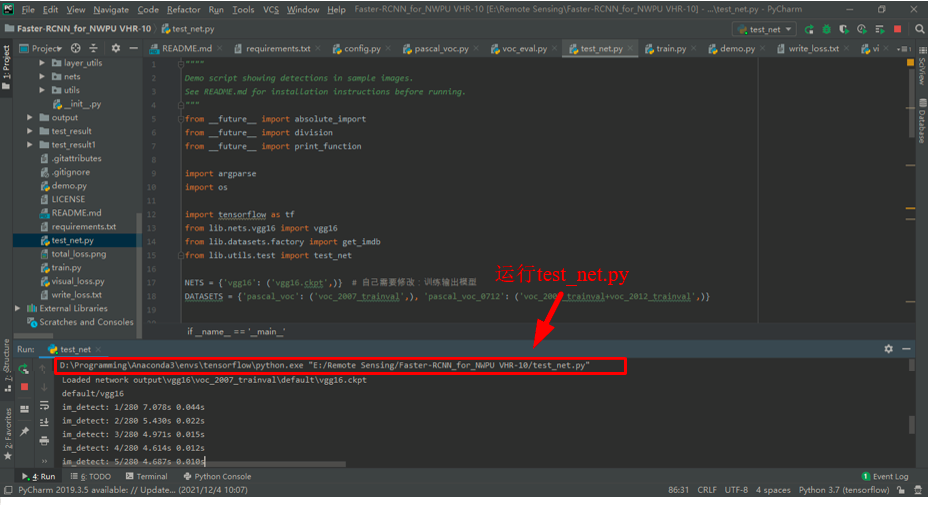
After running, you can get the AP and mAP values of each category.

In PR_ In the result folder, you can get the PR curves of each category.

so far, the whole training and testing process of fast r-cnn model on NWPU VHR-10 data set has ended.