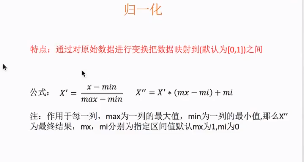
Standard zoom 1 Normalization
from sklearn.preprocessing import MinMaxScaler
def mm():
    """
    normalization
    :return:
    """
    mm = MinMaxScaler(feature_range=(2,3))
    data = mm.fit_transform([[90,2,10,40],[60,4,15,45],[75,3,13,46]])
    print(data)
[[3. 2. 2. 2. ]
[2. 3. 3. 2.83333333]
[2.5 2.5 2.6 3. ]]
Zoom to [2,3]
The maximum and minimum values of normalization vary in a specific scene. In addition, the maximum and minimum values are very vulnerable to outliers, so this method has poor robustness and is only suitable for traditional accurate small data scenes. Adopt another method: standardization
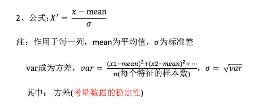
from sklearn.preprocessing import StandardScaler
def std():
    """
    Standardization
    :return:
    """
    std = StandardScaler()
    data = std.fit_transform([[90,2,10,40],[60,4,15,45],[75,3,13,46]])
    print(data)
    print(std.mean_)
    print(std.var_)
[[ 1.22474487 -1.22474487 -1.29777137 -1.3970014 ]
 [-1.22474487  1.22474487  1.13554995  0.50800051]
 [ 0.          0.          0.16222142  0.88900089]]
[75.          3.         12.66666667 43.66666667]
[150.           0.66666667   4.22222222   6.88888889]
Missing value processing
fill
from sklearn.impute import SimpleImputer
data=[[1,2,3],[2,?,4],[3,5,6]]
data.replace(to_replace='?', value=np.nan)
im = Imputer(missing_values='nan', strategy='mean', axis=0)
im = SimpleImputer(missing_values='nan', strategy='mean',axis=0)
data = im.fit_transform([[1,2,3],[2,np.nan,4],[3,5,6]])
print(data)
Feature processing
It is to convert the data into the data required by the algorithm through specific statistical methods (mathematical methods).
Dimensionality reduction refers to reducing the number of features. There are two methods: 1 feature selection and 2 principal component analysis.
- feature selection
Feature selection is simply to select some features from all the extracted features as training set features. The values of features can be changed or not changed before and after selection, but the feature dimensions after selection must be less than before. Main methods: filter: VarianceThreshold, Embedded: regularization, decision tree, Wrapper
Dimension reduction filtering formula: consider the data of this feature of all samples from the size of variance.
from sklearn.feature_selection import VarianceThreshold
def var():
    """
    Delete the characteristics of the bottom variance
    :return:
    """
    var = VarianceThreshold(threshold=0.0)
    data = var.fit_transform([[0,2,0,3],[0,1,4,3],[0,1,1,3]])
    print(data)
[[2 0]
[1 4]
[1 1]]
The first and third features are deleted. Select features by changing the value of parameter threshold. The size of threshold depends on the actual situation.
- Principal component analysis PCA
Essence: it is a technology to analyze and simplify data sets
The purpose is to compress the data dimension, reduce the dimension (complexity) of the original data as much as possible and lose a small amount of information.
Function: it can reduce the number of features in regression analysis or cluster analysis.
When the number of features reaches hundreds, considering the simplification of data, the data will also change and the number of features will be reduced.
from sklearn.decomposition import PCA
def pca():
    """
    Principal component analysis feature dimensionality reduction
    :return:
    """
    pca = PCA(n_components=0.9)
    data = pca.fit_transform([[2,8,4,5],[6,3,0,8],[5,4,9,1]])
    print(data)
[[ 1.28620952e-15 3.82970843e+00]
[ 5.74456265e+00 -1.91485422e+00]
[-5.74456265e+00 -1.91485422e+00]]
The results show that the two features are retained and 90% of the information of the original features is retained
n_ There are two ways for components
Decimal: 0 ~ 1, which means to retain the characteristic information
Integer: the number of features reduced to. Generally, it is not tried.
Case 1: case: explore the segmentation of users' preferences for item categories
import pandas as pd
from sklearn.decomposition import PCA
from sklearn.cluster import KMeans
from sklearn.metrics import silhouette_score
1. Obtain data
order_product = pd.read_csv("./data/instacart/order_products__prior.csv")
products = pd.read_csv("./data/instacart/products.csv")
orders = pd.read_csv("./data/instacart/orders.csv")
aisles = pd.read_csv("./data/instacart/aisles.csv")
2. Basic data processing
2.1 Merge Table
# 2.1 consolidated form
table1 = pd.merge(order_product, products, on=["product_id", "product_id"])
table2 = pd.merge(table1, orders, on=["order_id", "order_id"])
table = pd.merge(table2, aisles, on=["aisle_id", "aisle_id"])
2.2 Cross table merge
table = pd.crosstab(table["user_id"], table["aisle"])
2.3 Data interception
table = table[:1000]
3. Characteristic engineering pca
transfer = PCA(n_components=0.9)
data = transfer.fit_transform(table)
4. Machine learning (k-means)
estimator = KMeans(n_clusters=8, random_state=22)
estimator.fit_predict(data)
5. Model evaluation
silhouette_score(data, y_predict)