Notes are organized in https://www.elastic.co/guide/en/beats/filebeat/current/filebeat-installation.html Only for personal learning summary.Filebeat is a lightweight log collection tool that is often used in conjunction with ELK as a data collection source.
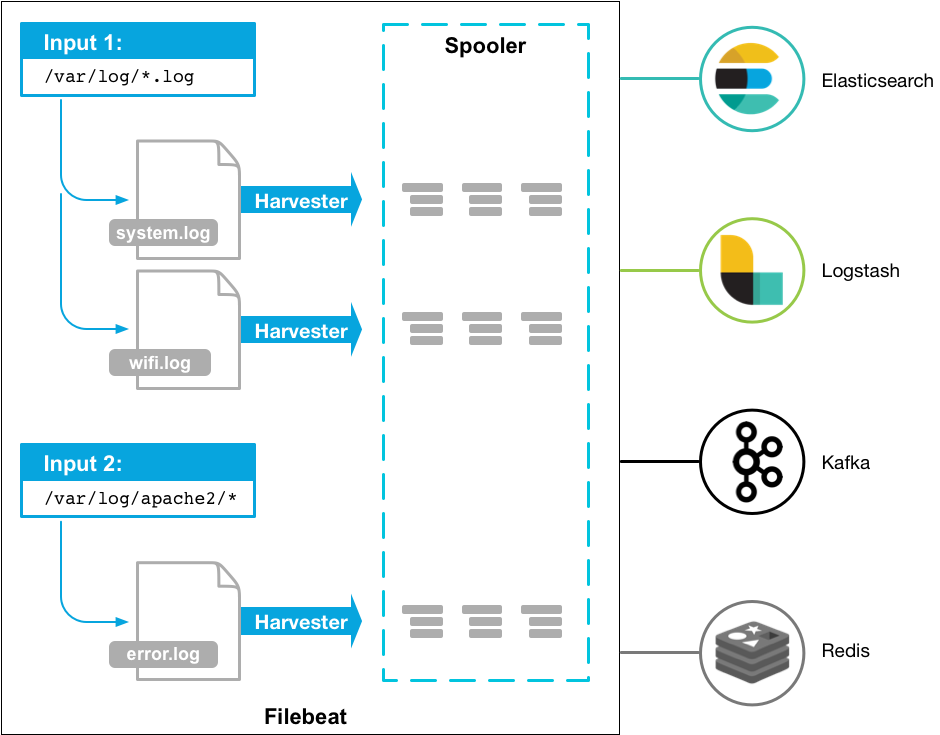
filebeat Usage Diagram
Install Deployment
Centos7 (used by authors)
Because the download was too slow, I saved a downloaded version (filebeat-6.3.2-linux-x86_64.tar) here. If you want to use it, please take it yourself: https://quqi.gblhgk.com/s/1727102/vafFOSOsw5AXKP3d
Upload to server and unzip
Deb (not attempted):
    curl -L -O https://artifacts.elastic.co/downloads/beats/filebeat/filebeat-7.6.1-amd64.deb
    sudo dpkg -i filebeat-7.6.1-amd64.deb
RPM (not attempted):
curl -L -O https://artifacts.elastic.co/downloads/beats/filebeat/filebeat-7.6.1-x86_64.rpm
sudo rpm -vi filebeat-7.6.1-x86_64.rpm
Mac (not attempted):
curl -L -O https://artifacts.elastic.co/downloads/beats/filebeat/filebeat-7.6.1-darwin-x86_64.tar.gz
tar xzvf filebeat-7.6.1-darwin-x86_64.tar.gz
Linux (not attempted):
curl -L -O https://artifacts.elastic.co/downloads/beats/filebeat/filebeat-7.6.1-linux-x86_64.tar.gz
tar xzvf filebeat-7.6.1-linux-x86_64.tar.gz
Windows (not tried):
-
download https://download.elastic.co/beats/filebeat/filebeat-5.0.0-windows.zip
-
Unzip to C:\Program Files
-
Rename the filebeat-5.0.0-windows directory to Filebeat
-
Right-click on the PowerSHell icon and select Run as Administrator
-
Run the following command to install Filebeat as a windows service:
    PS > cd 'C:\Program Files\Filebeat'
    PS C:\Program Files\Filebeat> .\install-service-filebeat.ps1
Note that additional execution privileges may be required.The command is: PowerShell.exe - ExecutionPolicy RemoteSigned - File. \install-service-filebeat.ps1
Quick use
<font color='red'>Author environment: centos7, JDK8, filebeat-6.3.2, logstash-6.5.1</font>
filebeat.yml configuration
Modify the filebeat.yml configuration file, mainly modifying nodes [filebeat.inputs, paths, include_lines, name, (output.logstash)]
Modify as needed, I configure filebeats to listen for files with the suffix [.log] under the [shaofei/logs] folder and the keyword to listen for is ['Exception','User Logon Exception']. Note: If you need to listen for Chinese, you need to ensure that the file is encoded as UTF-8.Or use [encoding] to specify the file encoding to listen for I have configured name:'study128'. I use Logstash as its output port here. Even if there is no receiver to receive the log for filebeat output, it will not affect filebeat startup. When modifying the configuration file, be aware of the format of yml
###################### Filebeat Configuration Example #########################

# This file is an example configuration file highlighting only the most common
# options. The filebeat.reference.yml file from the same directory contains all the
# supported options with more comments. You can use it as a reference.
#
# You can find the full configuration reference here:
# https://www.elastic.co/guide/en/beats/filebeat/index.html

# For more available modules and options, please see the filebeat.reference.yml sample
# configuration file.

#=========================== Filebeat inputs =============================

filebeat.inputs:

# Each - is an input. Most options can be set at the input level, so
# you can use different inputs for various configurations.
# Below are the input specific configurations.

- type: log

  # Change to true to enable this input configuration.
  enabled: true

  # Paths that should be crawled and fetched. Glob based paths.
  paths:
    - /filebeat/testlogs/input/*.log
  include_lines: ['Exception','User Logon Exception']
    #- c:\programdata\elasticsearch\logs\*
  #encoding: gbk
  # Exclude lines. A list of regular expressions to match. It drops the lines that are
  # matching any regular expression from the list.
  #exclude_lines: ['^DBG']

  # Include lines. A list of regular expressions to match. It exports the lines that are
  # matching any regular expression from the list.
  #include_lines: ['^ERR', '^WARN']

  # Exclude files. A list of regular expressions to match. Filebeat drops the files that
  # are matching any regular expression from the list. By default, no files are dropped.
  #exclude_files: ['.gz$']

  # Optional additional fields. These fields can be freely picked
  # to add additional information to the crawled log files for filtering
  #fields:
  #  level: debug
  #  review: 1

  ### Multiline options

  # Mutiline can be used for log messages spanning multiple lines. This is common
  # for Java Stack Traces or C-Line Continuation

  # The regexp Pattern that has to be matched. The example pattern matches all lines starting with [
  #multiline.pattern: ^\[

  # Defines if the pattern set under pattern should be negated or not. Default is false.
  #multiline.negate: false

  # Match can be set to "after" or "before". It is used to define if lines should be append to a pattern
  # that was (not) matched before or after or as long as a pattern is not matched based on negate.
  # Note: After is the equivalent to previous and before is the equivalent to to next in Logstash
  #multiline.match: after

multiline:
 tail_files: true

#============================= Filebeat modules ===============================

filebeat.config.modules:
  # Glob pattern for configuration loading
  path: ${path.config}/modules.d/*.yml

  # Set to true to enable config reloading
  reload.enabled: false

  # Period on which files under path should be checked for changes
  #reload.period: 10s

#==================== Elasticsearch template setting ==========================

#setup.template.settings:
  #index.number_of_shards: 3
  #index.codec: best_compression
  #_source.enabled: false

#================================ General =====================================

# The name of the shipper that publishes the network data. It can be used to group
# all the transactions sent by a single shipper in the web interface.
name: "study128"

# The tags of the shipper are included in their own field with each
# transaction published.
#tags: ["service-X", "web-tier"]

# Optional fields that you can specify to add additional information to the
# output.
#fields:
#  env: staging


#============================== Dashboards =====================================
# These settings control loading the sample dashboards to the Kibana index. Loading
# the dashboards is disabled by default and can be enabled either by setting the
# options here, or by using the `-setup` CLI flag or the `setup` command.
#setup.dashboards.enabled: false

# The URL from where to download the dashboards archive. By default this URL
# has a value which is computed based on the Beat name and version. For released
# versions, this URL points to the dashboard archive on the artifacts.elastic.co
# website.
#setup.dashboards.url:

#============================== Kibana =====================================

# Starting with Beats version 6.0.0, the dashboards are loaded via the Kibana API.
# This requires a Kibana endpoint configuration.
#setup.kibana:

  # Kibana Host
  # Scheme and port can be left out and will be set to the default (http and 5601)
  # In case you specify and additional path, the scheme is required: http://localhost:5601/path
  # IPv6 addresses should always be defined as: https://[2001:db8::1]:5601
  #host: "localhost:5601"

#============================= Elastic Cloud ==================================

# These settings simplify using filebeat with the Elastic Cloud (https://cloud.elastic.co/).

# The cloud.id setting overwrites the `output.elasticsearch.hosts` and
# `setup.kibana.host` options.
# You can find the `cloud.id` in the Elastic Cloud web UI.
#cloud.id:

# The cloud.auth setting overwrites the `output.elasticsearch.username` and
# `output.elasticsearch.password` settings. The format is `<user>:<pass>`.
#cloud.auth:

#================================ Outputs =====================================

# Configure what output to use when sending the data collected by the beat.

#-------------------------- Elasticsearch output ------------------------------
#output.elasticsearch:
  # Array of hosts to connect to.
  #hosts: ["localhost:9200"]

  # Optional protocol and basic auth credentials.
  #protocol: "https"
  #username: "elastic"
  #password: "changeme"

#----------------------------- Logstash output --------------------------------
output.logstash:
  # The Logstash hosts
  hosts: ["127.0.0.1:10515"]

  # Optional SSL. By default is off.
  # List of root certificates for HTTPS server verifications
  #ssl.certificate_authorities: ["/etc/pki/root/ca.pem"]

  # Certificate for SSL client authentication
  #ssl.certificate: "/etc/pki/client/cert.pem"

  # Client Certificate Key
  #ssl.key: "/etc/pki/client/cert.key"

#================================ Logging =====================================

# Sets log level. The default log level is info.
# Available log levels are: error, warning, info, debug
#logging.level: debug

# At debug level, you can selectively enable logging only for some components.
# To enable all selectors use ["*"]. Examples of other selectors are "beat",
# "publish", "service".
#logging.selectors: ["*"]

#============================== Xpack Monitoring ===============================
# filebeat can export internal metrics to a central Elasticsearch monitoring
# cluster.  This requires xpack monitoring to be enabled in Elasticsearch.  The
# reporting is disabled by default.

# Set to true to enable the monitoring reporter.
#xpack.monitoring.enabled: false

# Uncomment to send the metrics to Elasticsearch. Most settings from the
# Elasticsearch output are accepted here as well. Any setting that is not set is
# automatically inherited from the Elasticsearch output configuration, so if you
# have the Elasticsearch output configured, you can simply uncomment the
# following line.
#xpack.monitoring.elasticsearch:
#scan_frequency: 30s
#----------------------------- kafka output --------------------------------
#output.kafka:
#  enabled: true
#  hosts: ["132.228.248.201:9092","132.228.248.202:9092","132.228.248.203:9092"]
#  topic: ETE_CBA_ZZQS_LOG_ERROR
#  version: 0.10.0.1
Start filebeat
./filebeat -e -c filebeat.yml -d "publish"
Since filebeat.yml startup errors occur, execute permissions to modify filebeat.yml (use its recommended command)

Start Successful
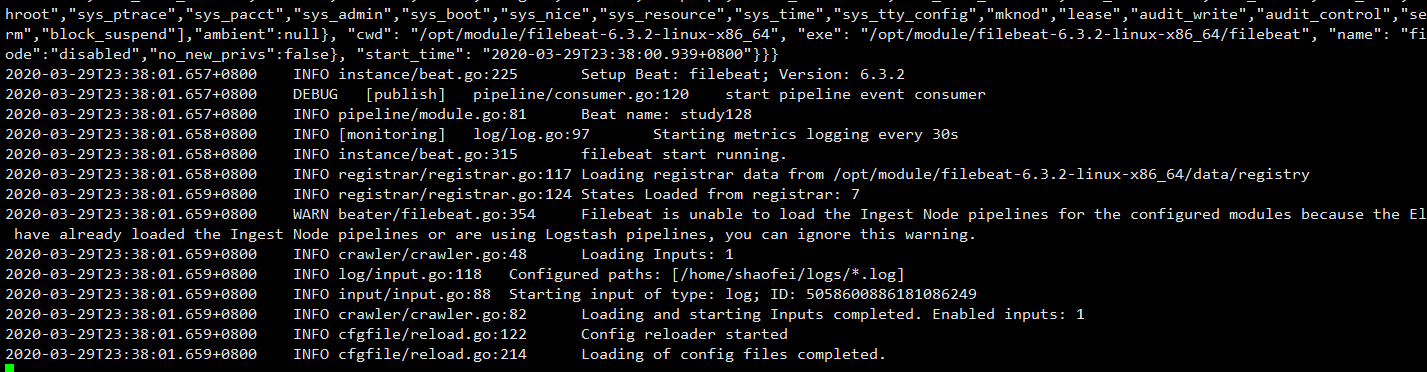
Note: Make sure the collection path configured by filebeat.yml has read access!
Test for successful collection
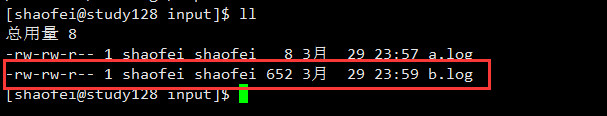
- Create test log in specified directory
echo "
    2020-03-27 16:51:25,422 ERROR com.quxuecx.Start ->net.sf.json.JSONException: JSONObject["matchID"] not found.
    2020-03-27 16:51:25,422 ERROR com.quxuecx.Start ->net.sf.json.JSONException: JSONObject["matchID"] not found.
    2020-03-27 16:51:25,422 ERROR com.quxuecx.Start ->net.sf.json.JSONException: JSONObject["matchID"] not found.
">>b.log
- Success
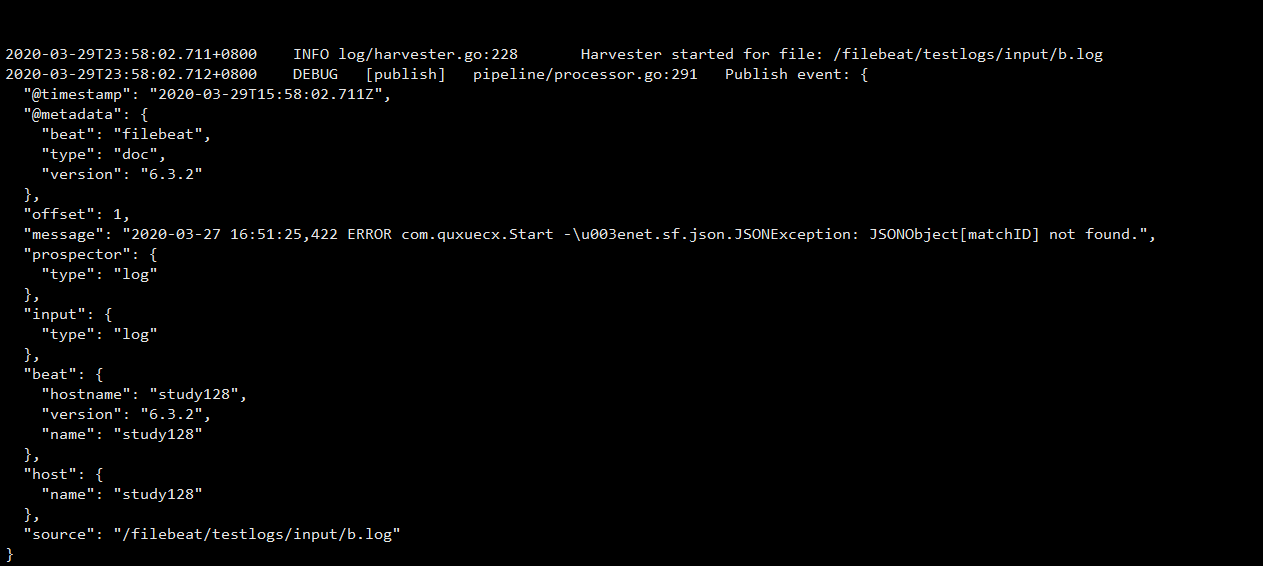
Note: If you do not see the above successfully collected pictures, carefully check that the filebeat.yml configuration file and the permissions on the paths and files you are listening to are readable.Note: The contents of the file must be in log format and include the keywords you are listening to. Please note.
Docking logstash test
Special note: output.logstash: hosts configured in filebeat.yml: ["127.0.0.1:10515"] where 10515 is the same port as input filebeat in the logstash configuration file.
See >> for an overview of logstash https://blog.csdn.net/pyfysf/article/details/100942174
logstash configuration file log_error.conf
input {
    # Configure filebeat
    beats {
        port => 10515
    }
}

filter {

}

output {

    # Configuration output to file
    file{
       path=>"/home/shaofei/output.log"
    }

    #Configure Output to Console
	stdout{
		codec=>rubydebug
	}
}
Start logstash
./bin/logstash -rf ./config/log_error.conf
Configuration file log_error.conf
input {
    # Configure filebeat
    beats {
        port => 10515
    }
}

filter {

}

output {

    # Configuration output to file
    file{
       path=>"/home/shaofei/output.log"
    }

    #Configure Output to Console
	stdout{
		codec=>rubydebug
	}
}
Start logstash
./bin/logstash -rf ./config/log_error.conf