I/O input / output, read and write, cache and raid can improve storage IO performance.
IOPS (Input/Output Operations Per Second), that is, the number of I/O operations per second, is mostly used in database, storage and other occasions to measure the performance of random access.
The IOPS performance of the storage side is different from that of the host side. IOPS refers to how many accesses the storage can accept per second from the host. One IO of the host needs three accesses to the storage before it can complete. For example, when the host writes a minimum data block, it also needs to go through three steps, i.e. "send write request, write data, and receive write confirmation", that is, three storage side accesses.
Fio and dd tools are commonly used under Linux and IOMeter under Windows.
FIO is a very good tool for testing IOPS. It is used for pressure testing and verification of hardware. It supports 13 different I/O engines, including sync,mmap, libaio, posixaio, SG v3, splice, null, network, syslet, guasi, solarisaio, etc.
Installation and use process under linux
1, FIO installation
Download source package: wget http://brick.kernel.dk/snaps/fio-2.0.7.tar.gz
Install dependent software: Yum install libaio devel we usually use libaio to initiate asynchronous IO requests.
Unzip: tar-zxvf fio-2.0.7.tar.gz
Installation: cd fio-2.0.7
Compiling: make
Install: make install
If wget is not found in the upper process, you need to install it first
yum install wget
Two. Use
The following statement is the command I use to test the random read and write of the disk
Emphasis:!! name of the test file. Usually select the data directory of the disk to be tested. It can only be a partition, not a directory, which will destroy the data. !!!
fio -filename=/dev/sda1 -direct=1 -iodepth 1 -thread -rw=randrw -ioengine=psync -bs=16k -size=500M -numjobs=10 -runtime=10 -group_reporting -name=mytest
Specific parameter description
Explain:
filename=/dev/sdb1 test file name, usually select the data directory of the disk to be tested. It can only be a partition, not a directory, which will destroy the data.
direct=1. The test process bypasses the buffer provided by the machine. Make the test results more realistic.
iodepth 1 queue depth is meaningful only when using libaio, which is a parameter that can affect IOPS, usually 1.
RW = random test random write I/O
rw=randrw test random write and read I/O
ioengine=psync io engine uses pync mode
bs=4k block file size of single io is 4k
bsrange=512-2048 as above, specify the size range of data block
size=50G. The size of the test file is 50g. It is tested with 4k io each time. This size cannot exceed the size of filename, otherwise an error will be reported.
numjobs=10. This test thread is 10
runtime=1000 test time is 1000 seconds. If not, 5g files will be written in 4k until each time.
rwmixwrite=30 in mixed read-write mode, write accounts for 30%
Group ABCD reporting about displaying results, summarizing information about each process.
in addition
lockmem=1g only 1G memory is used for testing.
zero_buffers initializes the system buffer with 0.
nrfiles=8 the number of files generated per process.
read in sequence
Write sequential write
rw,readwrite sequential mixed read and write
Random write
Random read
Random mixed reading and writing
Other common statements
Sequential reading:
fio -filename=/dev/sdb1 -direct=1 -iodepth 1 -thread -rw=read -ioengine=psync -bs=4k -size=50G -numjobs=30 -runtime=1000 -group_reporting -name=mytest
Random write:
fio -filename=/dev/sdb1 -direct=1 -iodepth 1 -thread -rw=randwrite -ioengine=psync -bs=4k -size=50G -numjobs=30 -runtime=1000 -group_reporting -name=mytest
Sequential writing:
fio -filename=/dev/sdb1 -direct=1 -iodepth 1 -thread -rw=write -ioengine=psync -bs=4k -size=50G -numjobs=30 -runtime=1000 -group_reporting -name=mytest
Mixed random read and write:
fio -filename=/dev/sdb1 -direct=1 -iodepth 1 -thread -rw=randrw -rwmixread=70 -ioengine=psync -bs=4k -size=50G -numjobs=30 -runtime=100 -group_reporting -name=mytest -ioscheduler=noop
3, Test results
The following is the result of testing random read-write command with linux in virtual machine
[root@localhost dev]#  fio -filename=/dev/sda1 -direct=1 -iodepth 1 -thread -rw=randrw -ioengine=psync -bs=16k -size=500M -numjobs=10 -runtime=10
 -group_reporting -name=mytest mytest: (g=0): rw=randrw, bs=16K-16K/16K-16K, ioengine=psync, iodepth=1
...
mytest: (g=0): rw=randrw, bs=16K-16K/16K-16K, ioengine=psync, iodepth=1
fio 2.0.7
Starting 10 threads
Jobs: 10 (f=10): [mmmmmmmmmm] [100.0% done] [1651K/1831K /s] [100 /111  iops] [eta 00m:00s]
mytest: (groupid=0, jobs=10): err= 0: pid=4075
  read : io=28976KB, bw=2854.6KB/s, iops=178 , runt= 10151msec
    clat (usec): min=49 , max=525390 , avg=35563.60, stdev=69691.20
     lat (usec): min=49 , max=525390 , avg=35563.72, stdev=69691.20
    clat percentiles (usec):
     |  1.00th=[   65],  5.00th=[   70], 10.00th=[   92], 20.00th=[  116],
     | 30.00th=[  137], 40.00th=[  151], 50.00th=[  175], 60.00th=[  286],
     | 70.00th=[14144], 80.00th=[69120], 90.00th=[138240], 95.00th=[197632],
     | 99.00th=[280576], 99.50th=[301056], 99.90th=[452608], 99.95th=[528384],
     | 99.99th=[528384]
    bw (KB/s)  : min=   16, max= 1440, per=12.25%, avg=349.55, stdev=236.44
  write: io=29616KB, bw=2917.6KB/s, iops=182 , runt= 10151msec
    clat (usec): min=64 , max=2030.4K, avg=19768.52, stdev=155468.56
     lat (usec): min=64 , max=2030.4K, avg=19768.86, stdev=155468.56
    clat percentiles (usec):
     |  1.00th=[   70],  5.00th=[   83], 10.00th=[   93], 20.00th=[  115],
     | 30.00th=[  131], 40.00th=[  141], 50.00th=[  151], 60.00th=[  161],
     | 70.00th=[  177], 80.00th=[  209], 90.00th=[  310], 95.00th=[  532],
     | 99.00th=[700416], 99.50th=[1056768], 99.90th=[2007040], 99.95th=[2023424],
     | 99.99th=[2023424]
    bw (KB/s)  : min=   21, max= 1392, per=11.98%, avg=349.49, stdev=253.50
    lat (usec) : 50=0.03%, 100=13.11%, 250=58.60%, 500=7.76%, 750=1.34%
    lat (usec) : 1000=0.38%
    lat (msec) : 2=0.87%, 4=0.74%, 10=0.38%, 20=1.37%, 50=3.63%
    lat (msec) : 100=2.57%, 250=6.80%, 500=1.64%, 750=0.33%, 1000=0.14%
    lat (msec) : 2000=0.27%, >=2000=0.05%
  cpu          : usr=0.04%, sys=1.52%, ctx=45844, majf=0, minf=798
  IO depths    : 1=100.0%, 2=0.0%, 4=0.0%, 8=0.0%, 16=0.0%, 32=0.0%, >=64=0.0%
     submit    : 0=0.0%, 4=100.0%, 8=0.0%, 16=0.0%, 32=0.0%, 64=0.0%, >=64=0.0%
     complete  : 0=0.0%, 4=100.0%, 8=0.0%, 16=0.0%, 32=0.0%, 64=0.0%, >=64=0.0%
     issued    : total=r=1811/w=1851/d=0, short=r=0/w=0/d=0

Run status group 0 (all jobs):
   READ: io=28976KB, aggrb=2854KB/s, minb=2854KB/s, maxb=2854KB/s, mint=10151msec, maxt=10151msec
  WRITE: io=29616KB, aggrb=2917KB/s, minb=2917KB/s, maxb=2917KB/s, mint=10151msec, maxt=10151msec

Disk stats (read/write):
  sda: ios=1818/1846, merge=0/5, ticks=63776/33966, in_queue=104258, util=99.84%
among

bw: disk throughput, which is the focus of sequential read-write inspection, similar to download speed.
iops: the number of reads and writes per second of the disk, which is the focus of random read-write inspection
io total input and output
Run: total run time
lat (msec): delay (MS)
msec: milliseconds
usec: microseconds
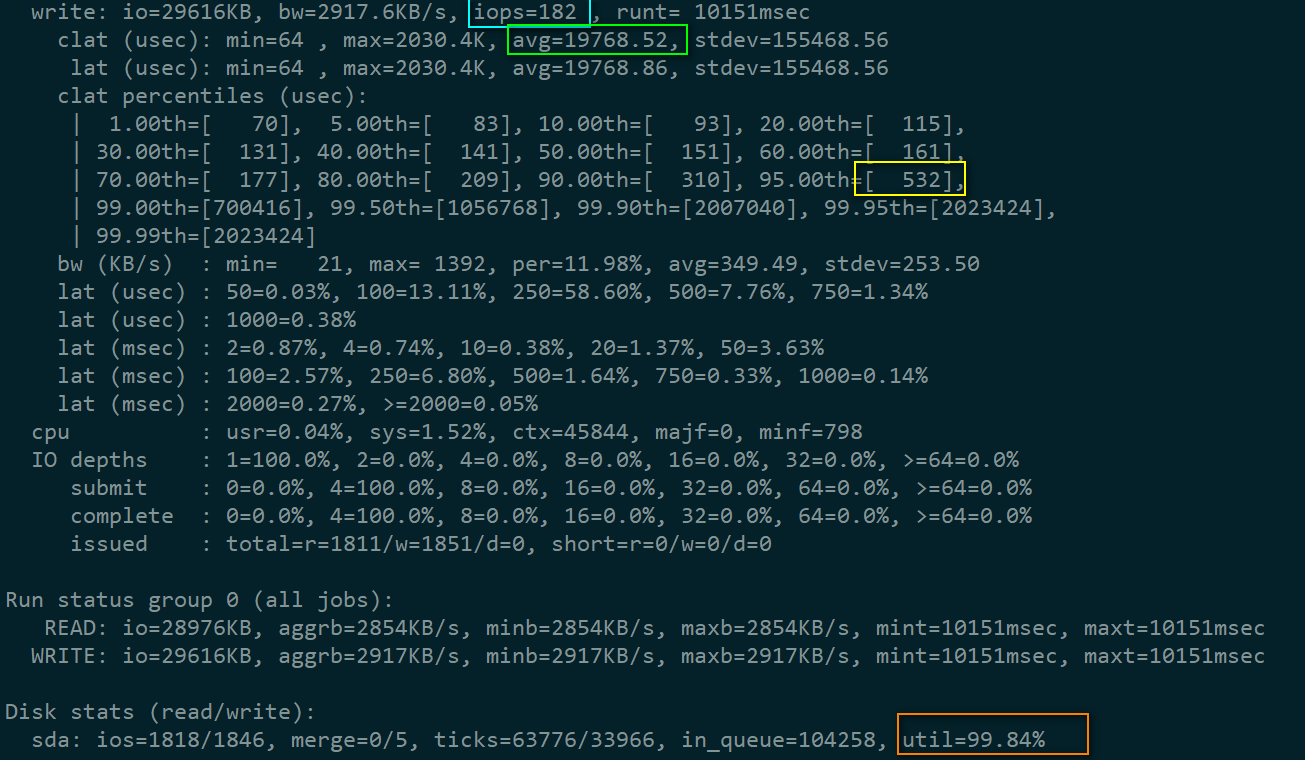
The measured IOPS 182 is in the blue box, and the average response time of each IO request is in the green box, about 19ms. The yellow box indicates that 95% of IO requests have a response time of 0.5 ms or less. The orange box indicates that the utilization rate of the hard disk has reached 99.84%.
Of course, the above is a virtual machine simulation test, and there are still deviations from the actual environment. What are the meanings of the above indicators

