Background introduction
This article will introduce the case of how to import the data in TiDB into Kafka through TiCDC and then consumed by Flink.
In order to quickly verify the functionality of the whole process, all components are deployed in a single machine. If you need to deploy in a production environment, it is recommended to replace each component with a highly available cluster deployment scheme.
Among them, we have created a separate Zookeeper single node environment, which is shared by Flink, Kafka, and other components.
For all components requiring JRE, such as Flink, Kafka and Zookeeper, considering that upgrading JRE may affect other applications, we choose each component to use its own JRE environment independently.
This paper is divided into two parts. The first five sections mainly introduce the construction of the basic environment, and the last section introduces how the data flows in each component.

Application scenario introduction
The structure of TiDB + Flink supports the development and running of many different kinds of applications.
At present, the main features include:
-
Batch flow integration
-
Sophisticated state management
-
Event time support
-
Accurate primary state consistency guarantee
Flink can run on a variety of resource management frameworks including YARN, Mesos and Kubernetes. It also supports independent deployment on bare metal clusters. TiDB can be deployed on AWS, Kubernetes, GCP and gke. It also supports independent deployment on bare metal clusters using TiUP.
The common applications of TiDB + Flink structure are as follows:
-
Event driven applications
-
Anti fraud
-
anomaly detection
-
Rule based alarm
-
Business process monitoring
-
Data analysis application
-
Network quality monitoring
-
Product update and test evaluation analysis
-
Impromptu analysis of factual data
-
Large scale graph analysis
-
Data pipeline application
-
Construction of e-commerce real-time query index
-
E-commerce continuous ETL
Operating system environment
[root@r20 topology]# cat /etc/redhat-release
CentOS Stream release 8
software environment
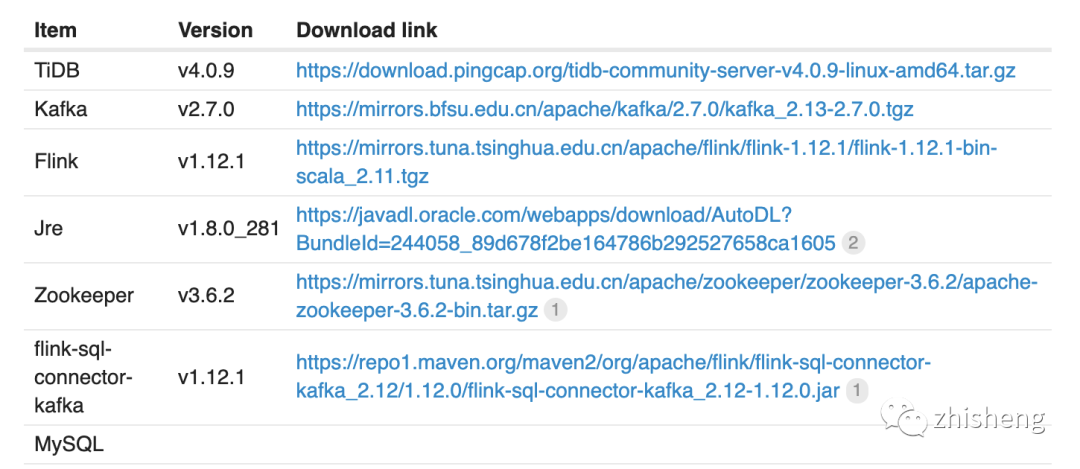
Machine allocation
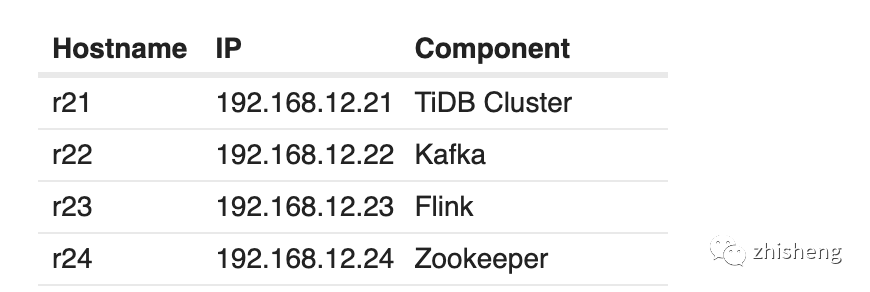
Deploy TiDB Cluster
Compared with the traditional stand-alone database, TiDB has the following advantages:
-
Pure distributed architecture, with good scalability and supporting elastic capacity expansion and contraction
-
It supports SQL, exposes the network protocol of MySQL, and is compatible with most MySQL syntax. It can directly replace MySQL in most scenarios
-
High availability is supported by default. When a few replicas fail, the database itself can automatically perform data repair and failover, which is transparent to the business
-
It supports ACID transactions and is friendly to some scenarios with strong consistent requirements, such as bank transfer
-
It has rich tool chain ecology, covering a variety of scenarios such as data migration, synchronization and backup
In terms of kernel design, TiDB distributed database divides the overall architecture into multiple modules, and each module communicates with each other to form a complete TiDB system. The corresponding architecture diagram is as follows:
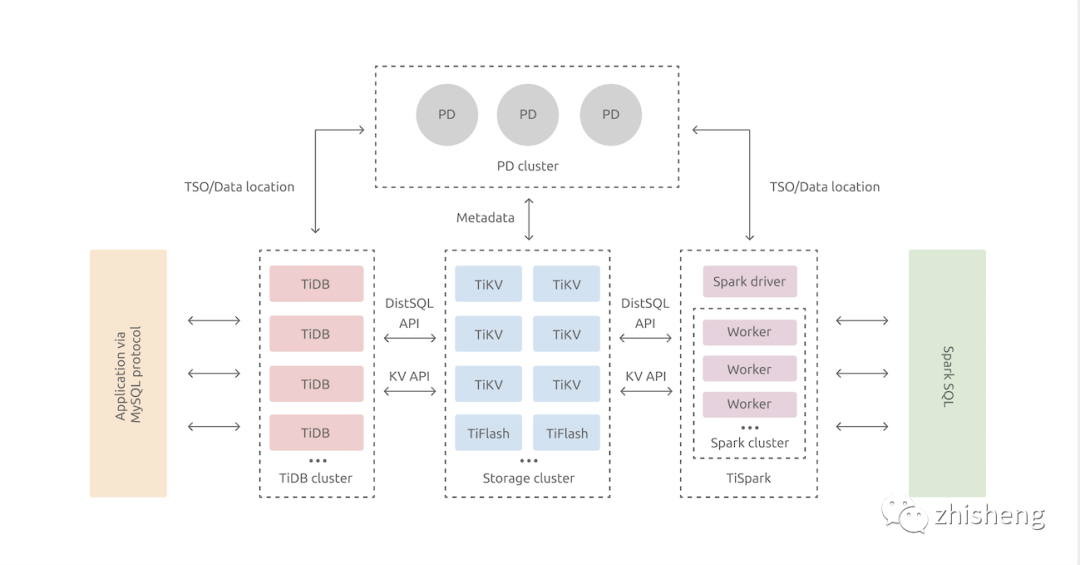
In this article, we only do the simplest function test, so we deploy a set of single node but replica TiDB, which involves the following three modules:
-
TiDB Server: SQL layer, which exposes the connection endpoint of MySQL protocol. It is responsible for accepting client connections, performing SQL parsing and optimization, and finally generating distributed execution plans.
-
PD (Placement Driver) Server: the meta information management module of the whole TiDB cluster, which is responsible for storing the real-time data distribution of each TiKV node and the overall topology of the cluster, providing the TiDB Dashboard control interface, and assigning transaction ID s to distributed transactions.
-
TiKV Server: it is responsible for storing data. Externally, TiKV is a distributed key value storage engine that provides transactions.
TiUP deployment template file
# # Global variables are applied to all deployments and used as the default value of
# # the deployments if a specific deployment value is missing.
global:
  user: "tidb"
  ssh_port: 22
  deploy_dir: "/opt/tidb-c1/"
  data_dir: "/opt/tidb-c1/data/"
# # Monitored variables are applied to all the machines.
#monitored:
#  node_exporter_port: 19100
#  blackbox_exporter_port: 39115
#  deploy_dir: "/opt/tidb-c3/monitored"
#  data_dir: "/opt/tidb-c3/data/monitored"
#  log_dir: "/opt/tidb-c3/log/monitored"
# # Server configs are used to specify the runtime configuration of TiDB components.
# # All configuration items can be found in TiDB docs:
# # - TiDB: https://pingcap.com/docs/stable/reference/configuration/tidb-server/configuration-file/
# # - TiKV: https://pingcap.com/docs/stable/reference/configuration/tikv-server/configuration-file/
# # - PD: https://pingcap.com/docs/stable/reference/configuration/pd-server/configuration-file/
# # All configuration items use points to represent the hierarchy, e.g:
# #   readpool.storage.use-unified-pool
# #
# # You can overwrite this configuration via the instance-level `config` field.
server_configs:
  tidb:
    log.slow-threshold: 300
    binlog.enable: false
    binlog.ignore-error: false
    tikv-client.copr-cache.enable: true
  tikv:
    server.grpc-concurrency: 4
    raftstore.apply-pool-size: 2
    raftstore.store-pool-size: 2
    rocksdb.max-sub-compactions: 1
    storage.block-cache.capacity: "16GB"
    readpool.unified.max-thread-count: 12
    readpool.storage.use-unified-pool: false
    readpool.coprocessor.use-unified-pool: true
    raftdb.rate-bytes-per-sec: 0
  pd:
    schedule.leader-schedule-limit: 4
    schedule.region-schedule-limit: 2048
    schedule.replica-schedule-limit: 64
pd_servers:
  - host: 192.168.12.21
    ssh_port: 22
    name: "pd-2"
    client_port: 12379
    peer_port: 12380
    deploy_dir: "/opt/tidb-c1/pd-12379"
    data_dir: "/opt/tidb-c1/data/pd-12379"
    log_dir: "/opt/tidb-c1/log/pd-12379"
    numa_node: "0"
    # # The following configs are used to overwrite the `server_configs.pd` values.
    config:
      schedule.max-merge-region-size: 20
      schedule.max-merge-region-keys: 200000
tidb_servers:
  - host: 192.168.12.21
    ssh_port: 22
    port: 14000
    status_port: 12080
    deploy_dir: "/opt/tidb-c1/tidb-14000"
    log_dir: "/opt/tidb-c1/log/tidb-14000"
    numa_node: "0"
    # # The following configs are used to overwrite the `server_configs.tidb` values.
    config:
      log.slow-query-file: tidb-slow-overwrited.log
      tikv-client.copr-cache.enable: true
tikv_servers:
  - host: 192.168.12.21
    ssh_port: 22
    port: 12160
    status_port: 12180
    deploy_dir: "/opt/tidb-c1/tikv-12160"
    data_dir: "/opt/tidb-c1/data/tikv-12160"
    log_dir: "/opt/tidb-c1/log/tikv-12160"
    numa_node: "0"
    # # The following configs are used to overwrite the `server_configs.tikv` values.
    config:
      server.grpc-concurrency: 4
      #server.labels: { zone: "zone1", dc: "dc1", host: "host1" }
#monitoring_servers:
#  - host: 192.168.12.21
#    ssh_port: 22
#    port: 19090
#    deploy_dir: "/opt/tidb-c1/prometheus-19090"
#    data_dir: "/opt/tidb-c1/data/prometheus-19090"
#    log_dir: "/opt/tidb-c1/log/prometheus-19090"
#grafana_servers:
#  - host: 192.168.12.21
#    port: 13000
#    deploy_dir: "/opt/tidb-c1/grafana-13000"
#alertmanager_servers:
#  - host: 192.168.12.21
#    ssh_port: 22
#    web_port: 19093
#    cluster_port: 19094
#    deploy_dir: "/opt/tidb-c1/alertmanager-19093"
#    data_dir: "/opt/tidb-c1/data/alertmanager-19093"
#    log_dir: "/opt/tidb-c1/log/alertmanager-19093"
TiDB Cluster environment
The focus of this article is not to deploy TiDB Cluster. As a rapid experimental environment, TiDB Cluster cluster with a single copy is deployed on only one machine. There is no need to deploy the monitoring environment.
[root@r20 topology]# tiup cluster display tidb-c1-v409
Starting component `cluster`: /root/.tiup/components/cluster/v1.3.2/tiup-cluster display tidb-c1-v409
Cluster type:       tidb
Cluster name:       tidb-c1-v409
Cluster version:    v4.0.9
SSH type:           builtin
Dashboard URL:      http://192.168.12.21:12379/dashboard
ID                   Role  Host           Ports        OS/Arch       Status   Data Dir                      Deploy Dir
--                   ----  ----           -----        -------       ------   --------                      ----------
192.168.12.21:12379  pd    192.168.12.21  12379/12380  linux/x86_64  Up|L|UI  /opt/tidb-c1/data/pd-12379    /opt/tidb-c1/pd-12379
192.168.12.21:14000  tidb  192.168.12.21  14000/12080  linux/x86_64  Up       -                             /opt/tidb-c1/tidb-14000
192.168.12.21:12160  tikv  192.168.12.21  12160/12180  linux/x86_64  Up       /opt/tidb-c1/data/tikv-12160  /opt/tidb-c1/tikv-12160
Total nodes: 4
Create a table for testing
mysql> show create table t1;
+-------+-------------------------------------------------------------------------------------------------------------------------------+
| Table | Create Table                                                                                                                  |
+-------+-------------------------------------------------------------------------------------------------------------------------------+
| t1    | CREATE TABLE `t1` (
  `id` int(11) NOT NULL,
  PRIMARY KEY (`id`)
) ENGINE=InnoDB DEFAULT CHARSET=utf8mb4 COLLATE=utf8mb4_bin |
+-------+-------------------------------------------------------------------------------------------------------------------------------+
1 row in set (0.00 sec)
Deploy Zookeeper environment
In this experiment, Zookeeper environment is configured separately to provide services for Kafka and Flink environments.
As an experimental demonstration scheme, only the stand-alone environment is deployed.
Unzip the Zookeeper package
[root@r24 soft]# tar vxzf apache-zookeeper-3.6.2-bin.tar.gz
[root@r24 soft]# mv apache-zookeeper-3.6.2-bin /opt/zookeeper
Deploy jre for Zookeeper
[root@r24 soft]# tar vxzf jre1.8.0_281.tar.gz
[root@r24 soft]# mv jre1.8.0_281 /opt/zookeeper/jre
Modify / opt/zookeeper/bin/zkEnv.sh file to add JAVA_HOME environment variable
## add bellowing env var in the head of zkEnv.sh
JAVA_HOME=/opt/zookeeper/jre
Create a profile for Zookeeper
[root@r24 conf]# cat zoo.cfg | grep -v "#"
tickTime=2000
initLimit=10
syncLimit=5
dataDir=/opt/zookeeper/data
clientPort=2181
Start Zookeeper
[root@r24 bin]# /opt/zookeeper/bin/zkServer.sh start
Check the status of Zookeeper
## check zk status
[root@r24 bin]# ./zkServer.sh status
ZooKeeper JMX enabled by default
Using config: /opt/zookeeper/bin/../conf/zoo.cfg
Client port found: 2181. Client address: localhost. Client SSL: false.
Mode: standalone
## check OS port status
[root@r24 bin]# netstat -ntlp
Active Internet connections (only servers)
Proto Recv-Q Send-Q Local Address           Foreign Address         State       PID/Program name
tcp        0      0 0.0.0.0:22              0.0.0.0:*               LISTEN      942/sshd
tcp6       0      0 :::2181                 :::*                    LISTEN      15062/java
tcp6       0      0 :::8080                 :::*                    LISTEN      15062/java
tcp6       0      0 :::22                   :::*                    LISTEN      942/sshd
tcp6       0      0 :::44505                :::*                    LISTEN      15062/java
## use zkCli tool to check zk connection
[root@r24 bin]# ./zkCli.sh -server 192.168.12.24:2181
Suggestions on Zookeeper
I personally have an immature suggestion about Zookeeper:
The Zookeeper cluster version must enable network monitoring.
In particular, pay attention to the network bandwidth in system metrics.
Deploy Kafka
Kafka is a distributed stream processing platform, which is mainly used in two types of applications:
-
A real-time stream data pipeline is constructed, which can reliably obtain data between systems or applications( Equivalent to message queue)
-
Build real-time streaming applications to transform or influence these streaming data( That is, flow processing, which changes internally between kafka stream topic and topic)
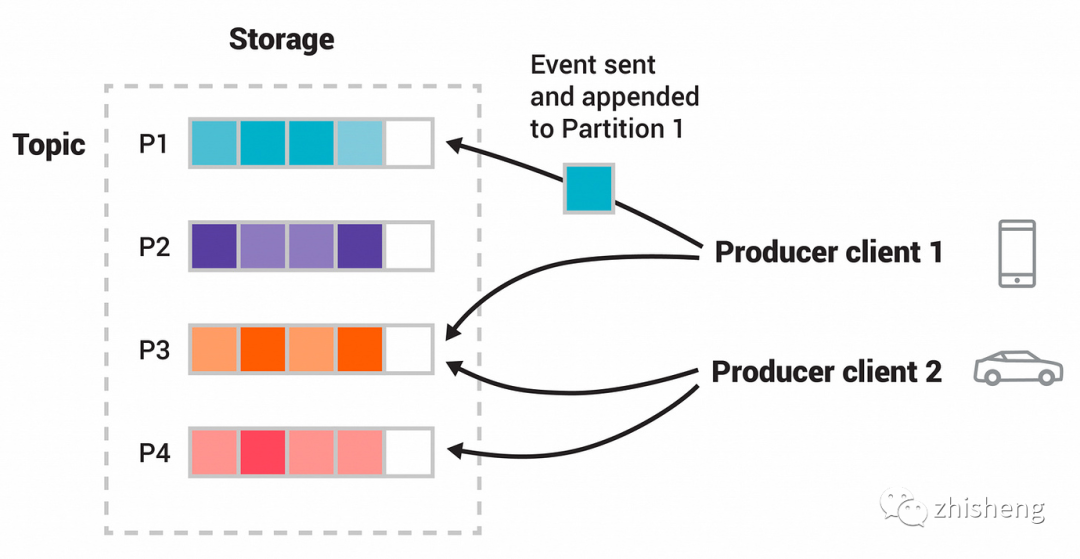
Kafka has four core API s:
-
The Producer API allows an application to publish a stream of data to one or more Kafka topic s.
-
The Consumer API allows an application to subscribe to one or more topic s and process the streaming data published to them.
-
The Streams API allows an application as a stream processor to consume input streams generated by one or more topics, and then produce an output stream to one or more topics for effective conversion in the input and output streams.
-
The Connector API allows to build and run reusable producers or consumers to connect Kafka topics to existing applications or data systems. For example, connect to a relational database and capture all changes to the table.
In this experiment, only functional verification is done, and only a stand-alone Kafka environment is built.
Download and unzip Kafka
[root@r22 soft]# tar vxzf kafka_2.13-2.7.0.tgz
[root@r22 soft]# mv kafka_2.13-2.7.0 /opt/kafka
Deploy jre for Kafka
[root@r22 soft]# tar vxzf jre1.8.0_281.tar.gz
[root@r22 soft]# mv jre1.8.0_281 /opt/kafka/jre
Modify Kafka's jre environment variable
[root@r22 bin]# vim /opt/kafka/bin/kafka-run-class.sh
## add bellowing line in the head of kafka-run-class.sh
JAVA_HOME=/opt/kafka/jre
Modify Kafka profile
modify Kafka configuration file /opt/kafka/config/server.properties

## change bellowing variable in /opt/kafka/config/server.properties
broker.id=0
listeners=PLAINTEXT://192.168.12.22:9092
log.dirs=/opt/kafka/logs
zookeeper.connect=i192.168.12.24:2181
Start Kafka
[root@r22 bin]# /opt/kafka/bin/kafka-server-start.sh /opt/kafka/config/server.properties
View version information of Kafka
Kafka Not provided --version of optional To see Kafka Version information for.

[root@r22 ~]# ll /opt/kafka/libs/ | grep kafka
-rw-r--r-- 1 root root  4929521 Dec 16 09:02 kafka_2.13-2.7.0.jar
-rw-r--r-- 1 root root      821 Dec 16 09:03 kafka_2.13-2.7.0.jar.asc
-rw-r--r-- 1 root root    41793 Dec 16 09:02 kafka_2.13-2.7.0-javadoc.jar
-rw-r--r-- 1 root root      821 Dec 16 09:03 kafka_2.13-2.7.0-javadoc.jar.asc
-rw-r--r-- 1 root root   892036 Dec 16 09:02 kafka_2.13-2.7.0-sources.jar
-rw-r--r-- 1 root root      821 Dec 16 09:03 kafka_2.13-2.7.0-sources.jar.asc
... ...
Where 2.13 is the version information of scale and 2.7.0 is the version information of Kafka.
Deploy Flink
Apache Flink is a framework and distributed processing engine for stateful computing on unbounded and bounded data streams. Flink can run in all common cluster environments and can calculate at memory speed and any size.
Apache Flink, a distributed processing framework supporting high throughput, low latency and high performance, is a framework and distributed processing engine for stateful computing of unbounded and bounded data streams. Flink is designed to run in all common cluster environments and perform calculations at memory execution speed and any size.

This experiment only does functional testing and only deploys the stand-alone Flink environment.
Download and distribute Flink
[root@r23 soft]# tar vxzf flink-1.12.1-bin-scala_2.11.tgz
[root@r23 soft]# mv flink-1.12.1 /opt/flink
Deploy jre for Flink
[root@r23 soft]# tar vxzf jre1.8.0_281.tar.gz
[root@r23 soft]# mv jre1.8.0_281 /opt/flink/jre
Add lib required by Flink
Flink consumption Kafka Data, required flink-sql-connector-kafka package

Flink link MySQL/TiDB,need flink-connector-jdbc package

[root@r23 soft]# mv flink-sql-connector-kafka_2.12-1.12.0.jar /opt/flink/lib/
[root@r23 soft]# mv flink-connector-jdbc_2.12-1.12.0.jar /opt/flink/lib/
Modify Flink profile
## add or modify bellowing lines in /opt/flink/conf/flink-conf.yaml
jobmanager.rpc.address: 192.168.12.23
env.java.home: /opt/flink/jre
Launch Flink
[root@r23 ~]# /opt/flink/bin/start-cluster.sh
Starting cluster.
Starting standalonesession daemon on host r23.
Starting taskexecutor daemon on host r23.
View Flink GUI
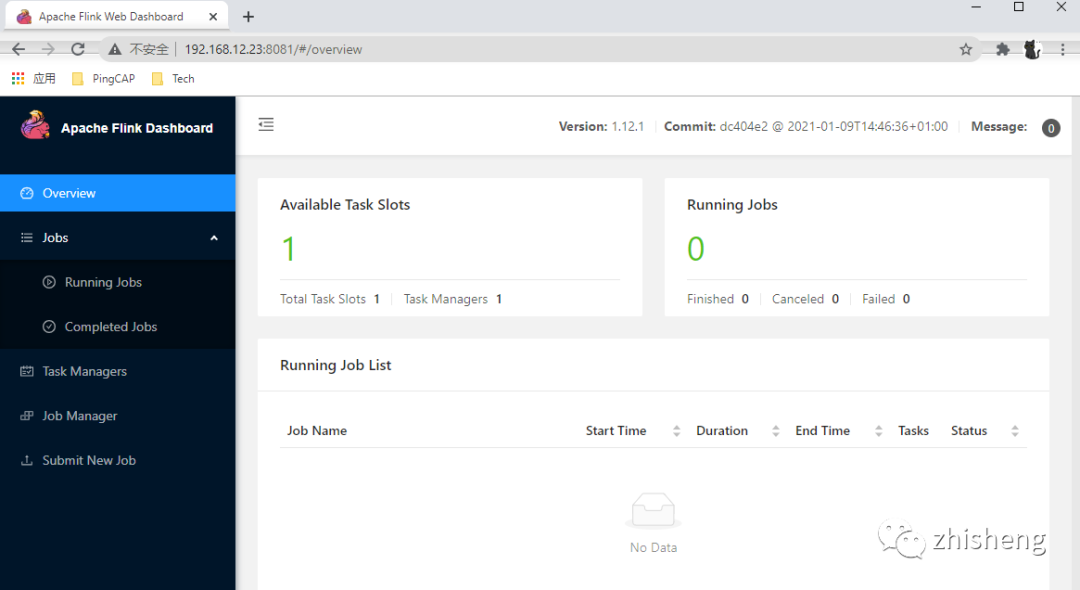
Configure data flow
Ticdc - > Kafka path
TiCDC runtime is a stateless node, which realizes high availability through etcd inside PD. TiCDC cluster supports the creation of multiple synchronization tasks to synchronize data to multiple different downstream.
The system architecture of TiCDC is shown in the following figure:
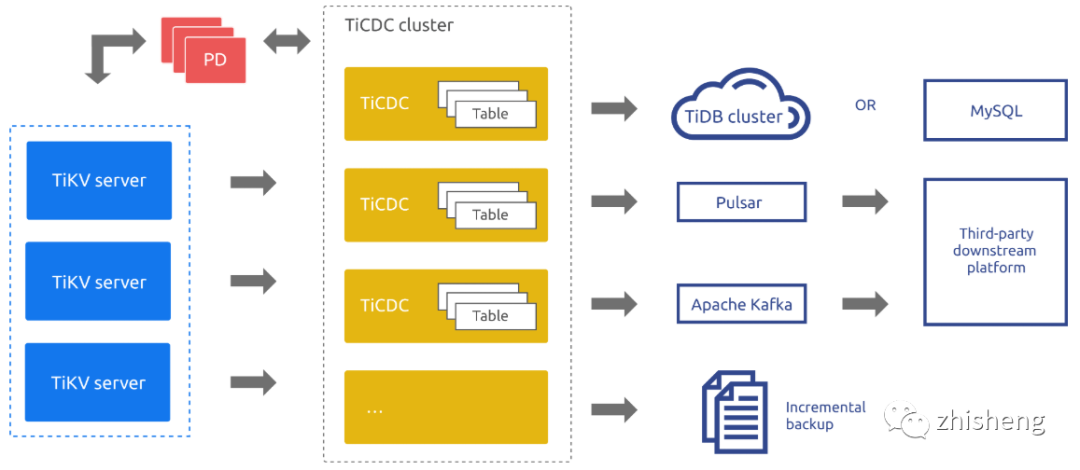
System role of TiCDC:
-
TiKV CDC component: only key value (kV) change log is output.
-
Internal logic assembly KV change log.
-
It provides an interface for outputting KV change log, and sending data includes real-time change log and incremental scan change log.
-
capture: TiCDC runs the process. Multiple captures form a TiCDC cluster, which is responsible for the synchronization of kV change logs.
-
-
Each capture is responsible for pulling a part of KV change log.
-
Sort one or more kV change logs pulled.
-
Restore transactions downstream or output according to TiCDC Open Protocol.
-
Create a Kafka Topic
Create Kafka topic ticdc test
[root@r22 ~]# /opt/kafka/bin/kafka-topics.sh --create \
> --zookeeper 192.168.12.24:2181 \
> --config max.message.bytes=12800000 \
> --config flush.messages=1 \
> --replication-factor 1 \
> --partitions 1 \
> --topic ticdc-test
Created topic ticdc-test.
View all topics in Kafka
[root@r22 ~]# /opt/kafka/bin/kafka-topics.sh --list --zookeeper 192.168.12.24:2181
ticdc-test
View the information of topic ticdc test in Kafka
[root@r22 ~]# /opt/kafka/bin/kafka-topics.sh --describe --zookeeper 192.168.12.24:2181  --topic ticdc-test
Topic: ticdc-test       PartitionCount: 1       ReplicationFactor: 1    Configs: max.message.bytes=12800000,flush.messages=1
        Topic: ticdc-test       Partition: 0    Leader: 0       Replicas: 0     Isr: 0
Create Kafka's changefeed in TiCDC
Create the changefeed configuration file and open enable old value:
## create a changefeed configuration file
[root@r21 ~]# cat /opt/tidb-c1/cdc-18300/conf/cdc-changefeed-old-value-enabled.conf
enable-old-value=true
Create Kafka's changefeed:
## create a changefeed for kafka
[root@r21 ~]# /opt/tidb-c1/cdc-18300/bin/cdc cli changefeed create \
> --pd=http://192.168.12.21:12379  \
> --sink-uri="kafka://192.168.12.22:9092/ticdc-test?kafka-version=2.7.0&partition-num=1&max-message-bytes=67108864&replication-factor=1&enable-old-value=true&protocol=canal-json" \
> --changefeed-id="ticdc-kafka" \
> --config=/opt/tidb-c1/cdc-18300/conf/cdc-changefeed-old-value-enabled.conf
Create changefeed successfully!
ID: ticdc-kafka
Info: {"sink-uri":"kafka://192.168.12.22:9092/ticdc-test?kafka-version=2.7.0\u0026artition-num=1\u0026max-message-bytes=67108864\u0026replication-factor=1\u0026enable-old-value=true\u0026protocol=canal-json","opts":{"max-message-bytes":"67108864"},"create-time":"2021-02-22T00:08:50.185073755-05:00","start-ts":423092690661933057,"target-ts":0,"admin-job-type":0,"sort-engine":"memory","sort-dir":".","config":{"case-sensitive":true,"enable-old-value":true,"force-replicate":false,"check-gc-safe-point":true,"filter":{"rules":["*.*"],"ignore-txn-start-ts":null,"ddl-allow-list":null},"mounter":{"worker-num":16},"sink":{"dispatchers":null,"protocol":"canal-json"},"cyclic-replication":{"enable":false,"replica-id":0,"filter-replica-ids":null,"id-buckets":0,"sync-ddl":false},"scheduler":{"type":"table-number","polling-time":-1}},"state":"normal","history":null,"error":null,"sync-point-enabled":false,"sync-point-interval":600000000000}
[root@r21 ~]# cat /opt/tidb-c1/cdc-18300/conf/cdc-changefeed-old-value-enabled.conf
The configuration of the sink url parameter of Kafka is as follows:
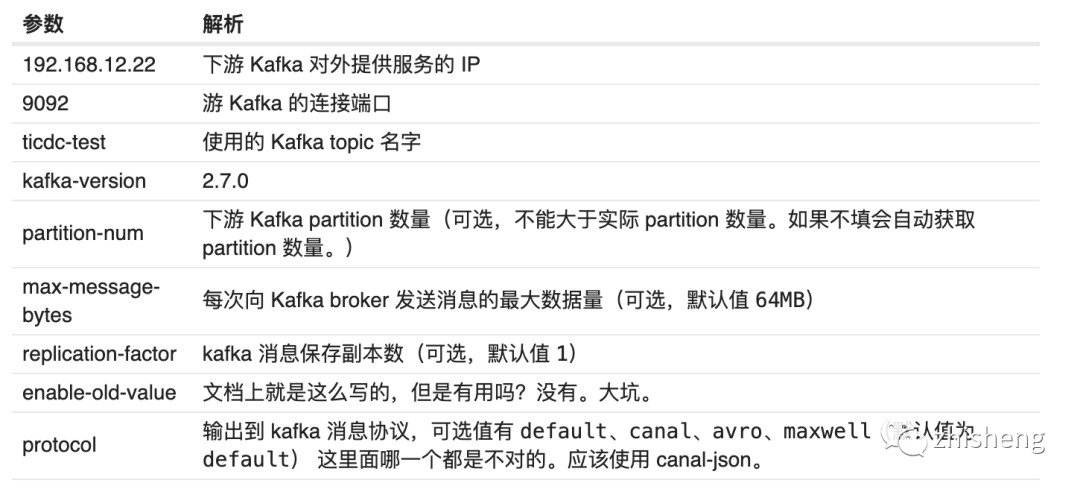
To view the changefeed that has been created:
[root@r21 ~]# /opt/tidb-c1/cdc-18300/bin/cdc cli changefeed --pd=http://192.168.12.21:12379 list
[
  {
    "id": "ticdc-kafka",
    "summary": {
      "state": "normal",
      "tso": 423092789699936258,
      "checkpoint": "2021-02-22 00:15:07.974",
      "error": null
    }
  }
]
To view the information of ticdc Kafka changefeed:
[root@r21 ~]# /opt/tidb-c1/cdc-18300/bin/cdc cli changefeed --pd=http://192.168.12.21:12379 query -c ticdc-kafka
{
  "info": {
    "sink-uri": "kafka://192.168.12.22:9092/ticdc-test?kafka-version=2.7.0\u0026artition-num=1\u0026max-message-bytes=67108864\u0026replication-factor=1\u0026enable-old-value=true\u0026protocol=canal                                                                            -json",
    "opts": {
      "max-message-bytes": "67108864"
    },
    "create-time": "2021-02-22T00:08:50.185073755-05:00",
    "start-ts": 423092690661933057,
    "target-ts": 0,
    "admin-job-type": 0,
    "sort-engine": "memory",
    "sort-dir": ".",
    "config": {
      "case-sensitive": true,
      "enable-old-value": true,
      "force-replicate": false,
      "check-gc-safe-point": true,
      "filter": {
        "rules": [
          "*.*"
        ],
        "ignore-txn-start-ts": null,
        "ddl-allow-list": null
      },
      "mounter": {
        "worker-num": 16
      },
      "sink": {
        "dispatchers": null,
        "protocol": "canal-json"
      },
      "cyclic-replication": {
        "enable": false,
        "replica-id": 0,
        "filter-replica-ids": null,
        "id-buckets": 0,
        "sync-ddl": false
      },
      "scheduler": {
        "type": "table-number",
        "polling-time": -1
      }
    },
    "state": "normal",
    "history": null,
    "error": null,
    "sync-point-enabled": false,
    "sync-point-interval": 600000000000
  },
  "status": {
    "resolved-ts": 423093295690285057,
    "checkpoint-ts": 423093295428403201,
    "admin-job-type": 0
  },
  "count": 0,
  "task-status": []
}
View consumer information in Kafka
After creating Kafka's changefeed in TiCDC and flowing the data to TiCDC test topic in Kafka, the channel of TiCDC - > Kafka has been established.
Insert a piece of data to test:
mysql> insert into t1 values(1);
Query OK, 1 row affected (0.00 sec)
You can see the following information in the log output of TiCDC:
[2021/02/22 01:14:02.816 -05:00] [INFO] [statistics.go:118] ["sink replication status"] [name=MQ] [changefeed=ticdc-kafka] [captureaddr=192.168.12.21:18300] [count=1] [qps=0]
At this point, check the customer information of Kafka, and you can see that the data has come:
[root@r22 bin]# /opt/kafka/bin/kafka-console-consumer.sh --bootstrap-server 192.168.12.22:9092 --topic ticdc-test --from-beginning
{"id":0,"database":"test","table":"t1","pkNames":["id"],"isDdl":false,"type":"INSERT","es":1613974420325,"ts":0,"sql":"","sqlType":{"id":-5},"mysqlType":{"id":"int"},"data":[{"id":"1"}],"old":[null]}
Kafka - > Flink path
In Flink's SQL client, create the t1 table. The connector uses kafka type:
[root@r23 ~]# /opt/flink/bin/sql-client.sh embedded
## create a test table t1 in
Flink SQL> create table t1(id int)
> WITH (
>  'connector' = 'kafka',
>  'topic' = 'ticdc-test',
>  'properties.bootstrap.servers' = '192.168.12.22:9092',
>  'properties.group.id' = 'cdc-test-consumer-group',
>  'format' = 'canal-json',
>  'scan.startup.mode' = 'latest-offset'
> );
Flink SQL> select * from t1;
Insert data in TiDB and query from Flink:
## insert a test row in TiDB
mysql> insert into test.t1 values(4);
Query OK, 1 row affected (0.00 sec)
## check the result from Flink
                                                                                             SQL Query Result (Table)
 Refresh: 1 s                                                                                    Page: Last of 1                                                                            Updated: 03:02:28.838
                        id
                         4