Last weekend, I had nothing to do at home, so I set up EFK environment for the project team to collect logs. The final goal of the deployment is as follows:
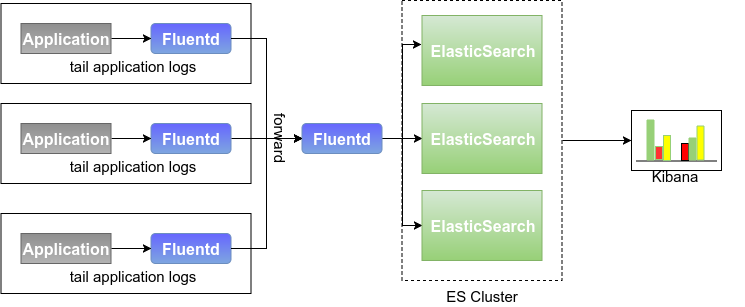
In each application machine, a Fluent serves as the proxy, reads the specified application log file in tail mode, and then Forward to Fluentd, which acts as the aggregation end. The aggregation end processes and decomposes the log content into structured content, and then stores it in Elastic Search. The presentation of log content is implemented by Kinana.
Fluentd What is it? Fluentd is a completely free, fully open source log collector that can work with More than 125 systems Relatively, achieve the "log everything" architecture.

Because Elastic Search and Kibana have been deployed on Kubernetes container platform before, we are busy with the installation and configuration of Fluentd at the weekend. We haven't used it before, but we are now learning to resell it. As a result, there are several problems in the process of tossing and turning. Let me record them here.
Output plug-in request timeout
In our deployment, only two Output plug-ins, Fluentd, are used. One is Ouput-Forward, which is used to transfer log content backwards on the proxy side, and the other is Output-Elastic Search, which is used to store data in ES.
- Proxy Output-Forward Plug-in Configuration (initial)
  <match **>
    @type             forward
    require_ack_response ture
    <server>
      host             10.xxx.xx.xx
      port             24224
    </server>
    <buffer tag>
      @type            file
      path             /xxx/xxx/buffer
      flush_interval   10s
      total_limit_size 1G
    </buffer>
  </match>
- Configuration of Output-Elastic Search Plug-in on the sink side (initial)
  <match xxxxx.xxxxx.**>
    @type              elasticsearch
    host               10.xxx.xx.xxx
    port               30172
    logstash_format    true
    logstash_prefix    log.xxxxx.xxxxx.xxxxx-
    <buffer tag>
      @type            file
      path             "/xxx/xxx/fluentd/aggregator/xxxx/buffer"
      total_limit_size 20G
      flush_interval   10s
    </buffer>
  </match>
After configuring, after simple test run-through, take the log number generated in January-March on the application of a machine with full joy. From the Kibana interface, the number of logs on the Green Column grows upwards, thousands of... Tens of thousands... millions... Two million, and then sent pictures to the project team to show off. Think back that there can't be so many log records!? Log in to the application server log directory wc, the total number of file lines is only 1.5 million! Stunned!
Running into the Kibana interface and looking at it, we found that there were duplicates in the log records, such as 233 times for a record. At that time, we did not know the specific reason. We speculated that the Output-Elastic Search plug-in might have retransmitted the content to Elastic Search because the response timed out. So we tried to find the corresponding parameter: request_timeout was added to the sink configuration. The default value of the parameter is: 5s.
<match xxxxx.xxxxx.**>
  @type              elasticsearch
  ...
  request_timeout    30s
  <buffer tag>
    ...
  </buffer>
</match>
Signal HUP to the sink-side Fluentd process to reload the modified configuration, try again, and no duplicate logging occurs. However, the timeout is only an appearance, the real reason is the buffer configuration operation, see the next item.
Request Entity Too Large
Before explaining this problem, first look at Fluentd's buffer mechanism, which acts as the buffer of the Output plug-in. When the output terminal (e.g. Elastic Search) service is not available, Fluentd temporarily caches the output content to the file or memory, and then retries it to the output terminal.

What? Then the output service is always not restored, light can not go in, the enterprise is not to burst the Fluend buffer to lose log data?
When the buffer Full, the BufferOverflow Error exception is generated by default, and the input plug-in handles the exception by itself. The in_tail plug-in we use stops reading the log file content, and the in_forward plug-in returns errors to the upper ouput_forward plug-in. In addition to generating exceptions, overflow_action (>= 1.0) or buffer_queue_full_action (< 1.0) can be used to control the behavior of the buffer when it is full:
- throw_exception
- block
- drop_oldest
For more details, please see: Official Website Output Plugin Overview (>= 1.0) or Buffer Plugin Overview
Why do we talk about buffer? Because the problem is related to it. After modifying the request_timeout parameter, you often see error messages:
2018-03-04 15:10:12 +0800 [warn]: #0 fluent/log.rb:336:warn: Could not push logs to Elasticsearch, resetting connection and trying again. Connection reset by peer (Errno::ECONNRESET)
Display that the connection is forcibly disconnected by the Elastic Search end. What happens? Force trace log level when fluentd is started on the command line, and no error can be found in full screen output except ECCONNRESET. The Elastic Search end log also did not see abnormal information. We have to turn to another killer, tcpdump, to grab the communication package between ES and tcpdump.
sudo tcpdump -A -nn -s 0 'tcp port 9200 ' -i eth1 #9200yes ES Port to accept requestsYes, request the header:
User-Agent: Faraday v0.13.1
Content-Type: application/json
Host: 10.210.39.136:30172
Content-Length: 129371575
Response Packet Header:
HTTP/1.1 413 Request Entity Too Large
content-length: 0
Request Entity Too Large! Check the Elastic Search document. The default acceptable packet size for ES is 100MB, controlled by the `http.max_content_length'parameter. And the length of the packets we upload is significantly larger than this limitation Content-Length: 129371575
.
What caused the result? From the above schematic diagram of Fluentd Buffer, we can see that the Output plug-in sends data packets to the output terminal in Chunk unit, and the size of Chunk is set by the parameter chunk_limit_size.( Description document here Default value: memory buffer 8MB / file buffer 256MB. We didn't set it in our initial configuration. We used the default value, so it's not uncommon for Request Entity Too Large! Errors to occur. Adding chunk_limit_size parameter settings to buffer-related configurations at the proxy and sink ends respectively:
<buffer tag>
  ...
  chunk_limit_size        10M
  ...
</buffer>
<buffer tag>
...
chunk_limit_size 15M
...
</buffer>Think about the previous section which explained that the request timeout between ES is related to the default chunk size setting. The default 256M chunk size of file buffer is given to the ES side, which is 100MB in size not exceeding its limit. It also allows ES to process for a long time, so there will be a request timeout.
In the process of configuration, I misread the old version of the document and used the parameter buffer_chunk_limit to set it up. It didn't work and confused me for a while.
In addition, can you set the chunk size of the sink side to be smaller than that of the proxy side? Yes, but warning logs will be generated at the sink. Look at the following code roughly, and say what I understand (not necessarily right). When Flunetd receives the chunk data from the previous level, it does not deal with the size first. When it sends to the next level, it encodes the chunk according to the type of the latter level, and then compares it with the size of the chunk set. If it is larger than the setting, it splits it into more than one and then sends the code. A warning log is generated during this period.
Increase Elastic Search log data reconfiguration
In order to prevent the recurrence of duplication of log records, in addition to the above configuration processing, it is better to generate a key value for each log before sending Elastic Search, so that when ES receives duplicate records, if the records corresponding to the primary key already exist, then Update, otherwise Insert.
<filter aplus.batch.**>
  @type            elasticsearch_genid
  hash_id_key      _hash    # storing generated hash id key (default is _hash)
</filter>

<match aplus.batch.**>
  @type              elasticsearch
  ...
  id_key             _hash # specify same key name which is specified in hash_id_key
  remove_keys        _hash # Elasticsearch doesn't like keys that start with _
  ...
</match>
Timestamp is Unix Time format!
Because in the log record sent to Elastic Searc, the domain value indicating the log time is spliced and converted to the date type:
${ DateTime.parse(record["systemDate"] + " " + record["systemTime"] + " +0800").to_time.to_i }Note that you must use the to_i method at the end to convert it into Unix Time format. Otherwise, an error will occur when encoding the ES data, as large as the error message "msgPack method on the Time type is not found".
Additionally: Output-Elastic Search plug-in documentation, Official website The content is incomplete. Here.
Attach all configuration file contents:
<system>
  worker            2
  root_dir          /xxxx/xxxxx/fluentd/agent
  log_level         info
</system>

<source>
  @type             tail
  tag               xxxxx.xxxxx.agent.log
  path_key          path
  path              /xxxx/xxxxx/agent/logs/xxxxx/*.batch*.log
  pos_file          /xxxx/xxxxx/fluentd/agent/pos/batch_agent.db
  read_from_head    true

  <parse>
    @type             multiline
    format_firstline  /^(\d+-\d+-\d+\s+)?\d+:\d+:\d+\|/
    format1           /^(?<log>(\d+-\d+-\d+\s+)?\d+:\d+:\d+\|.*)$/
  </parse>
  #multiline_flush_interval 5s
</source>

<filter foo.bar>
  @type             record_transformer
  <record>
    hostname        "#{Socket.gethostname}"
  </record>
</filter>

<match **>
  @type             forward
  require_ack_response ture
  <server>
    host             xx.xxx.xx.xx
    port             24224
  </server>
  <buffer tag>
    @type            file
    path             /xxxx/xxxxx/fluentd/agent/buffer
    flush_interval   10s
    total_limit_size 1G
    chunk_limit_size 10M
  </buffer>
</match>
<source>
@type forward
bind 0.0.0.0
source_address_key hostIP
</source>
<filter xxxxx.xxxxx.agent.log>
@type parser
reserve_data true
key_name log
<parse>
@type regexp
expression /(?mx)^(?<systemDate>\d+-\d+-\d+)?\s?(?<systemTime>\d+:\d+:\d+)\|(?<bizDate>.*)\|(?<artiPersonCode>.*)\|(?<invokeSeqNo>.*)\|(?<orgCode>.*)\|(?<tranCode>.*)\|(?<bizNo>.*)\|(?<dueNum>.*)\|(?<jobId>.*)\|(?<jobRunId>.*)\|(?<message>.*)\|(?<file>.*)\|(?<line>.*)\|(?<thread>.*)\|(?<logLevel>.*)\|(?<misc>.*)$/
</parse>
</filter>
<filter xxxxx.xxxxx.agent.log>
@type record_transformer
enable_ruby true
<record>
systemDate ${ if !(o=record["systemDate"]).nil? and o.length!=0 then o else if (d=record["path"].scan(/\d{4}-\d{2}-\d{2}/).last).nil? then Time.new.strftime("%Y-%m-%d") else d end end }
</record>
</filter>
<filter xxxxx.xxxxx.agent.log>
@type record_transformer
enable_ruby true
<record>
logtime ${ DateTime.parse(record["systemDate"] + " " + record["systemTime"] + " +0800").to_time.to_i }
</record>
renew_time_key logtime
remove_keys logtime,systemDate,systemTime
</filter>
<filter xxxxx.xxxxx.**>
@type elasticsearch_genid
hash_id_key _hash # storing generated hash id key (default is _hash)
</filter>
<match aplus.batch.**>
@type elasticsearch
host xx.xxx.xx.xxxx
port 9200
id_key _hash # specify same key name which is specified in hash_id_key
remove_keys _hash # Elasticsearch doesn't like keys that start with _
logstash_format true
logstash_prefix log.xxxx.xxxxx.agent-
request_timeout 30s
# reload_connections false
slow_flush_log_threshold 30s
<buffer tag>
@type file
path "/xxxx/xxxxx/fluentd/aggregator/#{ENV['HOSTNAME']}/buffer"
total_limit_size 20G
chunk_limit_size 15M
flush_interval 10s
retry_wait 10.0
</buffer>
</match>