Five minutes to start:
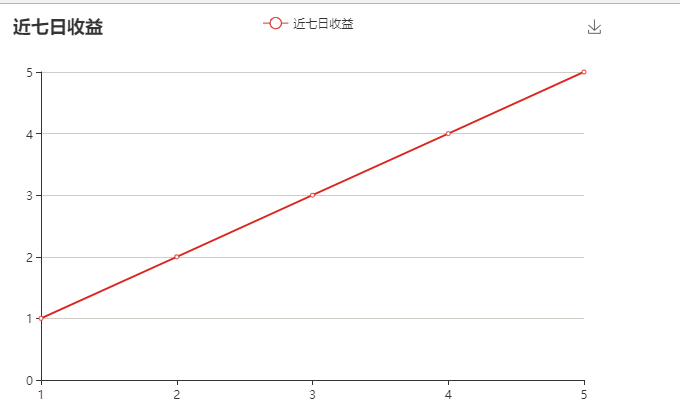
Picture.png
<!DOCTYPE html>
<html>
     <head>
          <meta charset="utf-8">
          <title>Line chart in five minutes</title>
          <!-- Introduce echarts.js -->
          <script src="js/echarts.min.js"></script>
          <script src="js/jquery-1.11.3.js"></script>
     </head>
     <body>
          <!-- by ECharts Prepare a Dom -->
          <div id="main" style="width: 600px;height:400px;"></div>
          <script type="text/javascript">

              // Initialize the echarts instance based on the prepared dom
              var myChart = echarts.init(document.getElementById('main'));
              // Specify configuration items and data for the chart
              myChart.setOption({
                       title: {
        text: 'Income in the past seven days'
    },
    tooltip: {
        trigger: 'axis'
    },
    legend: {
        data:['Income in the past seven days']
    },
    grid: {
        left: '3%',
        right: '4%',
        bottom: '3%',
        containLabel: true
    },
    toolbox: {
        feature: {
            saveAsImage: {}
        }
    },
    xAxis: {
        type: 'category',
        boundaryGap: false,
        data: ["1","2","3","4","5"]
    },
    yAxis: {
        type: 'value'
    },
    series: [

        {
            name:'Income in the past seven days',
            type:'line',
            stack: 'total',
            data:["1","2","3","4","5"]
        }
    ]
              });
              // Load data asynchronously
            /*  $.get('data.json').done(function (data) {
                   // Fill in data
                   myChart.setOption({ xAxis: { data: data.categories }, series: [{
                        // Corresponding series according to name
                        name: 'Sales volume ',
                        data: data.data
                   }]
                   });});*/
          </script>
     </body>
</html>
Combined with json data:
As shown in the figure:
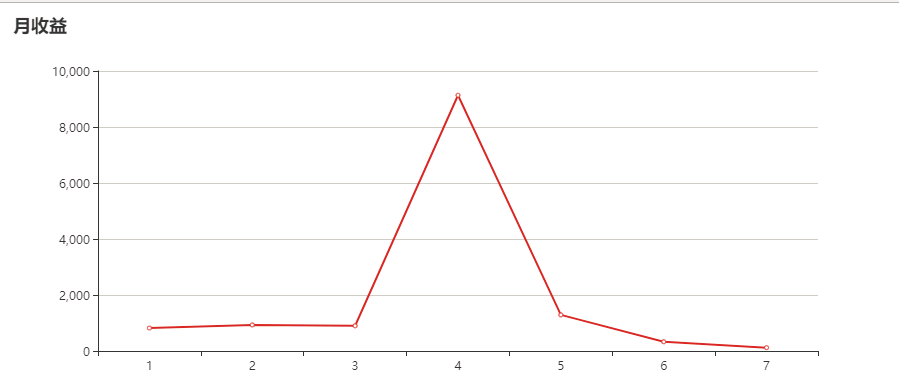
Picture.png
Implementation code:
<!DOCTYPE html>
<html>
    <head>
        <meta charset="UTF-8">
        <title></title>
        <script src="js/jquery-1.11.3.js"></script>
        <!-- Introduce echarts.js -->
        <script src="js/echarts.min.js"></script>
    </head>
    <body>
        <!-- by ECharts Prepare a Dom -->
        <div id="main" style="width: 900px;height:400px;"></div>

    </body>

    <!--Monthly income-->
    <script type="text/javascript">
        function bb() {
            // Initialize the echarts instance based on the prepared dom
            var myChart = echarts.init(document.getElementById('main'));
            $.get('data1.json').done(function(data) {
                myChart.setOption({
                    title: {
                        text: 'Monthly income'
                    },
                    tooltip: {},
                    //      legend: {
                    //          data: ['revenue']
                    //      },
                    xAxis: {
                        data: data.categories
                    },
                    yAxis: {},
                    series: [{
                        name: 'Profit',
                        type: 'line',
                        data: data.data
                    }]

                });
            });

        }
        bb();
    </script>

</html>
Data: data1.json file
{
    "categories": [

        "1",
        "2",
        "3",
        "4",
        "5",
         "6",
        "7",
        "8",
        "9",
        "10",
        "11",
        "12"
    ],
    "data": [
       820,
       932,
       901,
        9134,
         1290,
         330,
         120
    ]
}
End of article benefits:
Welfare 1: front end, Java, product manager, wechat applet, Python and other 10G resources are integrated and released: https://www.jianshu.com/p/e8197d4d9880
Benefit 2: a complete set of detailed video tutorials on the introduction and practice of wechat applets
image
Original author: miss qiche
Original link: https://www.jianshu.com/u/05f416aefbe1
It's not easy to create. Please let me know
Post-90s front-end girls, love programming, love operation, love tossing.
Insist on summarizing the technical problems encountered in the work and recording what you think and see in the work. Welcome to discuss and exchange together.