Generating time series synthetic data with random walk
Random walk is a random process. They consist of many steps in mathematical space. The most common random walk starts with a value of 0, and then each step adds or subtracts 1 with equal probability.
Random walk can be used to generate synthetic data for different machine learning applications. For example, when no information or real-time data is available, the synthetic data with random walk can approximate the actual data.
This paper uses one-dimensional random walk to generate data for time series algorithm.
Generate data
When creating and testing time series models, it is beneficial to benchmark the model with random data. Random walk can simulate the trend of inventory, capacity utilization and even particle movement.
By adjusting the probability of each step, the behavior is added to the random walk. In addition, these walks are modified to have different steps to produce larger or smaller fluctuations.
Use the "date_range" function in Pandas to quickly generate time series data. The following is an example that generates a df with a random value for each day in 2019.
import pandas as pd
import numpy as np
import matplotlib.pyplot as plt
import random
DATE_START = '2019-01-01'
DATE_END = '2019-12-31'
dates = pd.date_range(DATE_START, DATE_END)
df = pd.DataFrame({
    'date': dates,
    'value': np.random.normal(0,1,dates.size)
})
df.set_index('date', inplace=True)
plt.plot(df['value'])
plt.ylabel('Value')
plt.xlabel('Date')
plt.title('Random Values')
plt.show()

Random walk
Although the data here can be used for time series models, no patterns can be seen. Since the actual data contains an emergency mode relationship with previous points, the synthetic data needs to be improved. Random walk is a feasible solution to generate some realistic behavior. To create a random walk in Pandas, you need to traverse every row of df. Every step in the walk depends on the previous step.
The following is the code for generating random walk. The first "previous_value" is the starting point of the walk. Next, set the step size to 1. Finally, threshold sets the probability of walking in a positive or negative direction to 50%.
In addition, random walk is limited by minimum and maximum. For many data sets, such as stock values, these values are strictly positive numbers.
Random walk graphs are generated using 'matplotlib'.
def random_walk(
    df, start_value=0, threshold=0.5,
    step_size=1, min_value=-np.inf, max_value=np.inf
):
    previous_value = start_value
    for index, row in df.iterrows():
        if previous_value < min_value:
            previous_value = min_value
        if previous_value > max_value:
            previous_value = max_value
        probability = random.random()
        if probability >= threshold:
            df.loc[index, 'value'] = previous_value + step_size
        else:
            df.loc[index, 'value'] = previous_value - step_size
        previous_value = df.loc[index, 'value']
    return df

Modify random walk
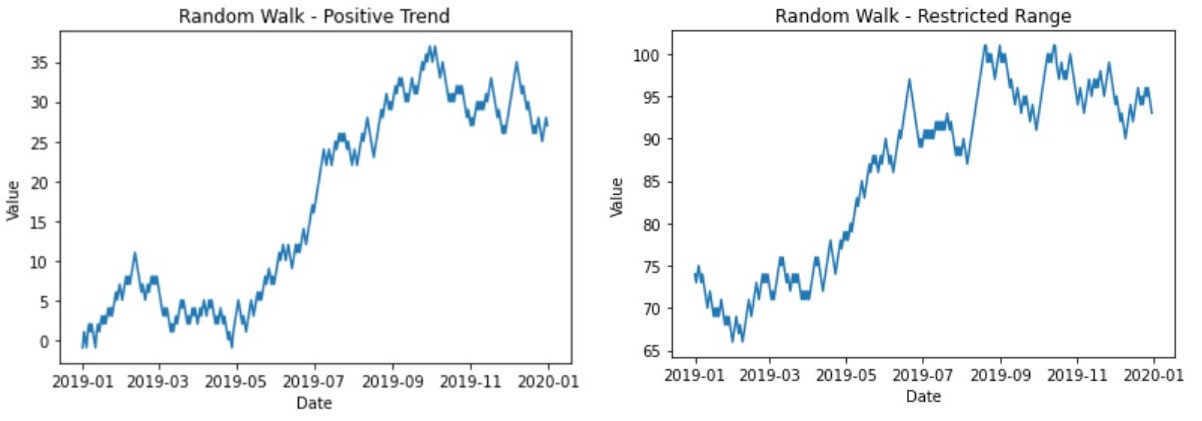
These random walks are adjusted to show the desired behavior. For example, add restrictions on the minimum and maximum values of random walks to simulate capacity utilization.
The behavior of random walk is further changed by changing other initial conditions, such as imposing an overall positive trend. The positive trend is achieved by adjusting the probability threshold. By increasing the probability of positive steps, random walk will produce a positive trend. For this code, it is achieved by lowering the threshold.
Setting random walk in this way can be closer to the stock trend. If the overall trend is positive or negative, details can be included in the composite data.
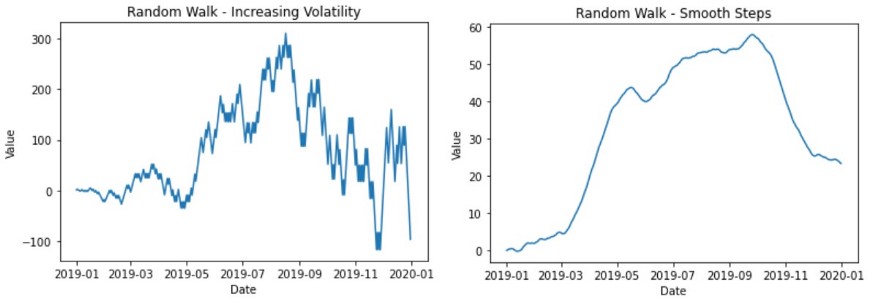
There are several options to further adjust the random walk. For example, including Gaussian noise at each step or increasing the step size to a larger value will cause different walks to span a larger space. However, there are other adjustments that lead to very different behavior.
- Increasing volatility over time is achieved by adding a small number of steps after each step. Therefore, the step size will gradually increase over time.
- Smooth walking can also be achieved by modifying the step size, but it can also be achieved by increasing the size after the positive step and reducing the size by a small value after the negative step.
summary
Random walk is an interesting random process. Many different patterns are generated under few starting conditions. Therefore, random walk can be used as synthetic time series data and adjusted for your specific problem instance.
Author: Zachary Warnes