Article catalog
- Getting started with SkyWalking
- background
- Install Elasticsearch and start
- Install SkyWalking and start
- Agent for configuring spring cloud microservices
- View the link call of spring cloud
- Single microservice call monitoring
- Call link monitoring between microservices
- All microservice call links
- Stop SkyWalking
- Stop Elasticsearch
- summary
Getting started with SkyWalking
background
In the actual production, in the face of dozens or even hundreds of microservice instances, if an instance goes down, if it can't locate and submit early warning quickly, the loss to the actual production is undoubtedly huge. Therefore, it is necessary to monitor and forewarn the microservice, monitor the call link of the microservice, and quickly locate the problem
Install Elasticsearch and start
- Installation command (the following command is Mac command, and yum command can be used under Linux. Under Windows, you can directly use yum command in Elasticsearch official website Download the installation package of the corresponding version.)
brew update
brew search elasticsearch
brew install elasticsearch
- Start elasticsearch
brew service start elasticsearch-full
- Check whether the startup is successful
visit localhost:9200 Is there any similar data returned as follows
{
  "name" : "******",
  "cluster_name" : "elasticsearch_name",
  "cluster_uuid" : "rp73VaY8RRCgQrl4M5uR9A",
  "version" : {
    "number" : "7.7.1",
    "build_flavor" : "default",
    "build_type" : "tar",
    "build_hash" : "ad56dce891c901a492bb1ee393f12dfff473a423",
    "build_date" : "2020-05-28T16:30:01.040088Z",
    "build_snapshot" : false,
    "lucene_version" : "8.5.1",
    "minimum_wire_compatibility_version" : "6.8.0",
    "minimum_index_compatibility_version" : "6.0.0-beta1"
  },
  "tagline" : "You Know, for Search"
}
If it doesn't return, go to the storage location of the log and check the error content in the log. If you don't know the storage location of the log, you can view it elasticsearch.yml In path.log The value of the parameter corresponds to the storage location of the log
Install SkyWalking and start
-
stay SkyWalking official website Download the corresponding version. Here you download the Binary Distribution for ElasticSearch 7 version, because the Elasticsearch version installed above is 7
-
Unzip and modify the configuration
2.1 decompress the compressed package
tar -zxvf apache-skywalking-apm-es7-7.0.0.tar.gz2.2 enter the unzipped folder and modify / config/application.yml to configure
# Licensed to the Apache Software Foundation (ASF) under one
# or more contributor license agreements.  See the NOTICE file
# distributed with this work for additional information
# regarding copyright ownership.  The ASF licenses this file
# to you under the Apache License, Version 2.0 (the
# "License"); you may not use this file except in compliance
# with the License.  You may obtain a copy of the License at
#
#     http://www.apache.org/licenses/LICENSE-2.0
#
# Unless required by applicable law or agreed to in writing, software
# distributed under the License is distributed on an "AS IS" BASIS,
# WITHOUT WARRANTIES OR CONDITIONS OF ANY KIND, either express or implied.
# See the License for the specific language governing permissions and
# limitations under the License.

cluster:
  selector: ${SW_CLUSTER:standalone}
  standalone:
  # Please check your ZooKeeper is 3.5+, However, it is also compatible with ZooKeeper 3.4.x. Replace the ZooKeeper 3.5+
  # library the oap-libs folder with your ZooKeeper 3.4.x library.
  zookeeper:
    nameSpace: ${SW_NAMESPACE:""}
    hostPort: ${SW_CLUSTER_ZK_HOST_PORT:localhost:2181}
    # Retry Policy
    baseSleepTimeMs: ${SW_CLUSTER_ZK_SLEEP_TIME:1000} # initial amount of time to wait between retries
    maxRetries: ${SW_CLUSTER_ZK_MAX_RETRIES:3} # max number of times to retry
    # Enable ACL
    enableACL: ${SW_ZK_ENABLE_ACL:false} # disable ACL in default
    schema: ${SW_ZK_SCHEMA:digest} # only support digest schema
    expression: ${SW_ZK_EXPRESSION:skywalking:skywalking}
  kubernetes:
    watchTimeoutSeconds: ${SW_CLUSTER_K8S_WATCH_TIMEOUT:60}
    namespace: ${SW_CLUSTER_K8S_NAMESPACE:default}
    labelSelector: ${SW_CLUSTER_K8S_LABEL:app=collector,release=skywalking}
    uidEnvName: ${SW_CLUSTER_K8S_UID:SKYWALKING_COLLECTOR_UID}
  consul:
    serviceName: ${SW_SERVICE_NAME:"SkyWalking_OAP_Cluster"}
    # Consul cluster nodes, example: 10.0.0.1:8500,10.0.0.2:8500,10.0.0.3:8500
    hostPort: ${SW_CLUSTER_CONSUL_HOST_PORT:localhost:8500}
    aclToken: ${SW_CLUSTER_CONSUL_ACLTOKEN:""}
  nacos:
    serviceName: ${SW_SERVICE_NAME:"SkyWalking_OAP_Cluster"}
    hostPort: ${SW_CLUSTER_NACOS_HOST_PORT:localhost:8848}
    # Nacos Configuration namespace
    namespace: ${SW_CLUSTER_NACOS_NAMESPACE:"public"}
  etcd:
    serviceName: ${SW_SERVICE_NAME:"SkyWalking_OAP_Cluster"}
    # etcd cluster nodes, example: 10.0.0.1:2379,10.0.0.2:2379,10.0.0.3:2379
    hostPort: ${SW_CLUSTER_ETCD_HOST_PORT:localhost:2379}

core:
  selector: ${SW_CORE:default}
  default:
    # Mixed: Receive agent data, Level 1 aggregate, Level 2 aggregate
    # Receiver: Receive agent data, Level 1 aggregate
    # Aggregator: Level 2 aggregate
    role: ${SW_CORE_ROLE:Mixed} # Mixed/Receiver/Aggregator
    restHost: ${SW_CORE_REST_HOST:0.0.0.0}
    restPort: ${SW_CORE_REST_PORT:12800}
    restContextPath: ${SW_CORE_REST_CONTEXT_PATH:/}
    gRPCHost: ${SW_CORE_GRPC_HOST:0.0.0.0}
    gRPCPort: ${SW_CORE_GRPC_PORT:11800}
    gRPCSslEnabled: ${SW_CORE_GRPC_SSL_ENABLED:false}
    gRPCSslKeyPath: ${SW_CORE_GRPC_SSL_KEY_PATH:""}
    gRPCSslCertChainPath: ${SW_CORE_GRPC_SSL_CERT_CHAIN_PATH:""}
    gRPCSslTrustedCAPath: ${SW_CORE_GRPC_SSL_TRUSTED_CA_PATH:""}
    downsampling:
      - Hour
      - Day
      - Month
    # Set a timeout on metrics data. After the timeout has expired, the metrics data will automatically be deleted.
    enableDataKeeperExecutor: ${SW_CORE_ENABLE_DATA_KEEPER_EXECUTOR:true} # Turn it off then automatically metrics data delete will be close.
    dataKeeperExecutePeriod: ${SW_CORE_DATA_KEEPER_EXECUTE_PERIOD:5} # How often the data keeper executor runs periodically, unit is minute
    recordDataTTL: ${SW_CORE_RECORD_DATA_TTL:90} # Unit is minute
    minuteMetricsDataTTL: ${SW_CORE_MINUTE_METRIC_DATA_TTL:90} # Unit is minute
    hourMetricsDataTTL: ${SW_CORE_HOUR_METRIC_DATA_TTL:36} # Unit is hour
    dayMetricsDataTTL: ${SW_CORE_DAY_METRIC_DATA_TTL:45} # Unit is day
    monthMetricsDataTTL: ${SW_CORE_MONTH_METRIC_DATA_TTL:18} # Unit is month
    # Cache metric data for 1 minute to reduce database queries, and if the OAP cluster changes within that minute,
    # the metrics may not be accurate within that minute.
    enableDatabaseSession: ${SW_CORE_ENABLE_DATABASE_SESSION:true}
    topNReportPeriod: ${SW_CORE_TOPN_REPORT_PERIOD:10} # top_n record worker report cycle, unit is minute
    # Extra model column are the column defined by in the codes, These columns of model are not required logically in aggregation or further query,
    # and it will cause more load for memory, network of OAP and storage.
    # But, being activated, user could see the name in the storage entities, which make users easier to use 3rd party tool, such as Kibana->ES, to query the data by themselves.
    activeExtraModelColumns: ${SW_CORE_ACTIVE_EXTRA_MODEL_COLUMNS:false}

storage:
  selector: ${SW_STORAGE:elasticsearch7}
  # elasticsearch:
  #   nameSpace: ${SW_NAMESPACE:""}
  #   clusterNodes: ${SW_STORAGE_ES_CLUSTER_NODES:localhost:9200}
  #   protocol: ${SW_STORAGE_ES_HTTP_PROTOCOL:"http"}
  #   trustStorePath: ${SW_SW_STORAGE_ES_SSL_JKS_PATH:"../es_keystore.jks"}
  #   trustStorePass: ${SW_SW_STORAGE_ES_SSL_JKS_PASS:""}
  #   user: ${SW_ES_USER:""}
  #   password: ${SW_ES_PASSWORD:""}
  #   secretsManagementFile: ${SW_ES_SECRETS_MANAGEMENT_FILE:""} # Secrets management file in the properties format includes the username, password, which are managed by 3rd party tool.
  #   enablePackedDownsampling: ${SW_STORAGE_ENABLE_PACKED_DOWNSAMPLING:true} # Hour and Day metrics will be merged into minute index.
  #   dayStep: ${SW_STORAGE_DAY_STEP:1} # Represent the number of days in the one minute/hour/day index.
  #   indexShardsNumber: ${SW_STORAGE_ES_INDEX_SHARDS_NUMBER:2}
  #   indexReplicasNumber: ${SW_STORAGE_ES_INDEX_REPLICAS_NUMBER:0}
  #   # Those data TTL settings will override the same settings in core module.
  #   recordDataTTL: ${SW_STORAGE_ES_RECORD_DATA_TTL:7} # Unit is day
  #   otherMetricsDataTTL: ${SW_STORAGE_ES_OTHER_METRIC_DATA_TTL:45} # Unit is day
  #   monthMetricsDataTTL: ${SW_STORAGE_ES_MONTH_METRIC_DATA_TTL:18} # Unit is month
  #   # Batch process setting, refer to https://www.elastic.co/guide/en/elasticsearch/client/java-api/5.5/java-docs-bulk-processor.html
  #   bulkActions: ${SW_STORAGE_ES_BULK_ACTIONS:1000} # Execute the bulk every 1000 requests
  #   flushInterval: ${SW_STORAGE_ES_FLUSH_INTERVAL:10} # flush the bulk every 10 seconds whatever the number of requests
  #   concurrentRequests: ${SW_STORAGE_ES_CONCURRENT_REQUESTS:2} # the number of concurrent requests
  #   resultWindowMaxSize: ${SW_STORAGE_ES_QUERY_MAX_WINDOW_SIZE:10000}
  #   metadataQueryMaxSize: ${SW_STORAGE_ES_QUERY_MAX_SIZE:5000}
  #   segmentQueryMaxSize: ${SW_STORAGE_ES_QUERY_SEGMENT_SIZE:200}
  #   profileTaskQueryMaxSize: ${SW_STORAGE_ES_QUERY_PROFILE_TASK_SIZE:200}
  #   advanced: ${SW_STORAGE_ES_ADVANCED:""}
  elasticsearch7:
    nameSpace: ${SW_NAMESPACE:"elasticsearch7"}
    clusterNodes: ${SW_STORAGE_ES_CLUSTER_NODES:localhost:9200}
    protocol: ${SW_STORAGE_ES_HTTP_PROTOCOL:"http"}
    # trustStorePath: ${SW_SW_STORAGE_ES_SSL_JKS_PATH:"../es_keystore.jks"}
    # trustStorePass: ${SW_SW_STORAGE_ES_SSL_JKS_PASS:""}
    enablePackedDownsampling: ${SW_STORAGE_ENABLE_PACKED_DOWNSAMPLING:true} # Hour and Day metrics will be merged into minute index.
    dayStep: ${SW_STORAGE_DAY_STEP:1} # Represent the number of days in the one minute/hour/day index.
    user: ${SW_ES_USER:""}
    password: ${SW_ES_PASSWORD:""}
    secretsManagementFile: ${SW_ES_SECRETS_MANAGEMENT_FILE:""} # Secrets management file in the properties format includes the username, password, which are managed by 3rd party tool.
    indexShardsNumber: ${SW_STORAGE_ES_INDEX_SHARDS_NUMBER:2}
    indexReplicasNumber: ${SW_STORAGE_ES_INDEX_REPLICAS_NUMBER:0}
    # Those data TTL settings will override the same settings in core module.
    recordDataTTL: ${SW_STORAGE_ES_RECORD_DATA_TTL:7} # Unit is day
    otherMetricsDataTTL: ${SW_STORAGE_ES_OTHER_METRIC_DATA_TTL:45} # Unit is day
    monthMetricsDataTTL: ${SW_STORAGE_ES_MONTH_METRIC_DATA_TTL:18} # Unit is month
    # Batch process setting, refer to https://www.elastic.co/guide/en/elasticsearch/client/java-api/5.5/java-docs-bulk-processor.html
    bulkActions: ${SW_STORAGE_ES_BULK_ACTIONS:1000} # Execute the bulk every 1000 requests
    flushInterval: ${SW_STORAGE_ES_FLUSH_INTERVAL:10} # flush the bulk every 10 seconds whatever the number of requests
    concurrentRequests: ${SW_STORAGE_ES_CONCURRENT_REQUESTS:2} # the number of concurrent requests
    resultWindowMaxSize: ${SW_STORAGE_ES_QUERY_MAX_WINDOW_SIZE:10000}
    metadataQueryMaxSize: ${SW_STORAGE_ES_QUERY_MAX_SIZE:5000}
    segmentQueryMaxSize: ${SW_STORAGE_ES_QUERY_SEGMENT_SIZE:200}
    profileTaskQueryMaxSize: ${SW_STORAGE_ES_QUERY_PROFILE_TASK_SIZE:200}
    advanced: ${SW_STORAGE_ES_ADVANCED:""}
  # h2:
  #   driver: ${SW_STORAGE_H2_DRIVER:org.h2.jdbcx.JdbcDataSource}
  #   url: ${SW_STORAGE_H2_URL:jdbc:h2:mem:skywalking-oap-db}
  #   user: ${SW_STORAGE_H2_USER:sa}
  #   metadataQueryMaxSize: ${SW_STORAGE_H2_QUERY_MAX_SIZE:5000}
  # mysql:
  #   properties:
  #     jdbcUrl: ${SW_JDBC_URL:"jdbc:mysql://localhost:3306/swtest"}
  #     dataSource.user: ${SW_DATA_SOURCE_USER:root}
  #     dataSource.password: ${SW_DATA_SOURCE_PASSWORD:root@1234}
  #     dataSource.cachePrepStmts: ${SW_DATA_SOURCE_CACHE_PREP_STMTS:true}
  #     dataSource.prepStmtCacheSize: ${SW_DATA_SOURCE_PREP_STMT_CACHE_SQL_SIZE:250}
  #     dataSource.prepStmtCacheSqlLimit: ${SW_DATA_SOURCE_PREP_STMT_CACHE_SQL_LIMIT:2048}
  #     dataSource.useServerPrepStmts: ${SW_DATA_SOURCE_USE_SERVER_PREP_STMTS:true}
  #   metadataQueryMaxSize: ${SW_STORAGE_MYSQL_QUERY_MAX_SIZE:5000}
  # influxdb:
  #   # Metadata storage provider configuration
  #   metabaseType: ${SW_STORAGE_METABASE_TYPE:H2} # There are 2 options as Metabase provider, H2 or MySQL.
  #   h2Props:
  #     dataSourceClassName: ${SW_STORAGE_METABASE_DRIVER:org.h2.jdbcx.JdbcDataSource}
  #     dataSource.url: ${SW_STORAGE_METABASE_URL:jdbc:h2:mem:skywalking-oap-db}
  #     dataSource.user: ${SW_STORAGE_METABASE_USER:sa}
  #     dataSource.password: ${SW_STORAGE_METABASE_PASSWORD:}
  #   mysqlProps:
  #     jdbcUrl: ${SW_STORAGE_METABASE_URL:"jdbc:mysql://localhost:3306/swtest"}
  #     dataSource.user: ${SW_STORAGE_METABASE_USER:root}
  #     dataSource.password: ${SW_STORAGE_METABASE_PASSWORD:root@1234}
  #     dataSource.cachePrepStmts: ${SW_STORAGE_METABASE_CACHE_PREP_STMTS:true}
  #     dataSource.prepStmtCacheSize: ${SW_STORAGE_METABASE_PREP_STMT_CACHE_SQL_SIZE:250}
  #     dataSource.prepStmtCacheSqlLimit: ${SW_STORAGE_METABASE_PREP_STMT_CACHE_SQL_LIMIT:2048}
  #     dataSource.useServerPrepStmts: ${SW_STORAGE_METABASE_USE_SERVER_PREP_STMTS:true}
  #   metadataQueryMaxSize: ${SW_STORAGE_METABASE_QUERY_MAX_SIZE:5000}
  #   # InfluxDB configuration
  #   url: ${SW_STORAGE_INFLUXDB_URL:http://localhost:8086}
  #   user: ${SW_STORAGE_INFLUXDB_USER:root}
  #   password: ${SW_STORAGE_INFLUXDB_PASSWORD:}
  #   database: ${SW_STORAGE_INFLUXDB_DATABASE:skywalking}
  #   actions: ${SW_STORAGE_INFLUXDB_ACTIONS:1000} # the number of actions to collect
  #   duration: ${SW_STORAGE_INFLUXDB_DURATION:1000} # the time to wait at most (milliseconds)
  #   fetchTaskLogMaxSize: ${SW_STORAGE_INFLUXDB_FETCH_TASK_LOG_MAX_SIZE:5000} # the max number of fetch task log in a request

receiver-sharing-server:
  selector: ${SW_RECEIVER_SHARING_SERVER:default}
  default:
    authentication: ${SW_AUTHENTICATION:""}
receiver-register:
  selector: ${SW_RECEIVER_REGISTER:default}
  default:

receiver-trace:
  selector: ${SW_RECEIVER_TRACE:default}
  default:
    bufferPath: ${SW_RECEIVER_BUFFER_PATH:../trace-buffer/}  # Path to trace buffer files, suggest to use absolute path
    bufferOffsetMaxFileSize: ${SW_RECEIVER_BUFFER_OFFSET_MAX_FILE_SIZE:100} # Unit is MB
    bufferDataMaxFileSize: ${SW_RECEIVER_BUFFER_DATA_MAX_FILE_SIZE:500} # Unit is MB
    bufferFileCleanWhenRestart: ${SW_RECEIVER_BUFFER_FILE_CLEAN_WHEN_RESTART:false}
    sampleRate: ${SW_TRACE_SAMPLE_RATE:10000} # The sample rate precision is 1/10000. 10000 means 100% sample in default.
    slowDBAccessThreshold: ${SW_SLOW_DB_THRESHOLD:default:200,mongodb:100} # The slow database access thresholds. Unit ms.

receiver-jvm:
  selector: ${SW_RECEIVER_JVM:default}
  default:

receiver-clr:
  selector: ${SW_RECEIVER_CLR:default}
  default:

receiver-profile:
  selector: ${SW_RECEIVER_PROFILE:default}
  default:

service-mesh:
  selector: ${SW_SERVICE_MESH:default}
  default:
    bufferPath: ${SW_SERVICE_MESH_BUFFER_PATH:../mesh-buffer/}  # Path to trace buffer files, suggest to use absolute path
    bufferOffsetMaxFileSize: ${SW_SERVICE_MESH_OFFSET_MAX_FILE_SIZE:100} # Unit is MB
    bufferDataMaxFileSize: ${SW_SERVICE_MESH_BUFFER_DATA_MAX_FILE_SIZE:500} # Unit is MB
    bufferFileCleanWhenRestart: ${SW_SERVICE_MESH_BUFFER_FILE_CLEAN_WHEN_RESTART:false}

istio-telemetry:
  selector: ${SW_ISTIO_TELEMETRY:default}
  default:

envoy-metric:
  selector: ${SW_ENVOY_METRIC:default}
  default:
    alsHTTPAnalysis: ${SW_ENVOY_METRIC_ALS_HTTP_ANALYSIS:""}

receiver_zipkin:
  selector: ${SW_RECEIVER_ZIPKIN:-}
  default:
    host: ${SW_RECEIVER_ZIPKIN_HOST:0.0.0.0}
    port: ${SW_RECEIVER_ZIPKIN_PORT:9411}
    contextPath: ${SW_RECEIVER_ZIPKIN_CONTEXT_PATH:/}

receiver_jaeger:
  selector: ${SW_RECEIVER_JAEGER:-}
  default:
    gRPCHost: ${SW_RECEIVER_JAEGER_HOST:0.0.0.0}
    gRPCPort: ${SW_RECEIVER_JAEGER_PORT:14250}

query:
  selector: ${SW_QUERY:graphql}
  graphql:
    path: ${SW_QUERY_GRAPHQL_PATH:/graphql}

alarm:
  selector: ${SW_ALARM:default}
  default:

telemetry:
  selector: ${SW_TELEMETRY:none}
  none:
  prometheus:
    host: ${SW_TELEMETRY_PROMETHEUS_HOST:0.0.0.0}
    port: ${SW_TELEMETRY_PROMETHEUS_PORT:1234}
  so11y:
    prometheusExporterEnabled: ${SW_TELEMETRY_SO11Y_PROMETHEUS_ENABLED:true}
    prometheusExporterHost: ${SW_TELEMETRY_PROMETHEUS_HOST:0.0.0.0}
    prometheusExporterPort: ${SW_TELEMETRY_PROMETHEUS_PORT:1234}

receiver-so11y:
  selector: ${SW_RECEIVER_SO11Y:-}
  default:

configuration:
  selector: ${SW_CONFIGURATION:none}
  none:
  apollo:
    apolloMeta: http://106.12.25.204:8080
    apolloCluster: default
    apolloEnv: ""
    appId: skywalking
    period: 5
  nacos:
    # Nacos Server Host
    serverAddr: 127.0.0.1
    # Nacos Server Port
    port: 8848
    # Nacos Configuration Group
    group: 'skywalking'
    # Nacos Configuration namespace
    namespace: ''
    # Unit seconds, sync period. Default fetch every 60 seconds.
    period : 60
    # the name of current cluster, set the name if you want to upstream system known.
    clusterName: "default"
  zookeeper:
    period : 60 # Unit seconds, sync period. Default fetch every 60 seconds.
    nameSpace: /default
    hostPort: localhost:2181
    # Retry Policy
    baseSleepTimeMs: 1000 # initial amount of time to wait between retries
    maxRetries: 3 # max number of times to retry
  etcd:
    period : 60 # Unit seconds, sync period. Default fetch every 60 seconds.
    group :  'skywalking'
    serverAddr: localhost:2379
    clusterName: "default"
  consul:
    # Consul host and ports, separated by comma, e.g. 1.2.3.4:8500,2.3.4.5:8500
    hostAndPorts: ${consul.address}
    # Sync period in seconds. Defaults to 60 seconds.
    period: 1
    # Consul aclToken
    #aclToken: ${consul.aclToken}

exporter:
  selector: ${SW_EXPORTER:-}
  grpc:
    targetHost: ${SW_EXPORTER_GRPC_HOST:127.0.0.1}
    targetPort: ${SW_EXPORTER_GRPC_PORT:9870}
Configuration Description:
cluster: there are several registration centers to choose from. The default is standalone
core: default configuration
Storage: it is used to store trace data for query and display. It provides H2, Mysql, ES, and InfluxDB storage methods. recordDataTTL is how long data is stored. The default is 7 days
Here, select es7 to comment out other storage methods. Then select elastic search 7 in the selector option of the storage
-
Launch OAP and SkyWalkingUI
cd bin
# Start OAP
oapService.sh
# Launch SkyWalking UI
webappService.sh
After startup, as shown in the figure
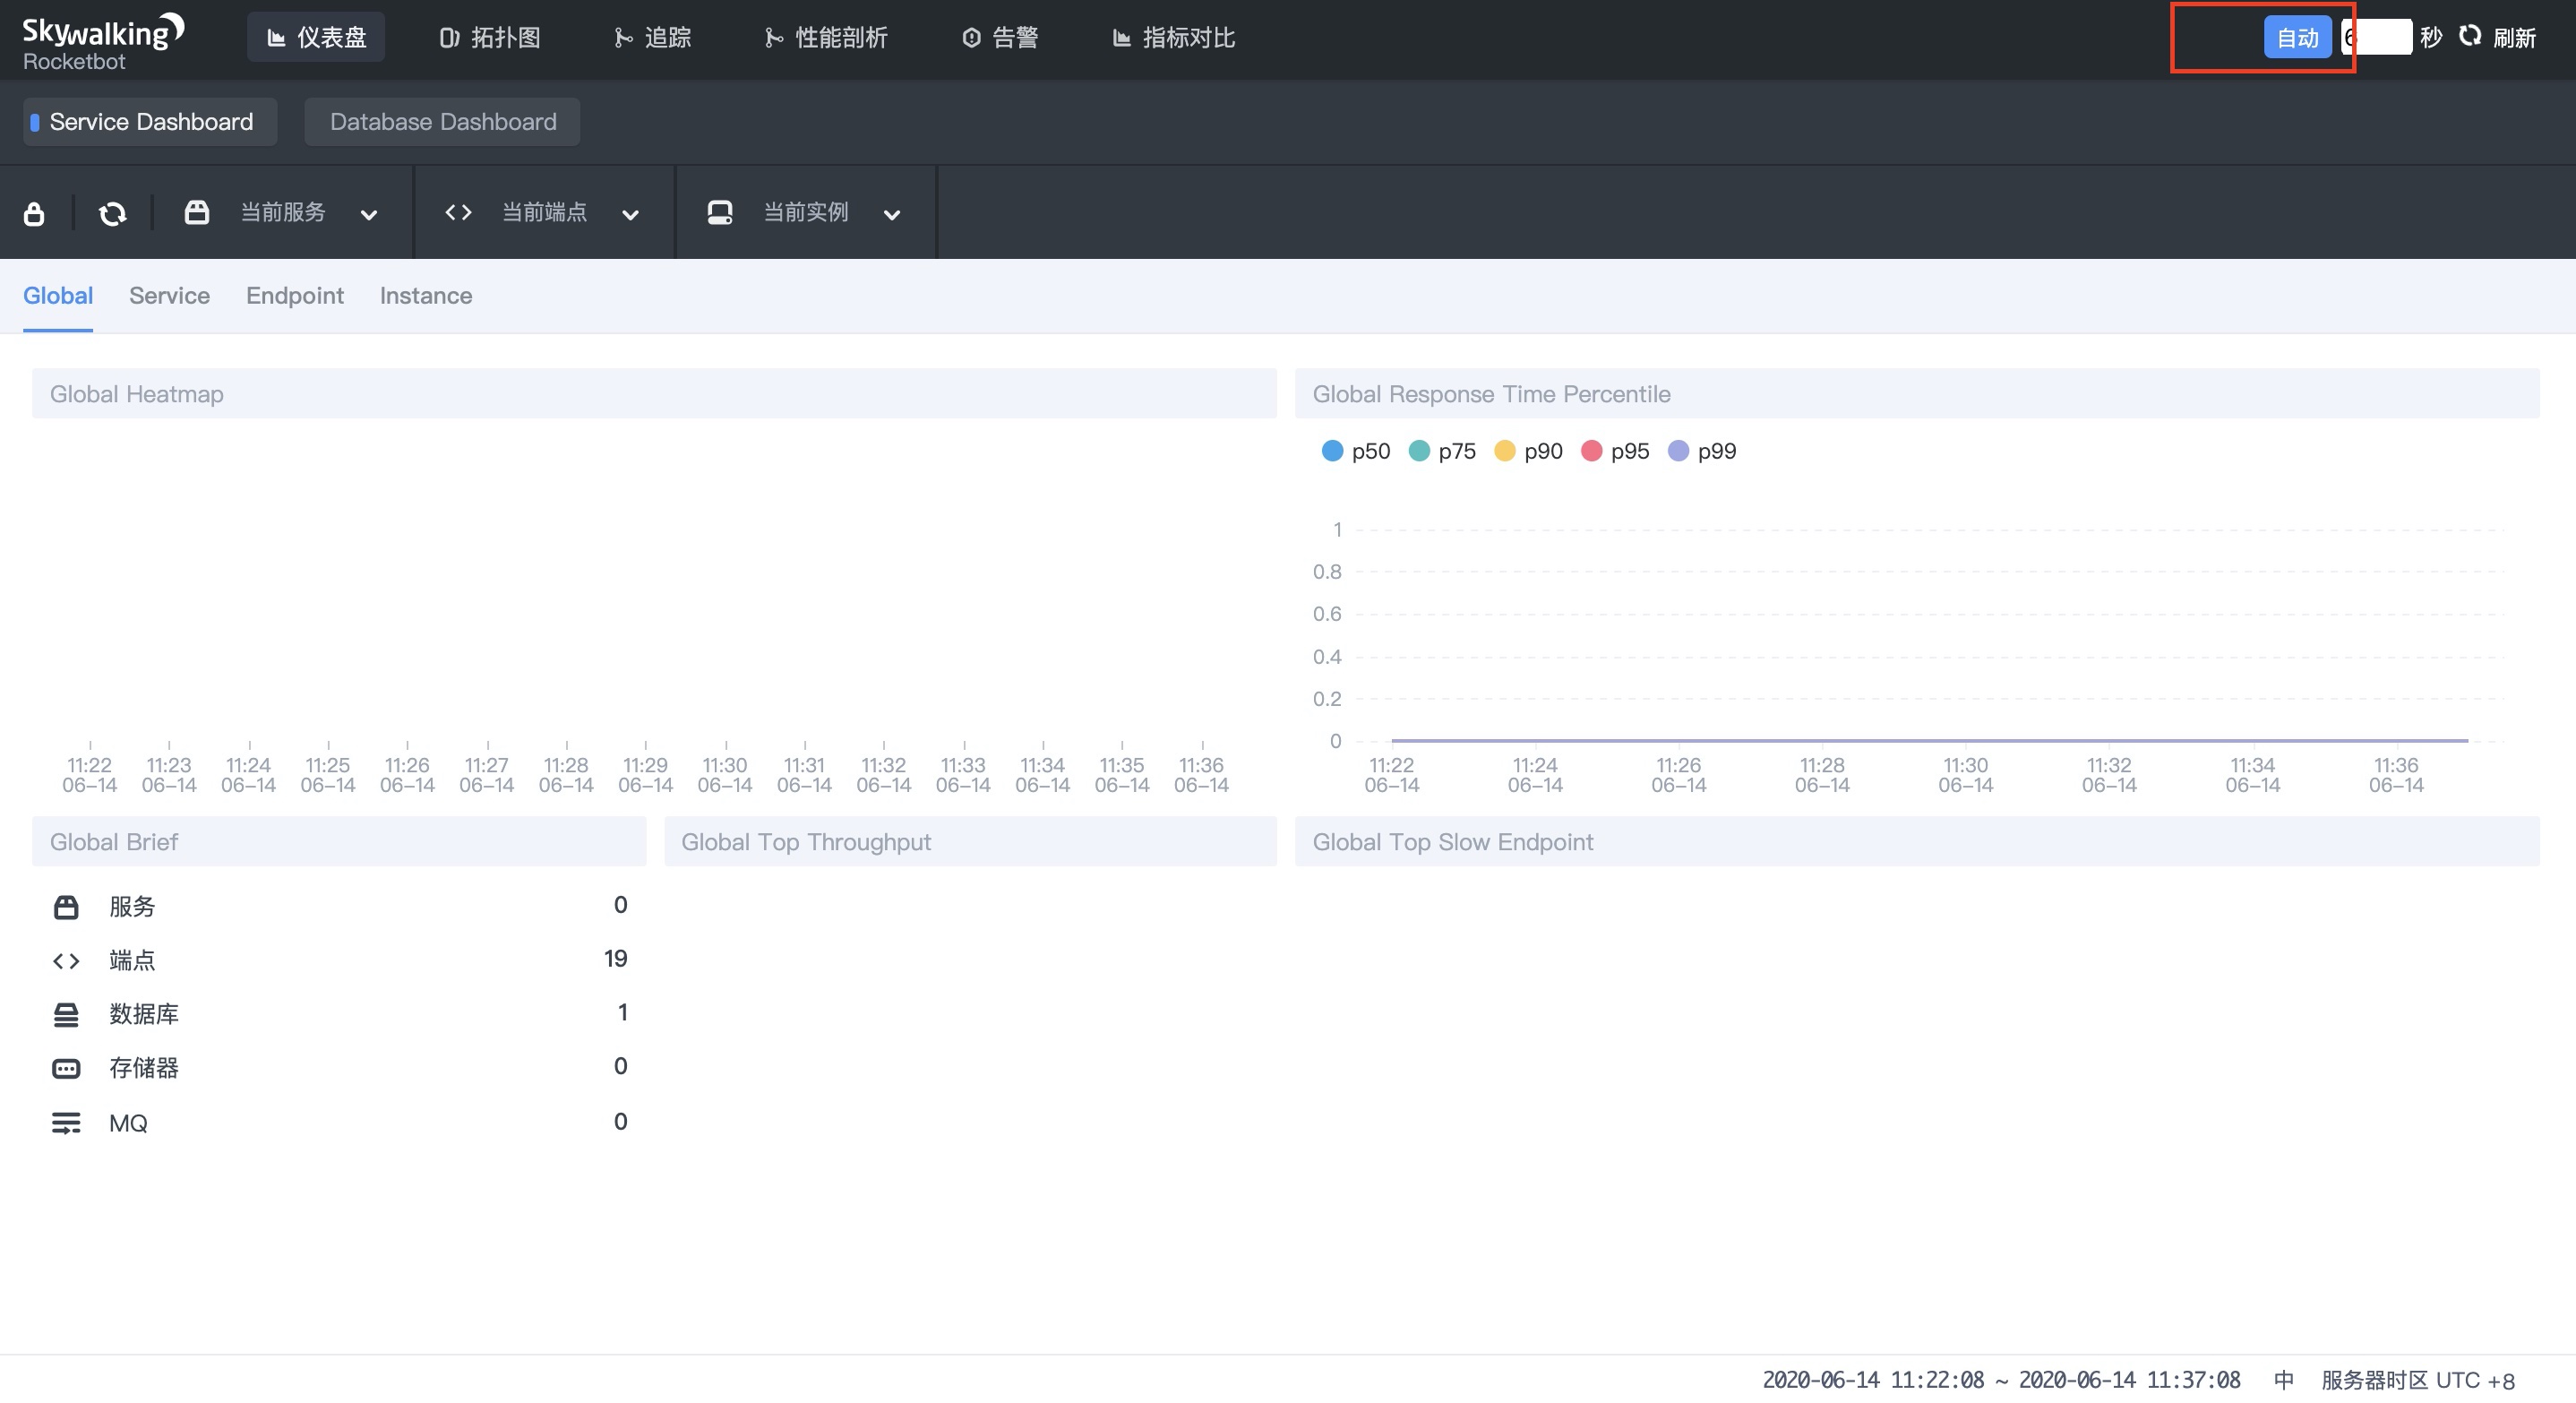
Remember to turn on the Auto button and configure the start filtering time below. Skywalking will refresh the collected data every 6 seconds
Agent for configuring spring cloud microservices
-
Taking Eureka registry as an example, this paper demonstrates how to configure agent.
1.1 add the following configuration in VM options of Run/Debug Configurations in idea
# -After Java agent is skywalking-agent.jar Path to
-javaagent:/Users/jacksparrow414/skywalking/apache-skywalking-apm-bin-es7/agent/skywalking-agent.jar
1.2 add two lines of configuration in environment environment
SW_AGENT_NAME=eureka;SW_AGENT_COLLECTOR_BACKEND_SERVICES=127.0.0.1:11800
SW_AGENT_NAME corresponds to the name of the service, which can be taken arbitrarily. The name of different instances of the same service is the same
1.3 for similar configurations, configure gateway (Gateway), one service (service 1, corresponding to two instances DemoClientone, DemoClientthree), and two service (service 2). Both service 1 and service 2 are connected to the local 3306 database. There are 5 applications in total, which are launched successively:
Registry - > Gateway - > Service 1 (two instances) - > service 2
Restart nginx
Why start nginx?
The actual access link is:
web browser / App/H5 applet - > initiate request - > nginx reverse proxy - > forward request to gateway - > gateway according to interface path - > route to different microservice instances
1.4 judge whether the agent is effective. When each application is started, the console will print first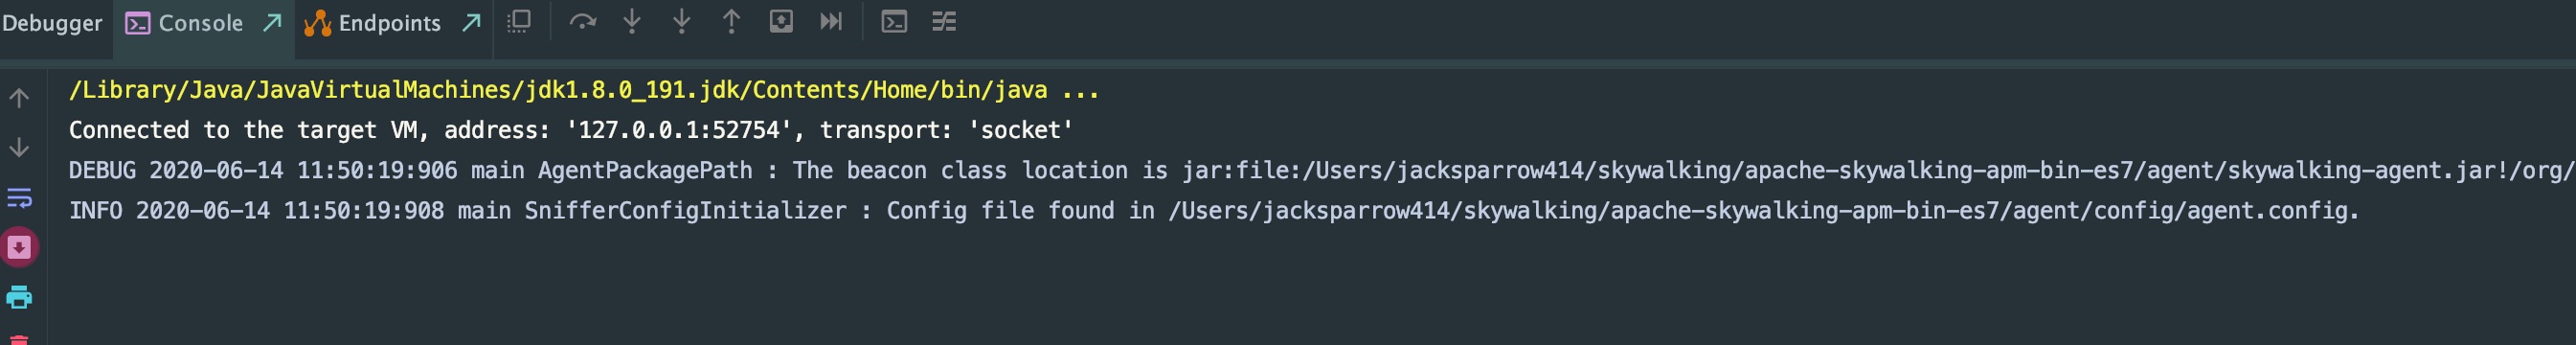
1.5 wait a moment, you will find out in Skywalking UI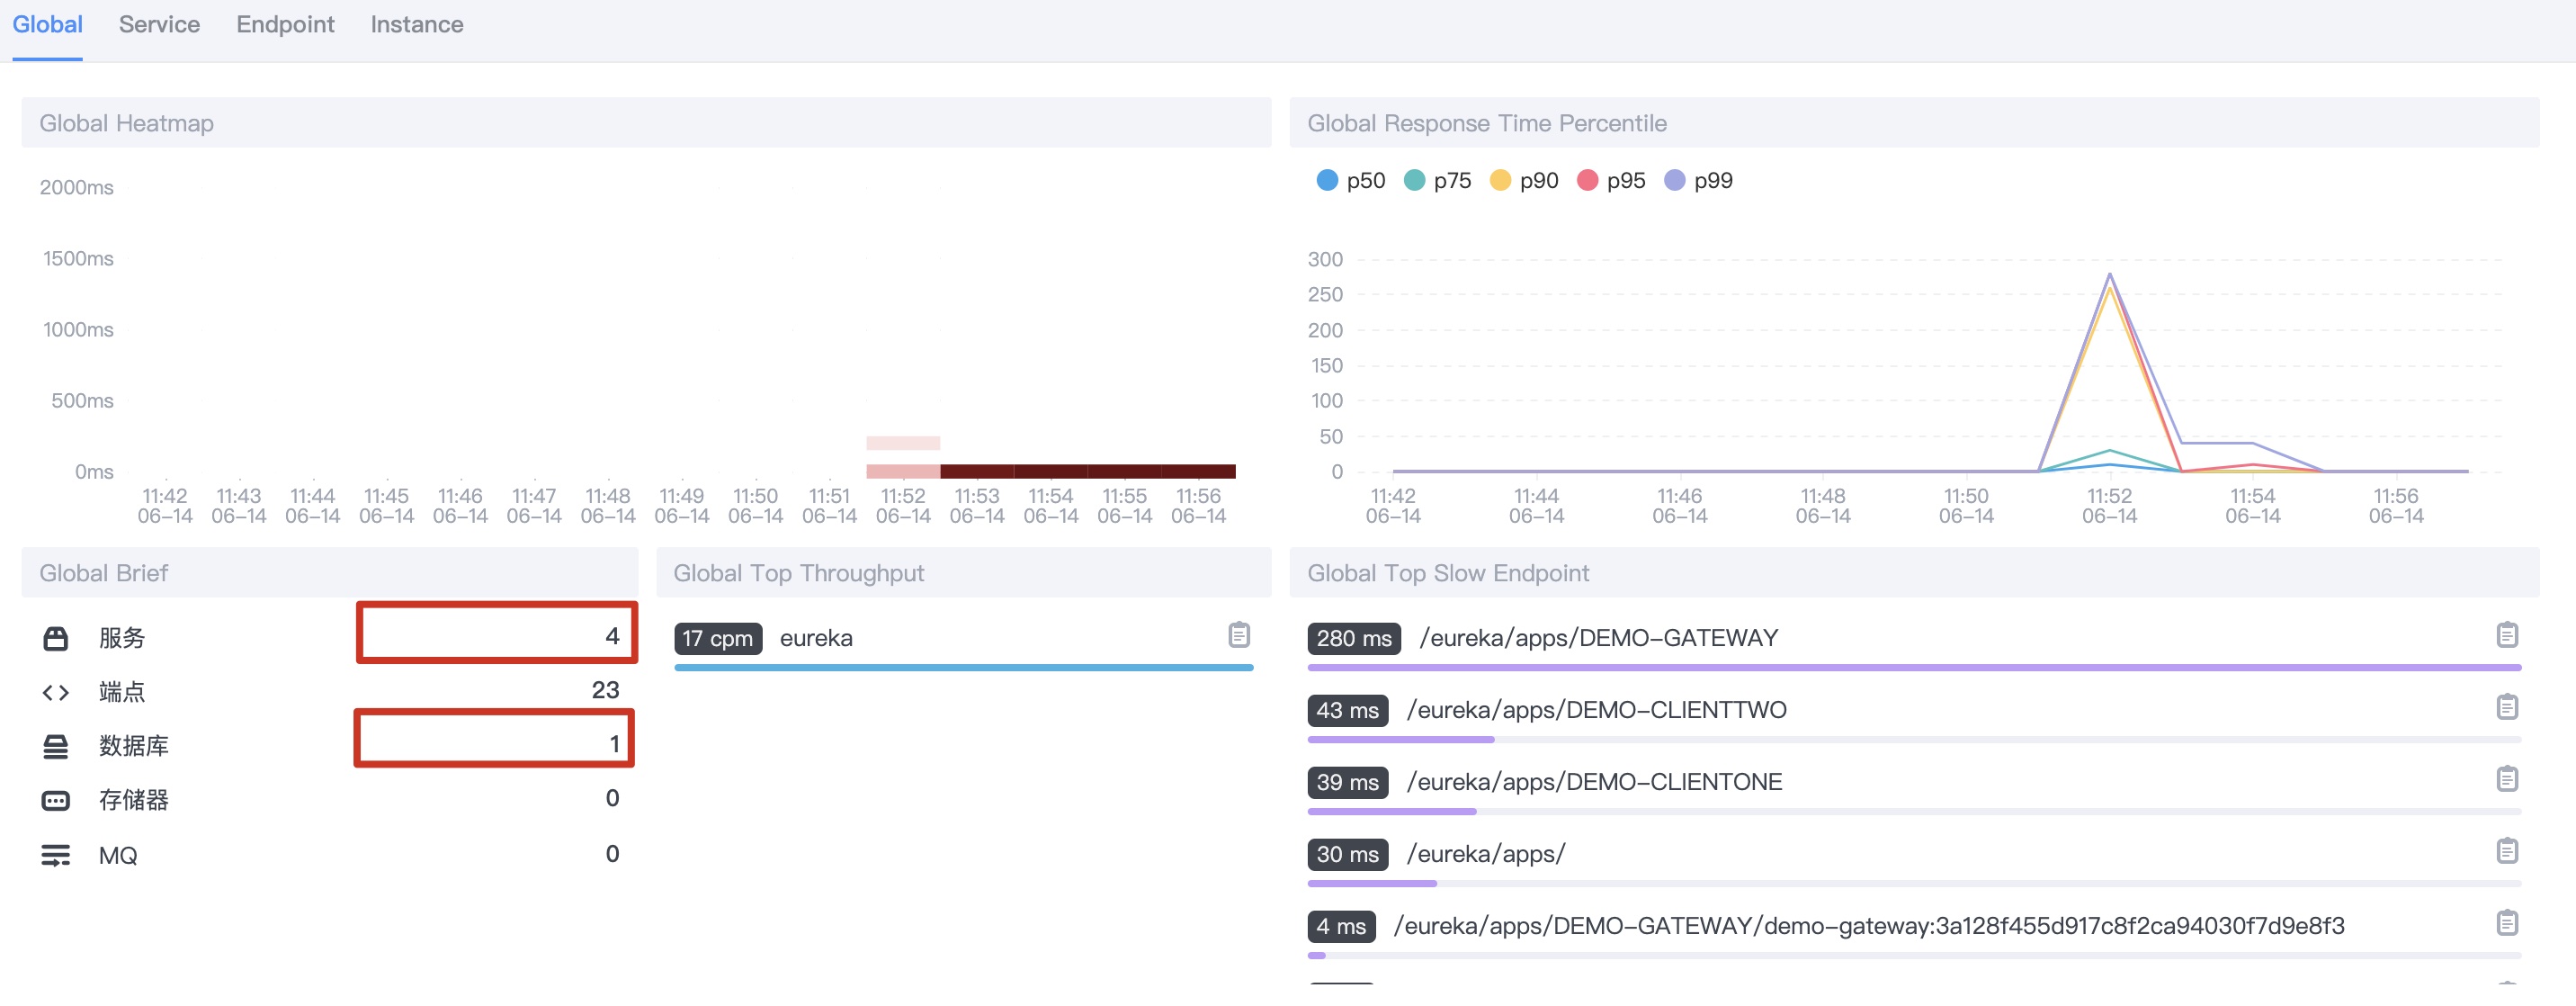
As you can see, there are four applications and one database, which are right
View the link call of spring cloud
Single microservice call monitoring
- Request an instance of one service, the interface of DemoClientone, addSwUser interface, and insert a piece of data.
You can see the following information in the console later
1.1 dashboard - select one service, as shown below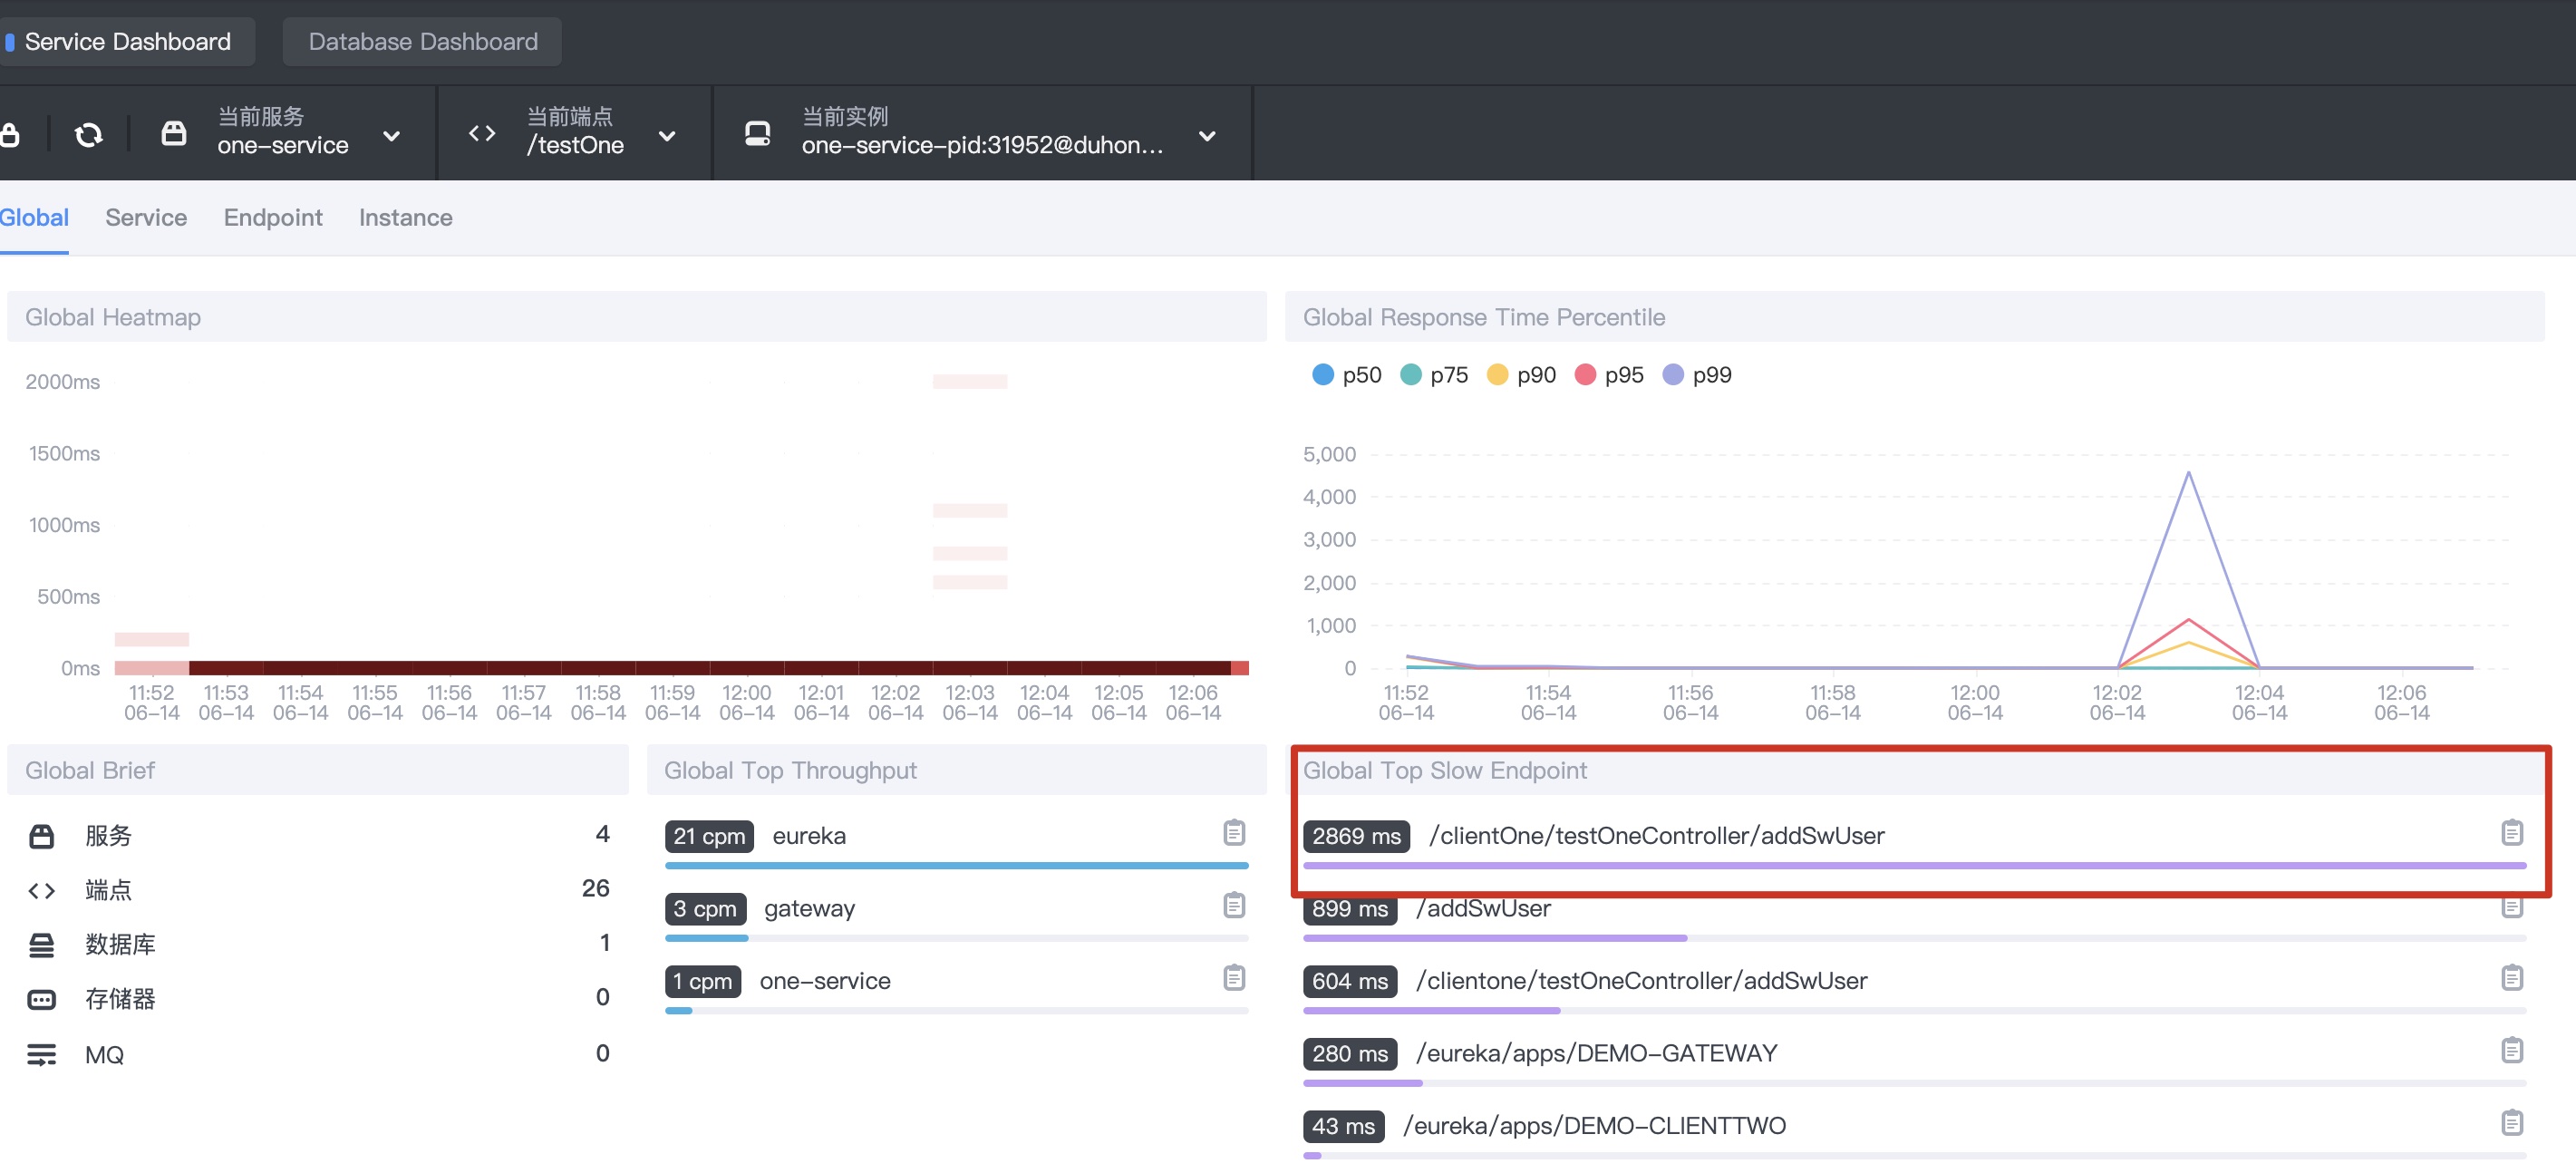
1.2 topology - select one service, as shown below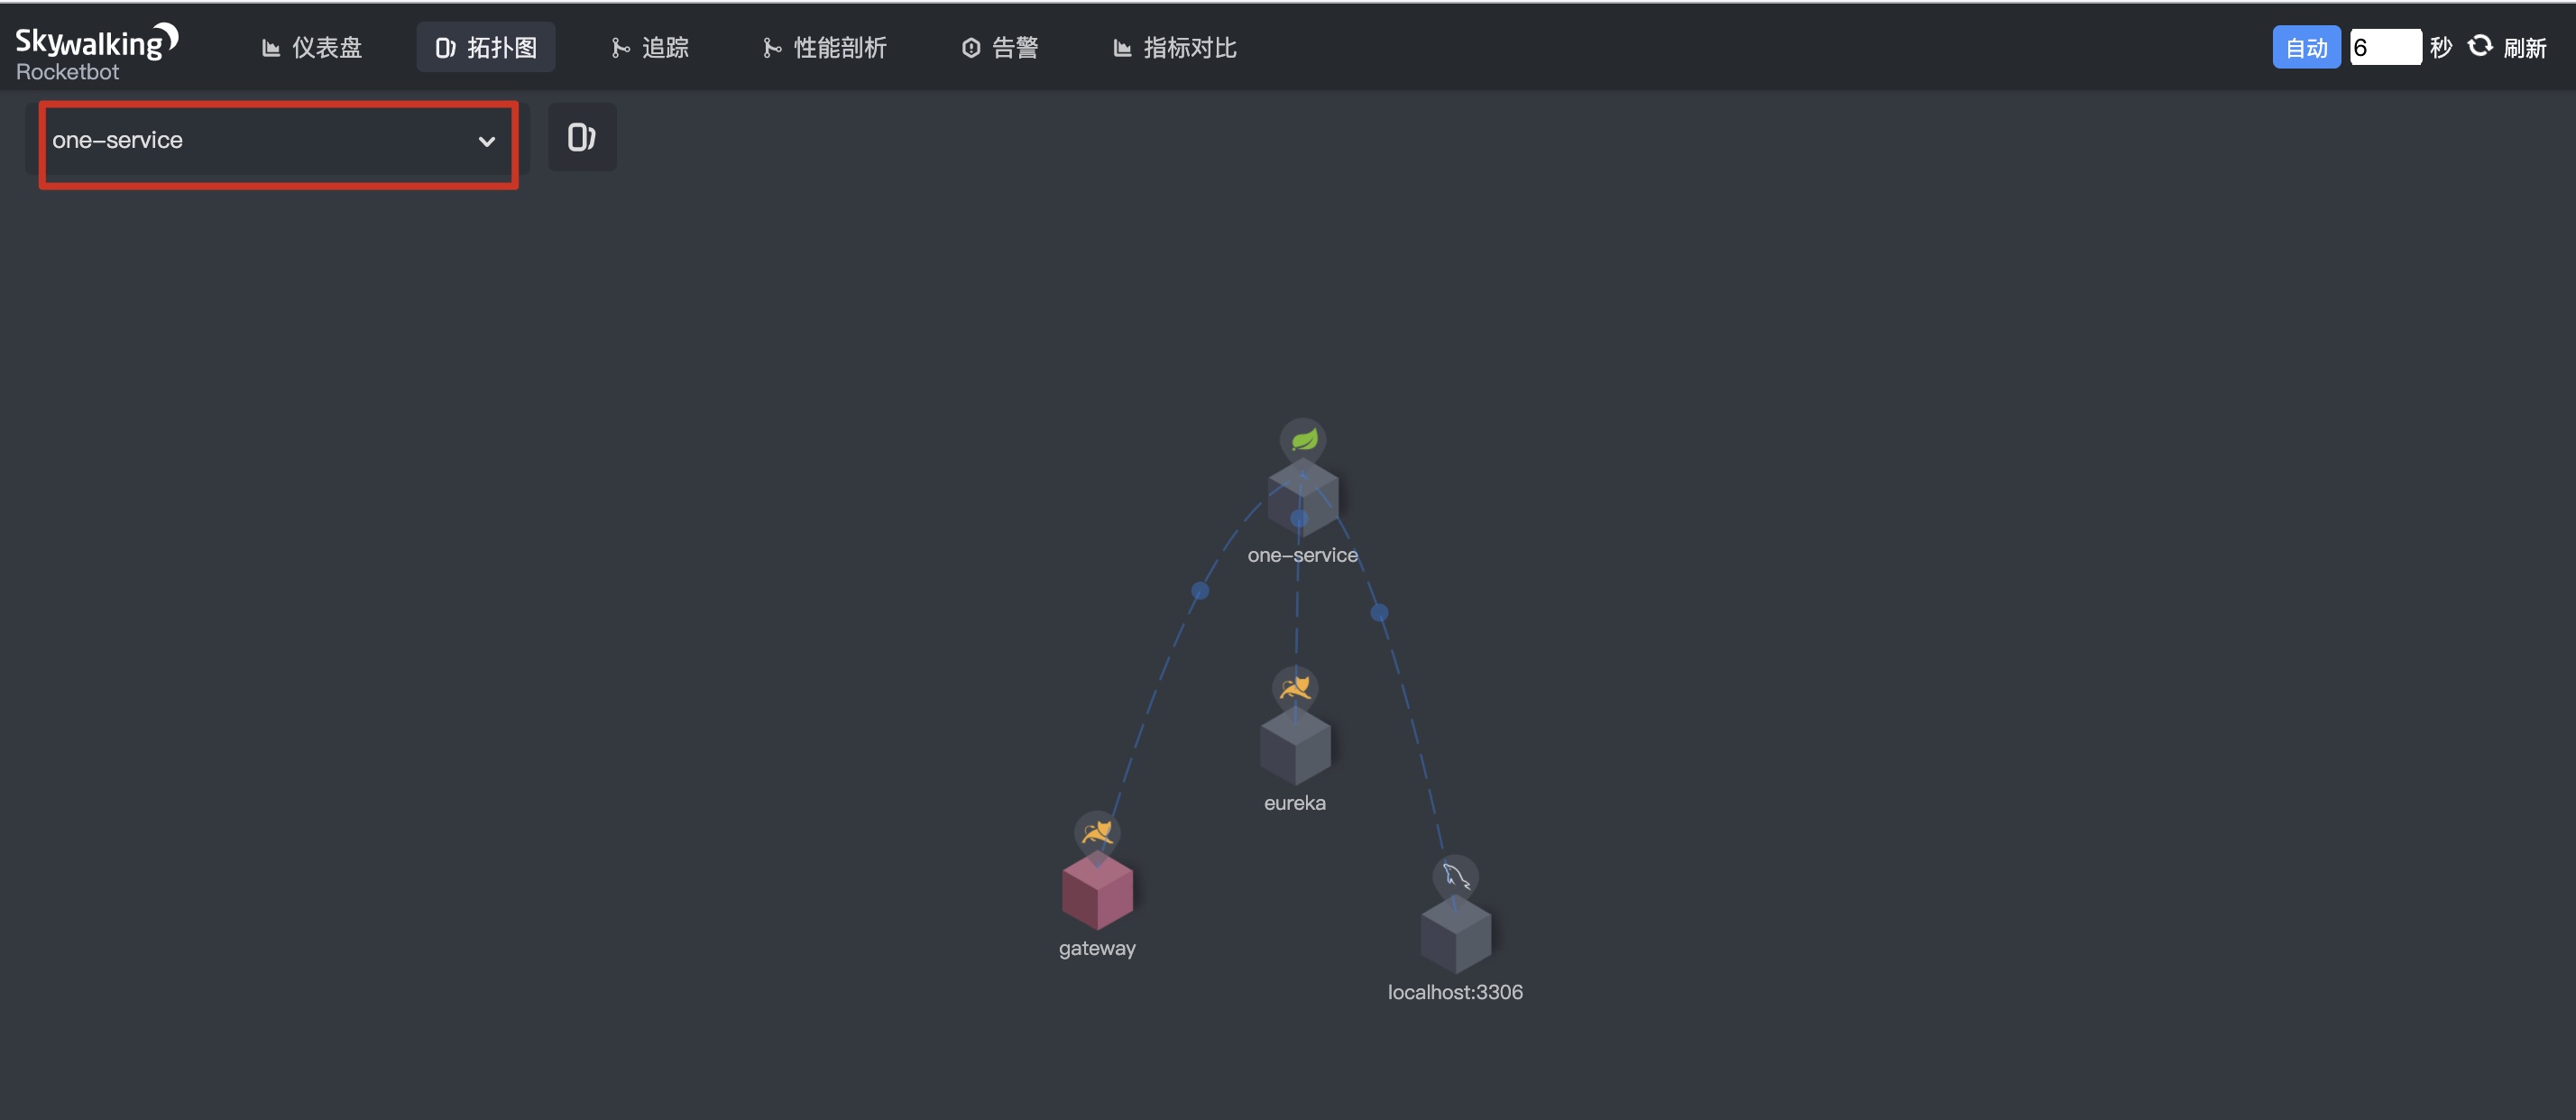
1.3 tracking - select one service, as shown below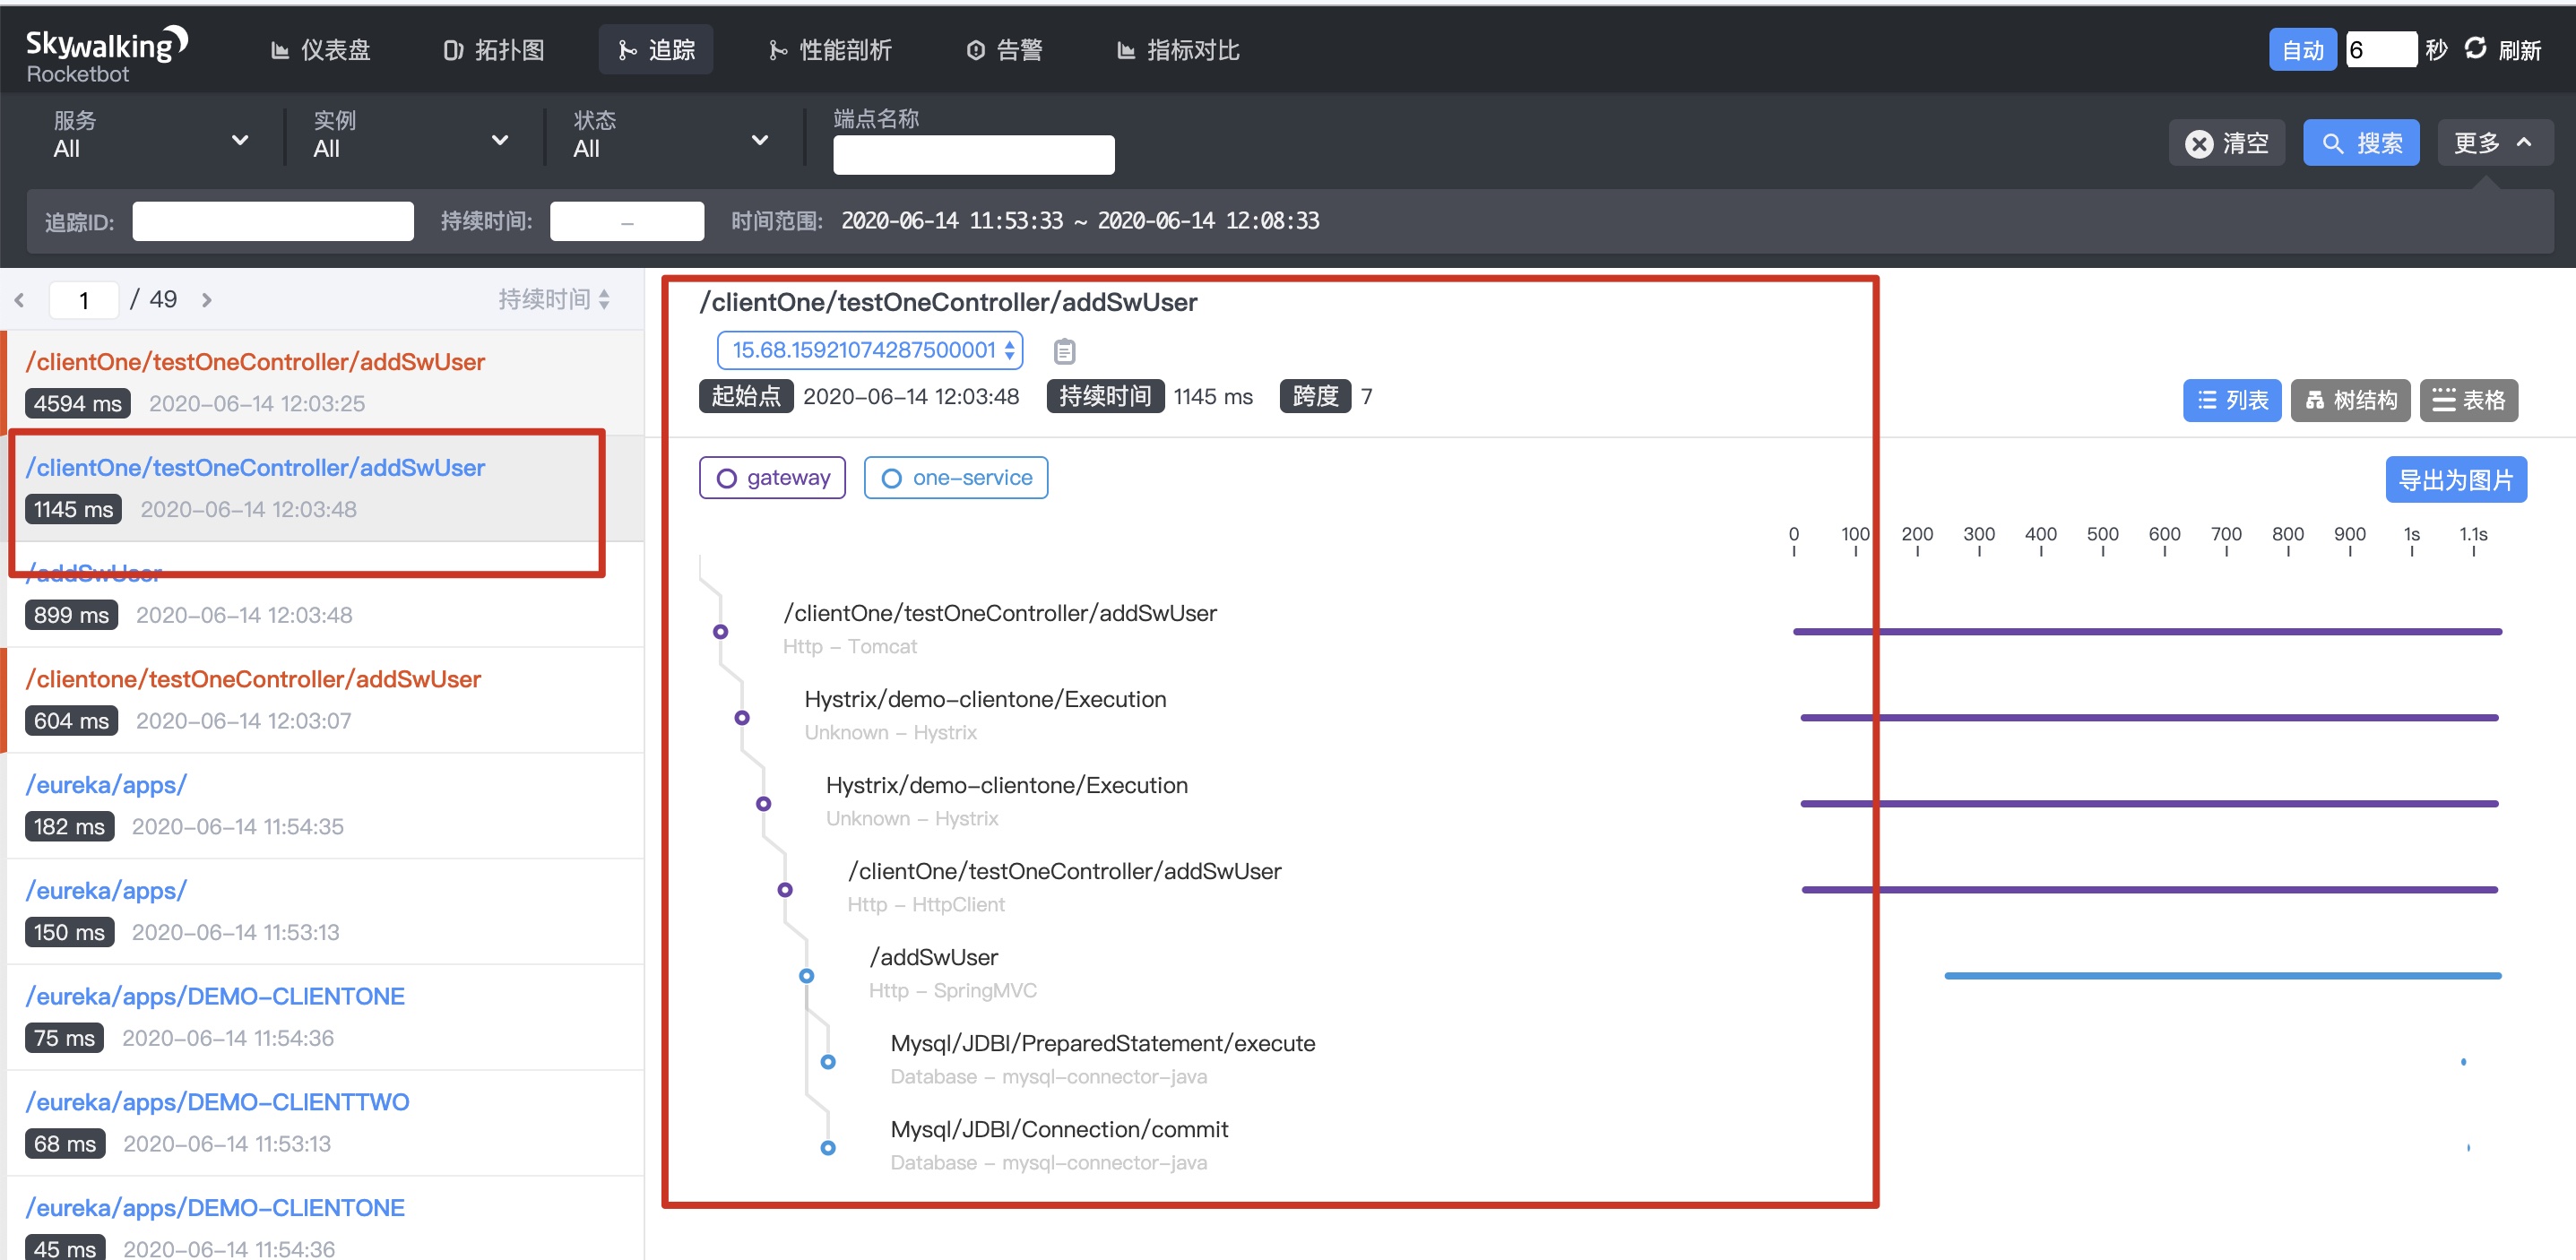
1.4 click Mysql/JDBC/PrepareStatement/execute in the figure above to see the following information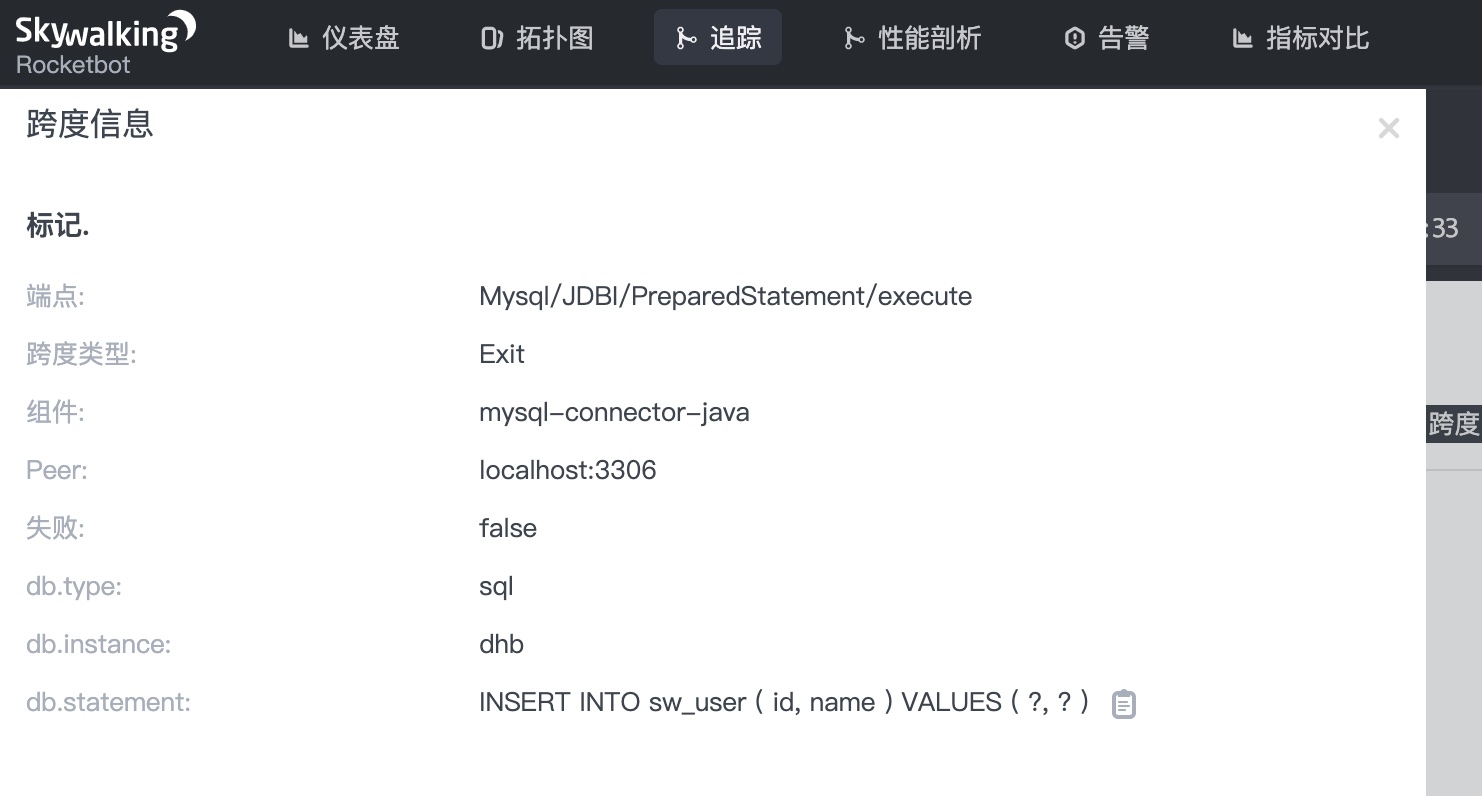 What if you want to see the parameters of executing SQL?
stay agent.config Configure. Set the following parameter to true
lugin.mysql.trace_sql_parameters=${SW_MYSQL_TRACE_SQL_PARAMETERS:true}
After configuration, restart. Request the interface again. Check the SQL calls in the call link as follows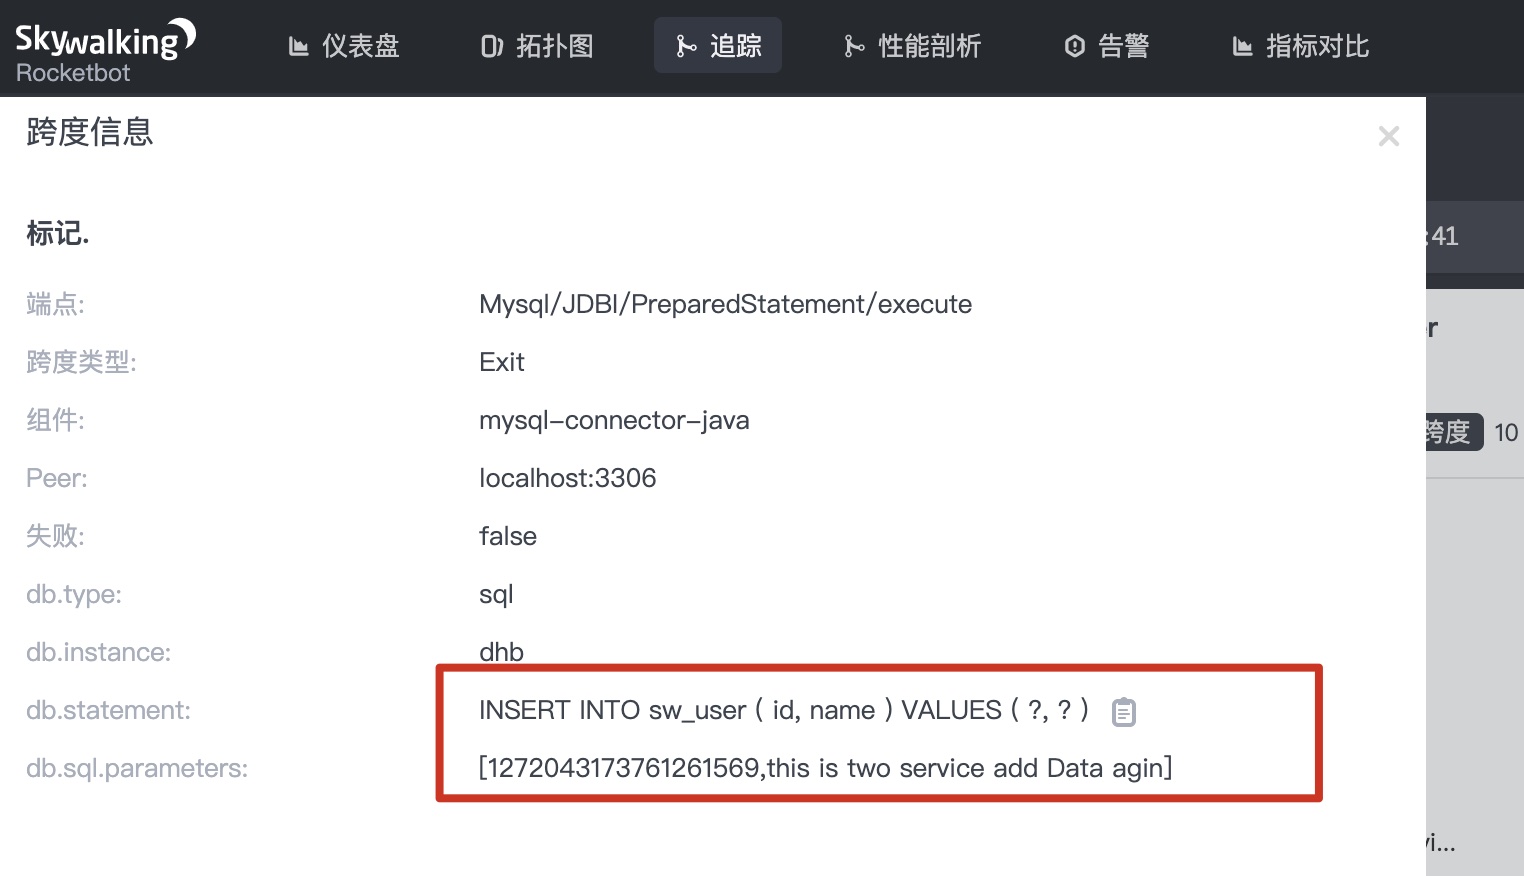
Call link monitoring between microservices
- Call between microservices, external interface requests two-service, and DemoClienttwo load balancing requests two instances (DemoClientone, DemoClientthree) under one service.
Wait a moment, you can see the following information on the console
. 1 dashboard - select two service, as shown below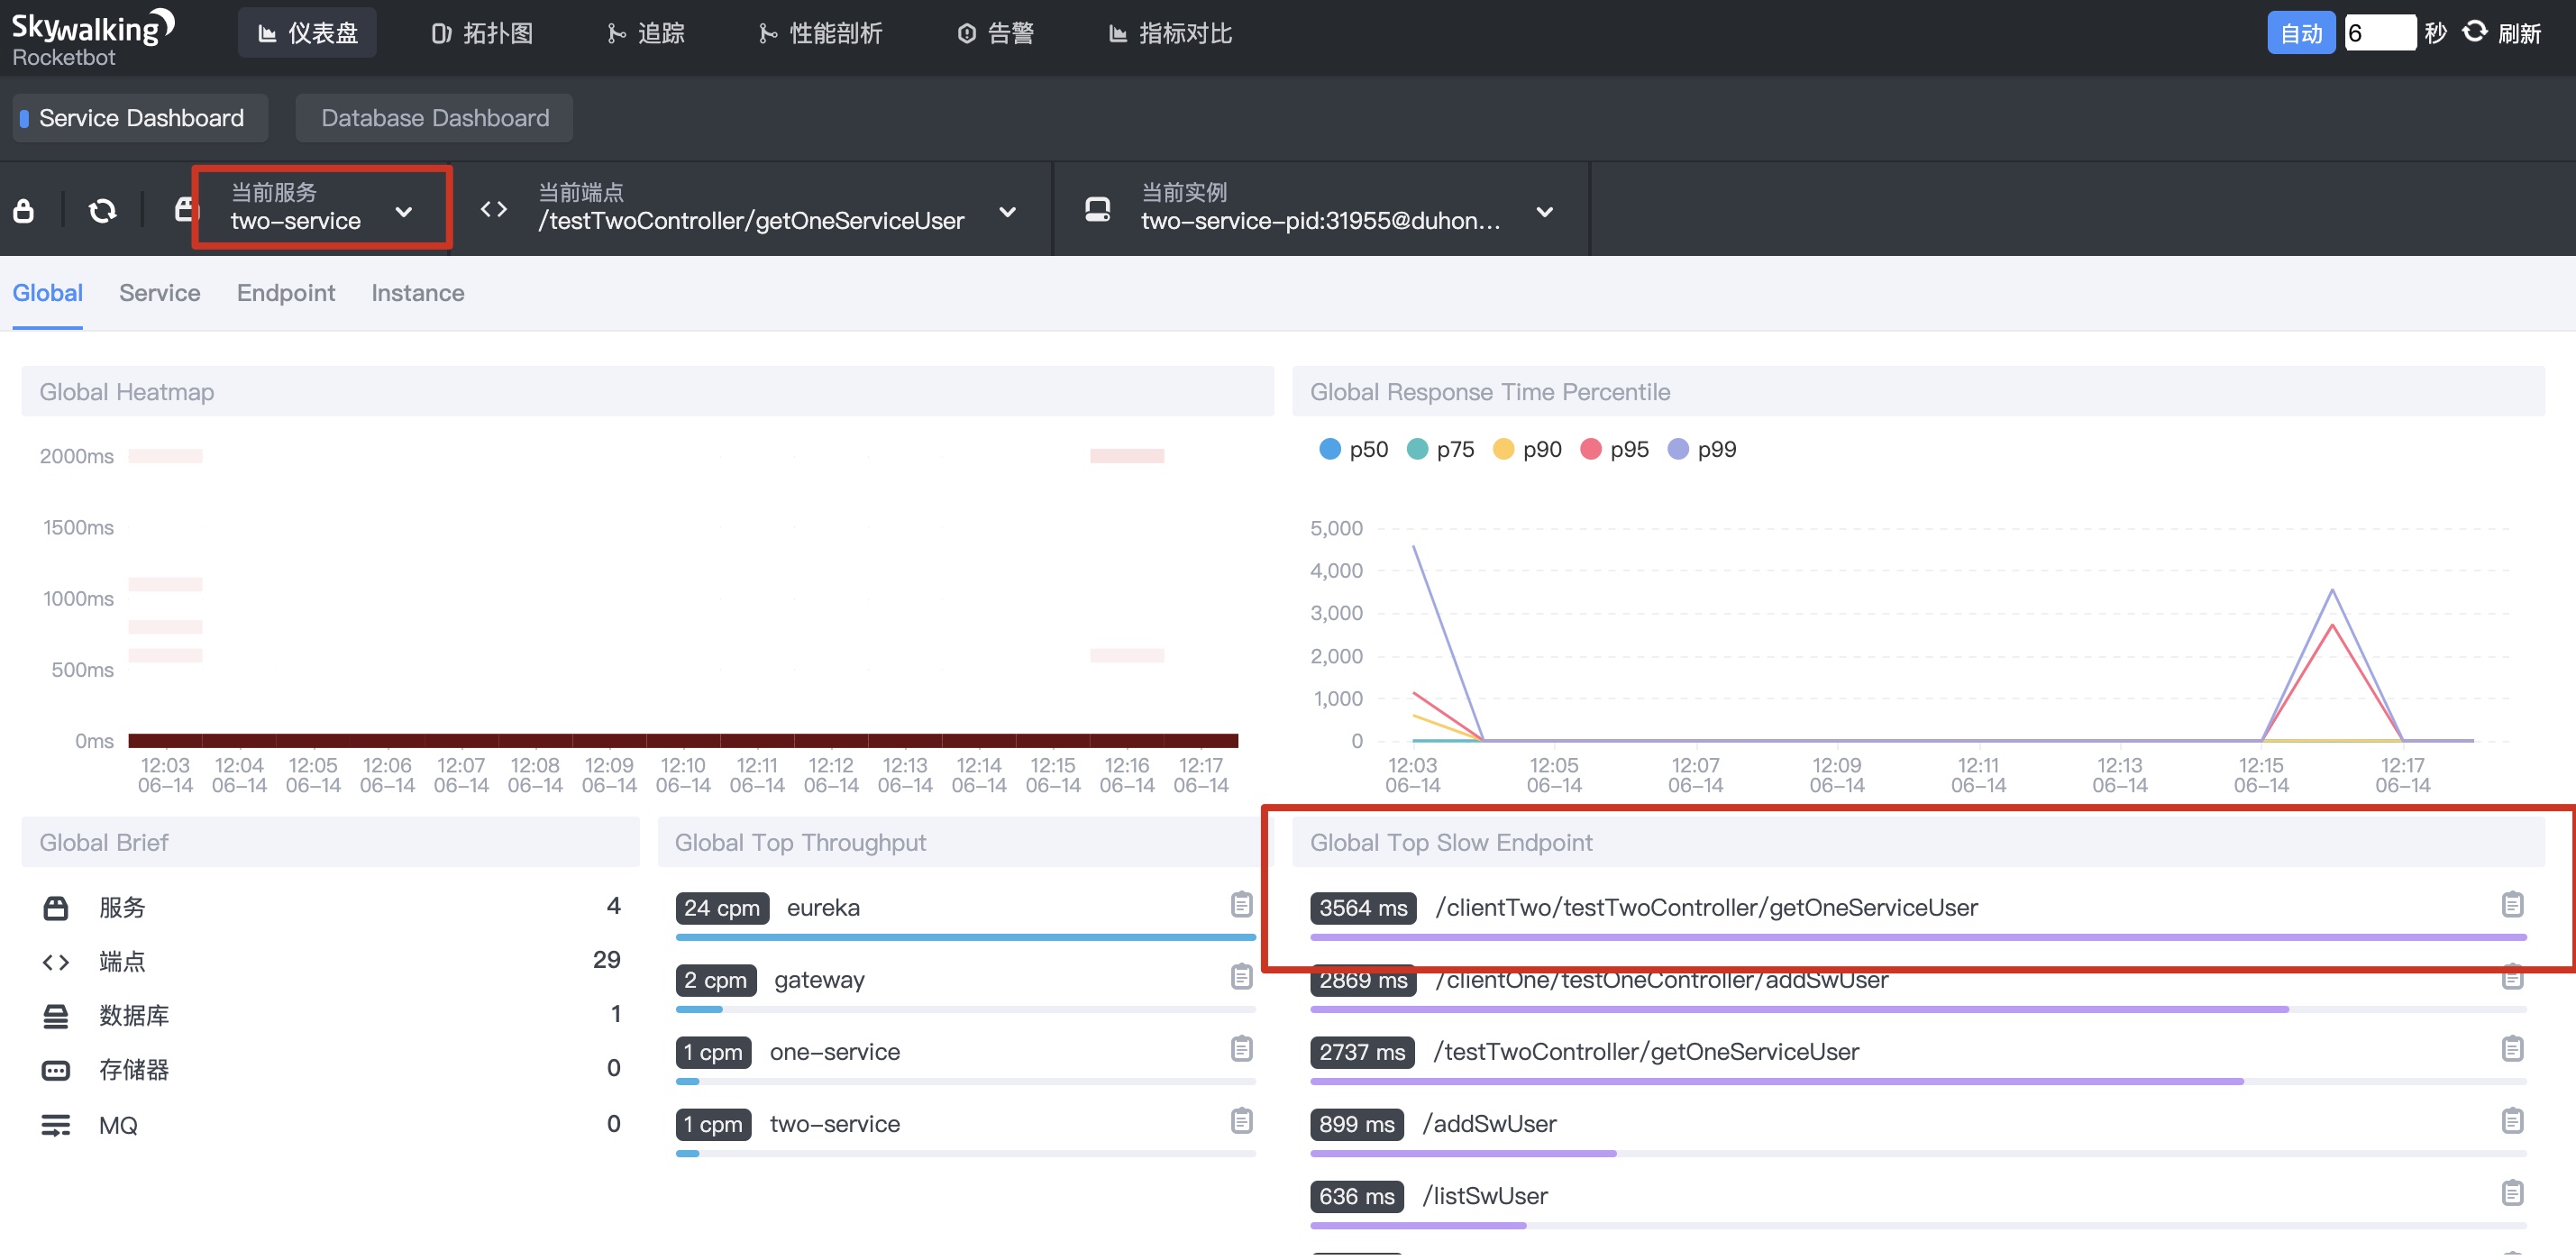
1.2 topology - select two service, as shown below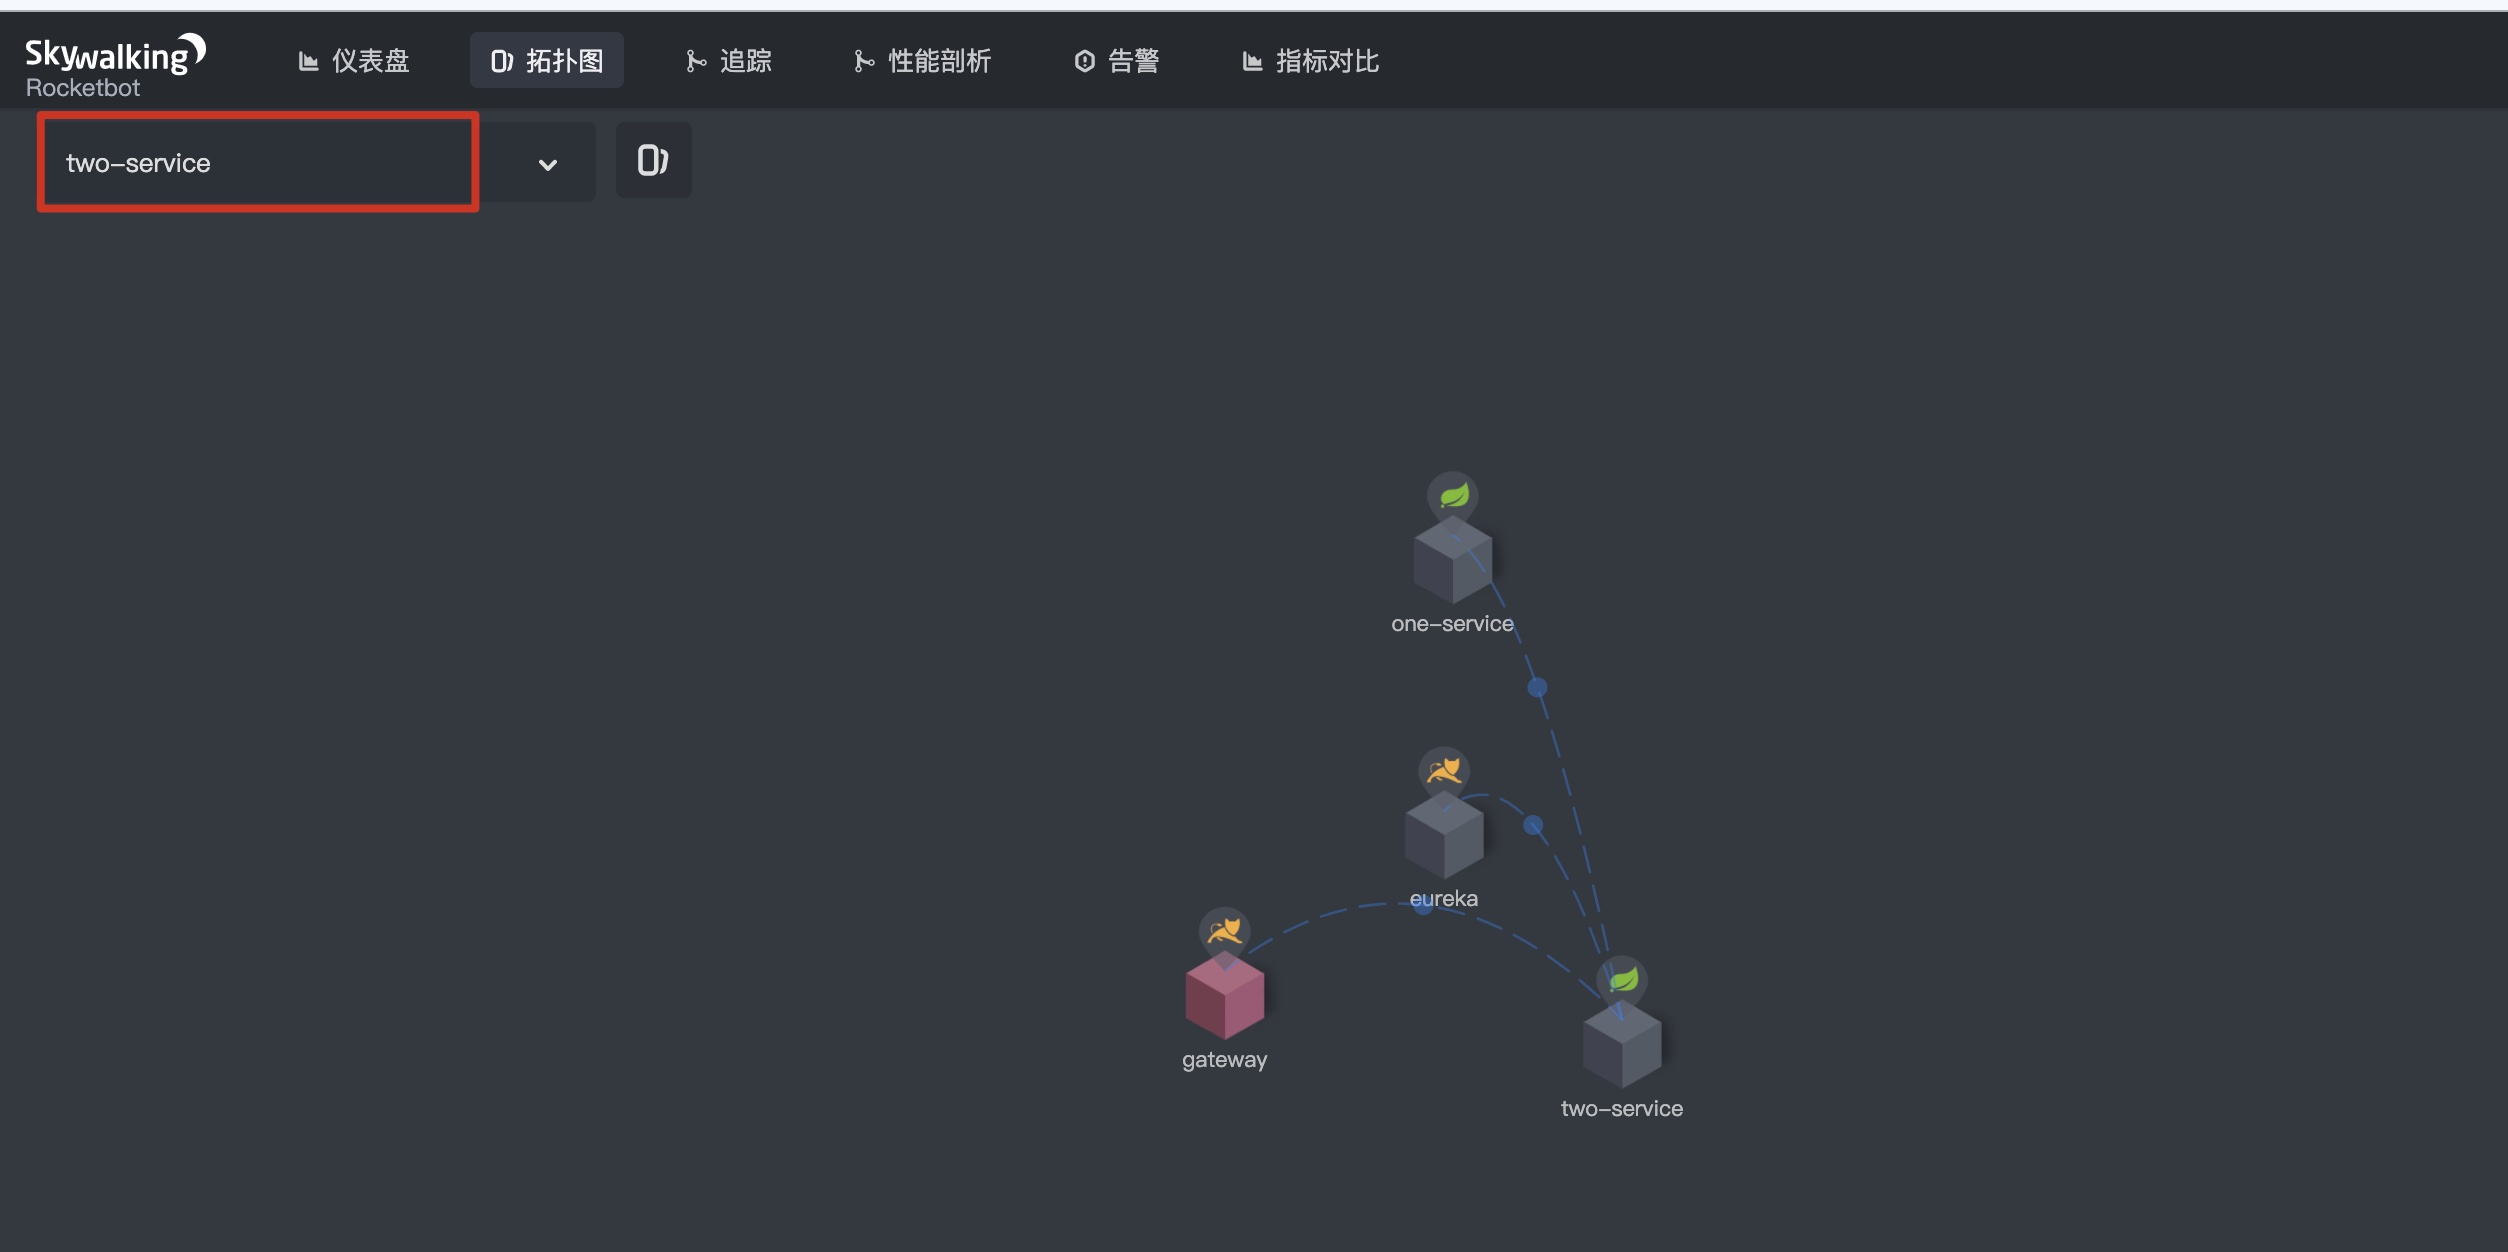
1.3 tracking - select two service, as shown below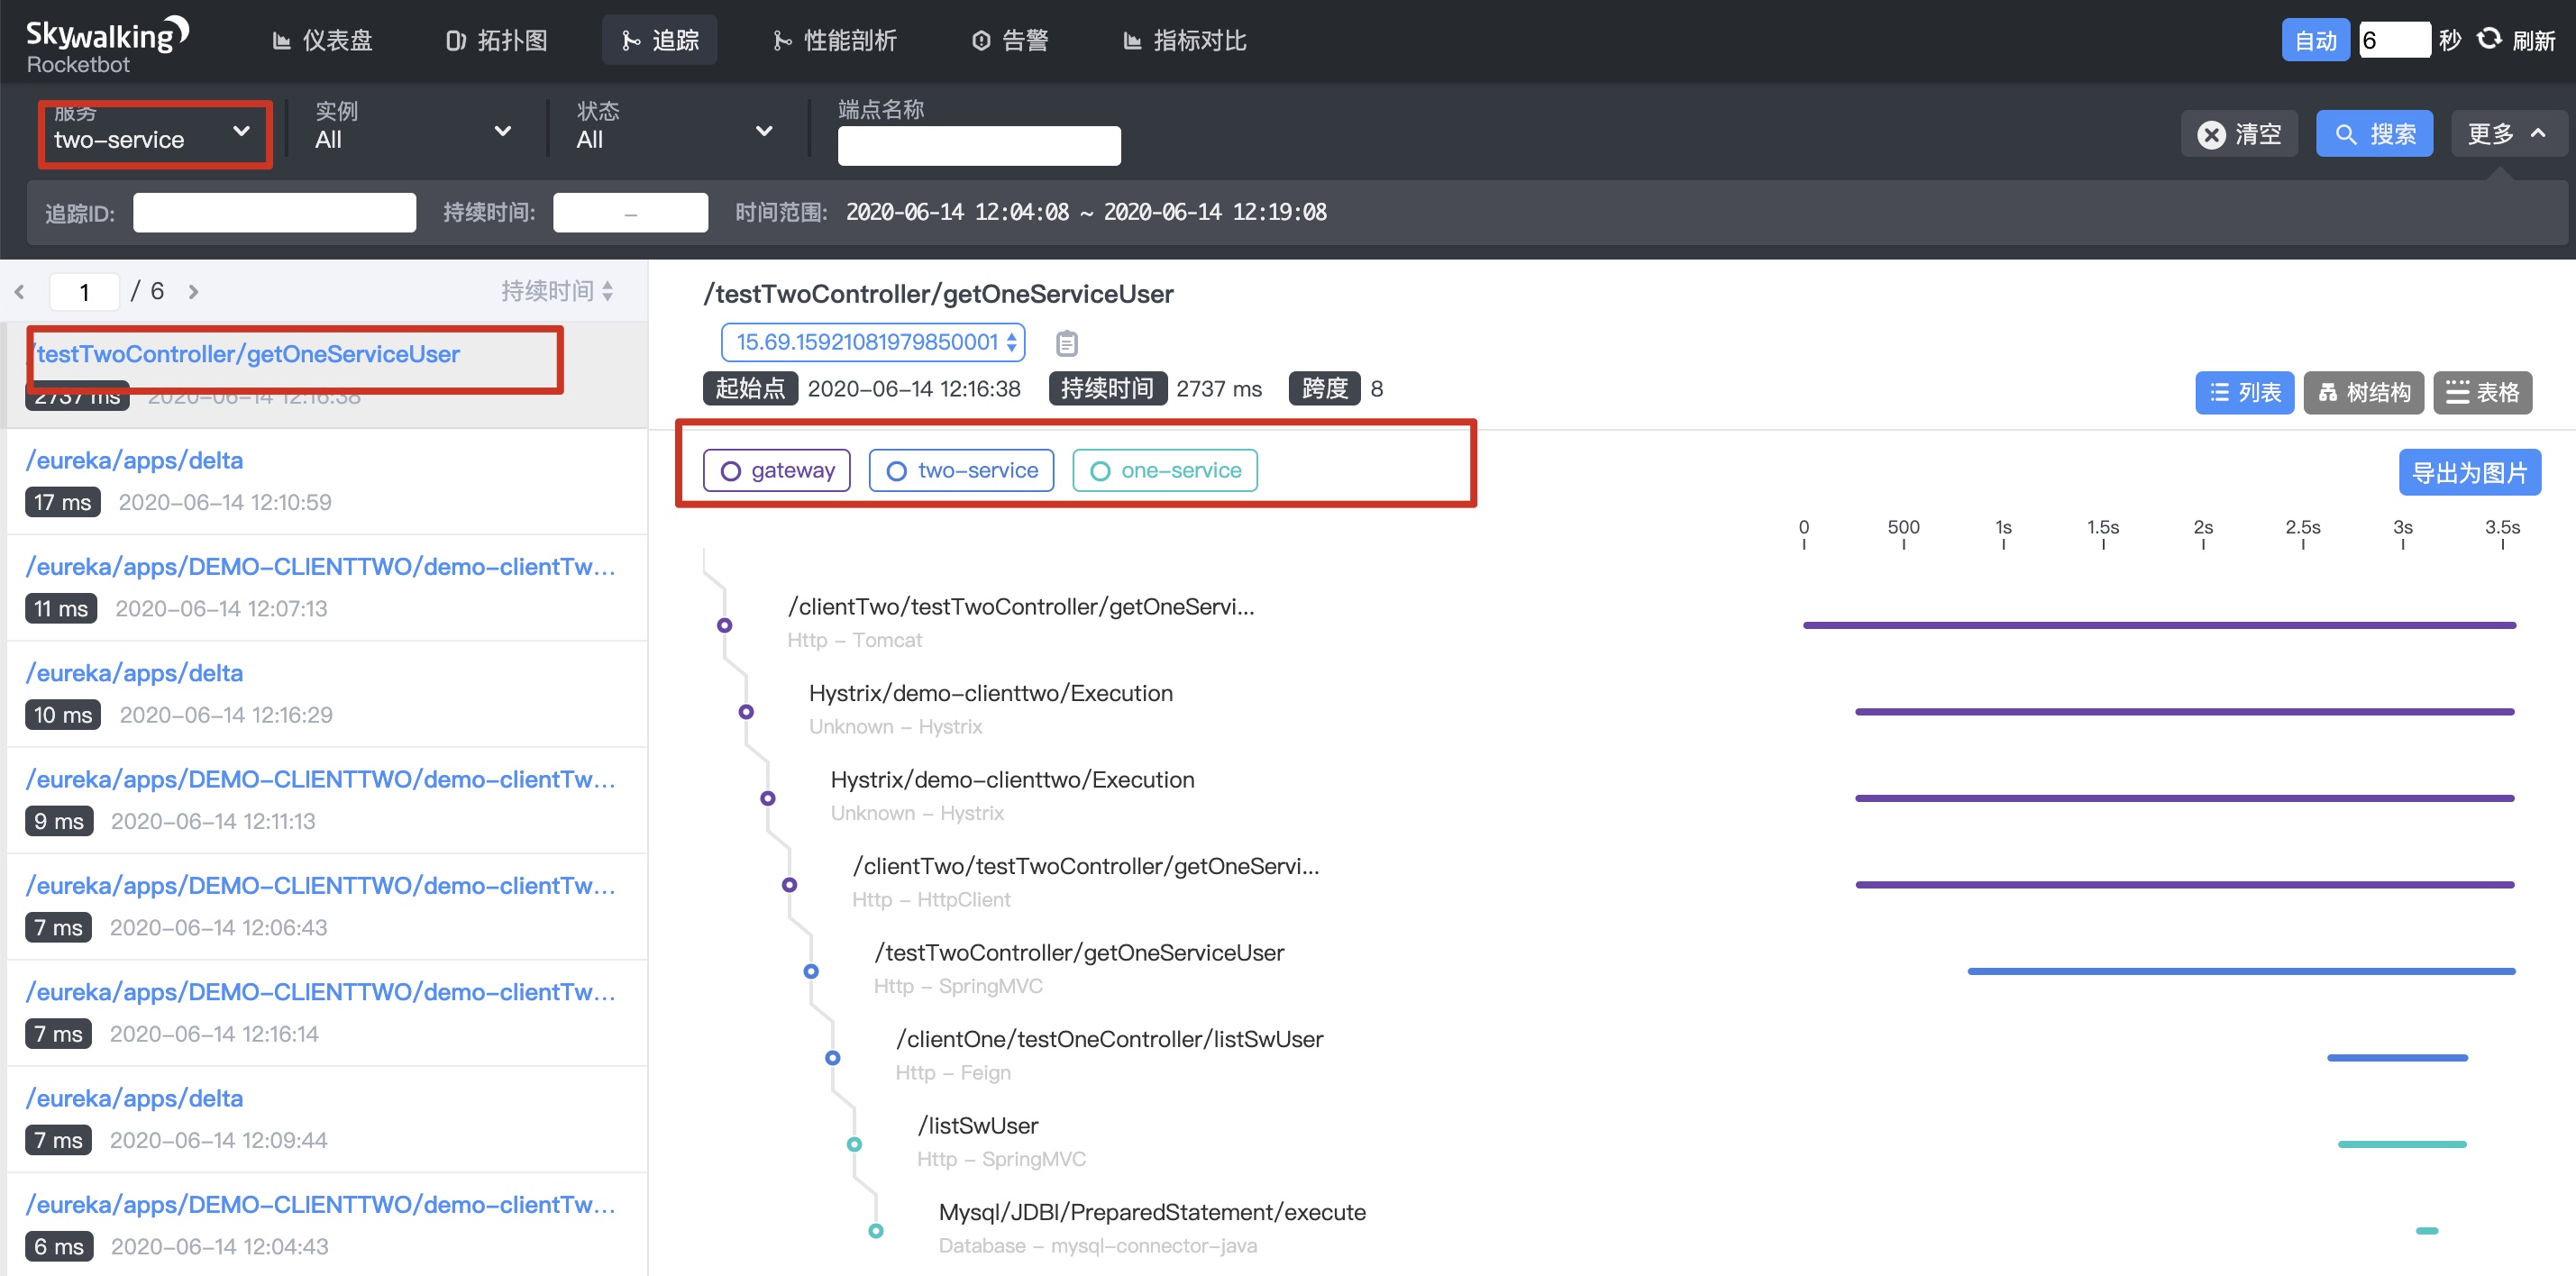
As you can see, the whole call link is gateway > Two Service > one service
1.4 click Mysql/JDBC/PrepareStatement/execute in the figure above to see the following information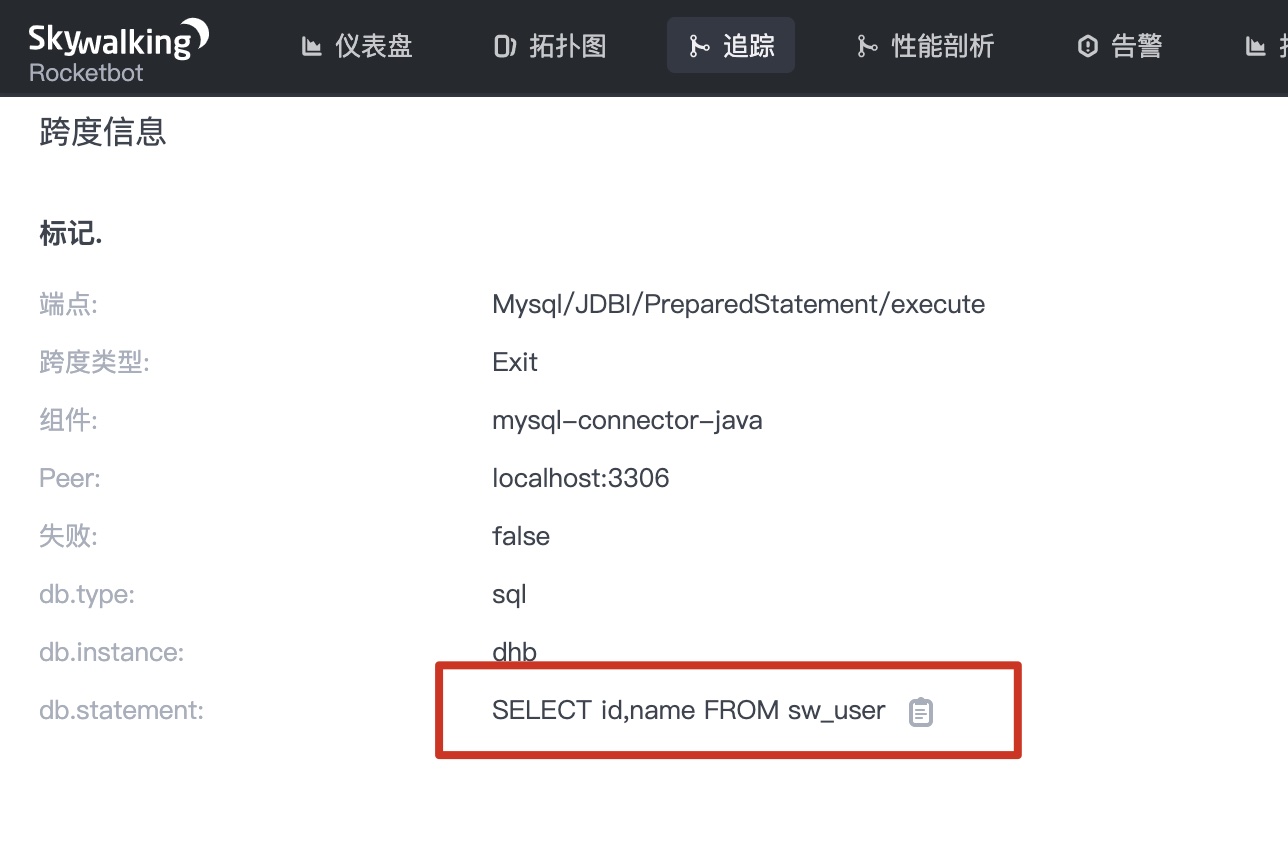
All microservice call links
The topology of all microservice call links is as follows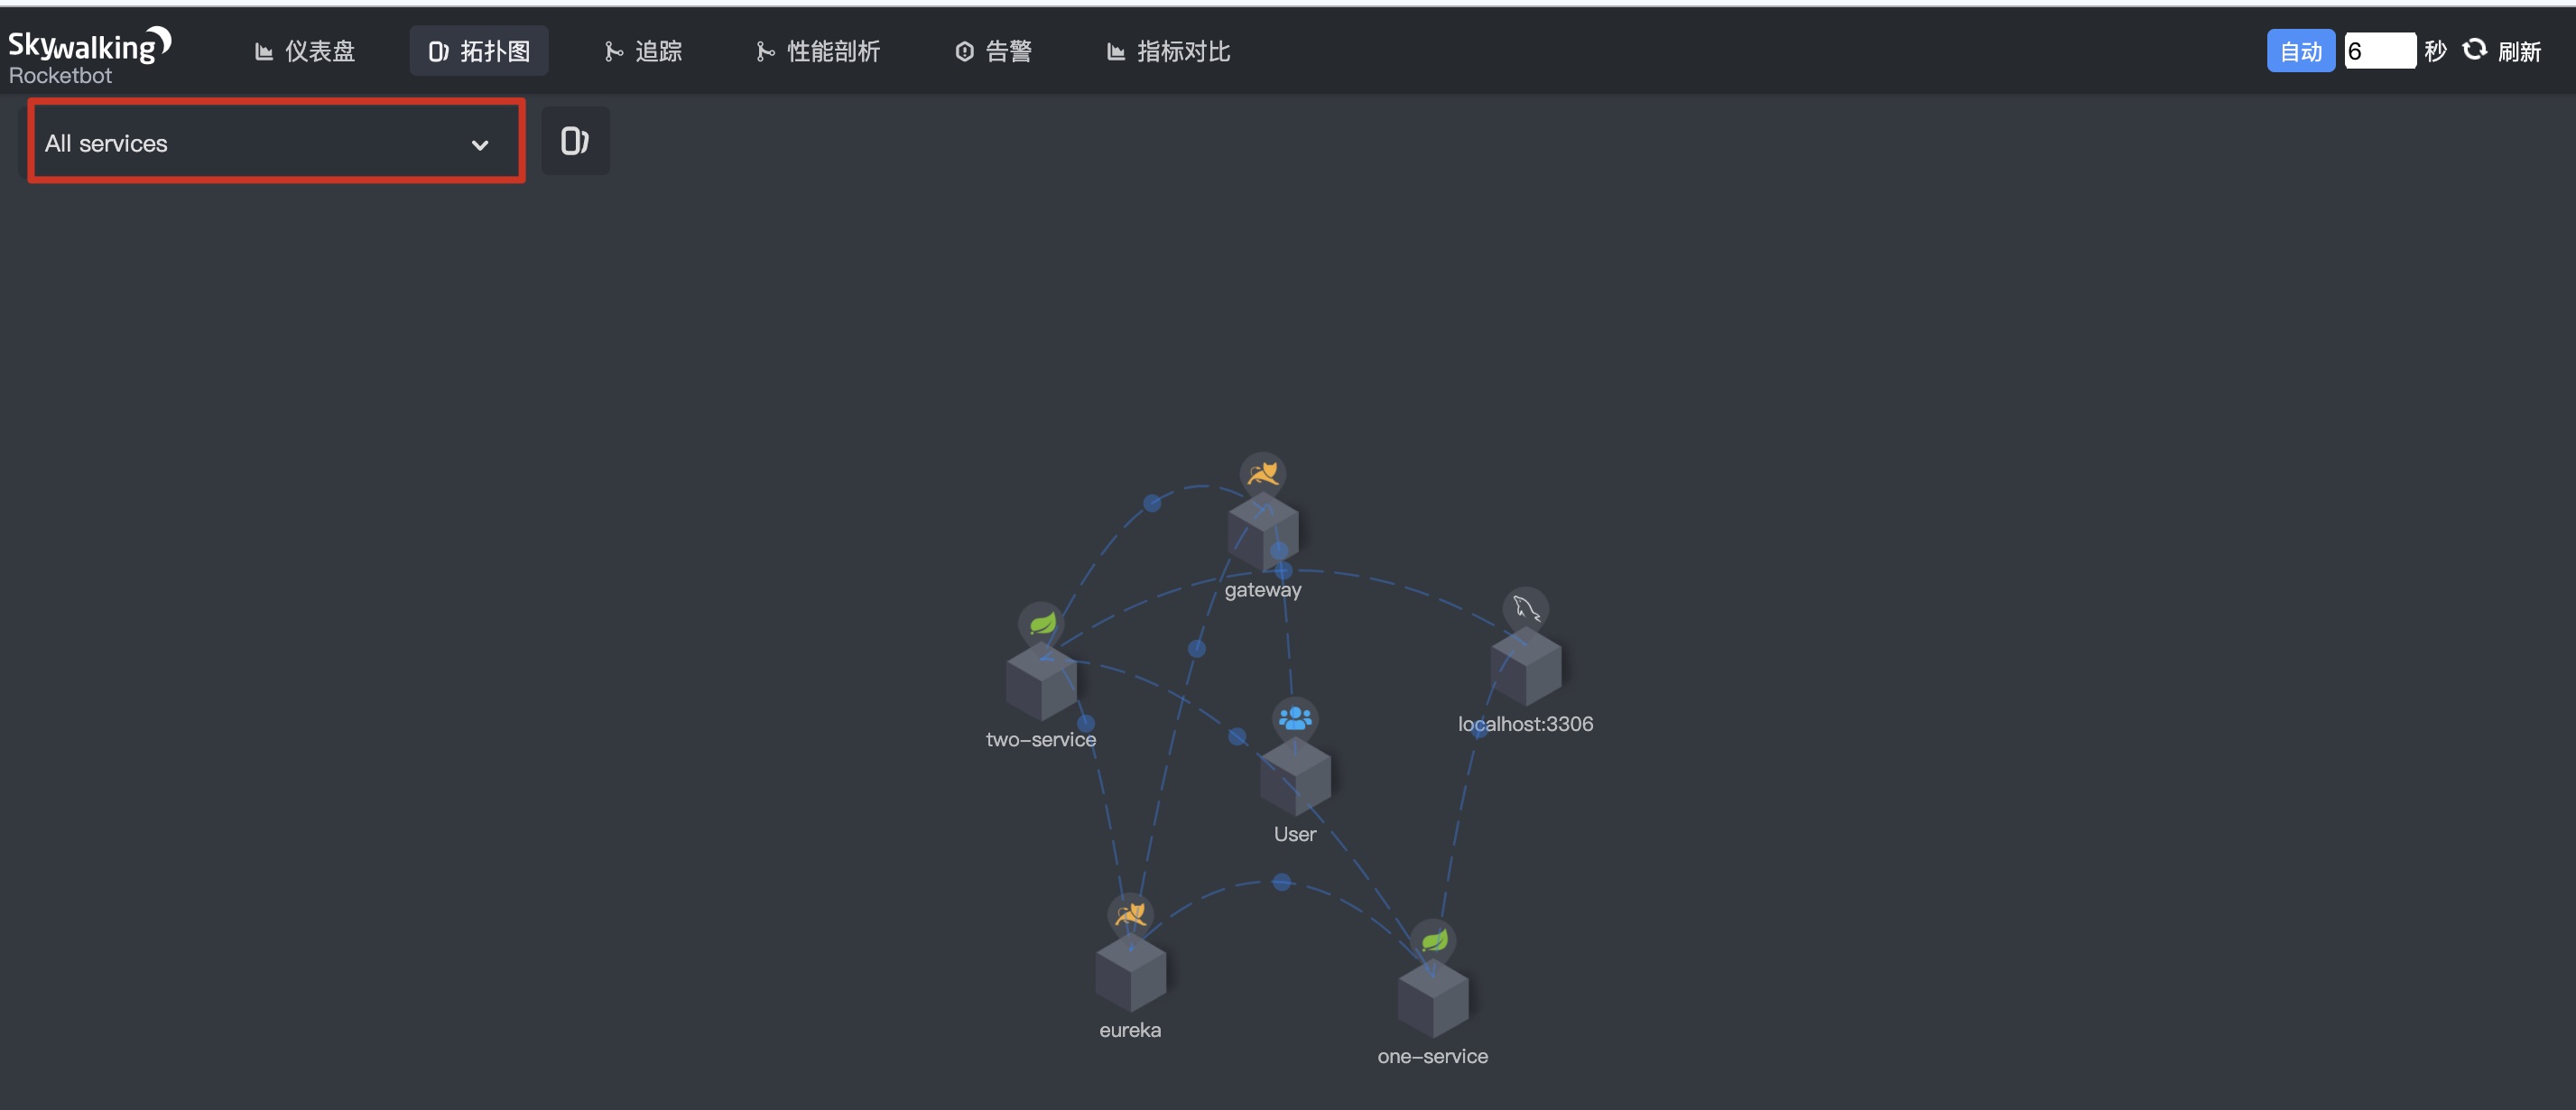
Stop SkyWalking
Due to the official failure to provide the shutdown script, please refer to issue4698, You have to kill it by hand
- Shut down Agent
# We configured 11800 to find the process occupying port 11800
lsof -i:11800
# Kill the parent process directly with pkill
pkill -9 34956
2. Close the service port of SkyWlking UI
# The default is port 8080
kill -9 8080
Stop Elasticsearch
brew service stop elasticsearch-full
summary
- Quickly use SkyWalking to complete simple detection of microservice architecture of spring cloud class
- How to use the alarm function?
- The above calls are just micro service calls, but also very single. For micro service clusters, such as registry cluster, gateway cluster, and business cluster (one actual business service, multiple instance nodes). In the case of clustering, how to smoothly adapt the services in the cluster to SkyWalking and be detected?
- For cluster configuration, how to combine configuration center to make configuration simple and easy to use?
- Because the front of gateway cluster may be Nginx cluster, how to include Nginx cluster into SkyWalking management?