If you are a member of the R & D effectiveness team or engaged in CI/CD or DevOps In addition to providing infrastructure, indicators and data are also a very important part. For example, it is necessary to analyze the code submission of a Git warehouse:
- Who submitted the most codes for the warehouse
- What is the activity of the warehouse like
- Submit analysis data for each period
- Contribution ranking of each version
- Weekly / monthly / annual contribution ranking, etc
A few days ago, I found a Git historical statistics generation tool called gitstats( http://gitstats.sourceforge.net/ )
This is a very powerful analysis tool written in python with little code. It is also one of the few open source projects I have found that can generate beautiful reports and use them easily.
1, How to use
Installation dependencies: Git, Python, Gnuplot.
If you have Linux, it is recommended to download and install it on Linux. I have tried to prepare the environment with Windows. It is very troublesome to download Python 2, configure Cygwin, and manually configure Gnuplot (Gnuplot is a portable command-line driven graphics tool). Here are my installation and use steps on Linux.
# Download Python 2
sudo yum -y install python27
# Install Gnuplot
sudo yum -y install gnuplot
# Download gitstats
# If the following project address is invalid, this can be used https://gitee.com/jeffreyu/gitstats.git
git clone https://github.com/hoxu/gitstats.git
# Download the code warehouse you want to analyze
git clone https://github.com/alibaba/fastjson.git
# Execute command, production report
cd gitstats
./gitstats ./fastjson ../html/fastjson
# After 15 seconds of execution, a report is generated
Generating report...
[0.00393] >> git --git-dir=/workspace/gitstats/.git --work-tree=/workspace/gitstats rev-parse --short HEAD
[0.00236] >> git --version
[0.00716] >> gnuplot --version
Generating graphs...
[0.01676] >> gnuplot "/workspace/html/fastjson/day_of_week.plot"
[0.01571] >> gnuplot "/workspace/html/fastjson/files_by_date.plot"
[0.01281] >> gnuplot "/workspace/html/fastjson/month_of_year.plot"
[0.09293] >> gnuplot "/workspace/html/fastjson/lines_of_code_by_author.plot"
[0.01340] >> gnuplot "/workspace/html/fastjson/commits_by_year.plot"
[0.01799] >> gnuplot "/workspace/html/fastjson/hour_of_day.plot"
[0.01627] >> gnuplot "/workspace/html/fastjson/domains.plot"
[0.01268] >> gnuplot "/workspace/html/fastjson/commits_by_year_month.plot"
[0.09435] >> gnuplot "/workspace/html/fastjson/commits_by_author.plot"
[0.01522] >> gnuplot "/workspace/html/fastjson/lines_of_code.plot"
Execution time 15.16208 secs, 4.58247 secs (30.22 %) in external commands)
You may now run:
2, How to access
1. The location of the report I generated is under linux

2. I forwarded it through nginx
3. The access address is
http: / / your domain name / fastjsonview / index html
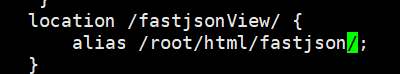
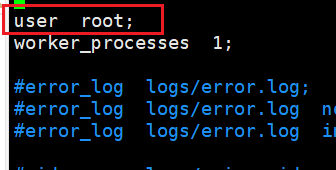
4. There is a problem here. After visiting, nginx reports 403
The solution is nginx Conf configuration file, remove the comment in the first line and change it to root;
After modifying the query loading configuration.
3, Report analysis
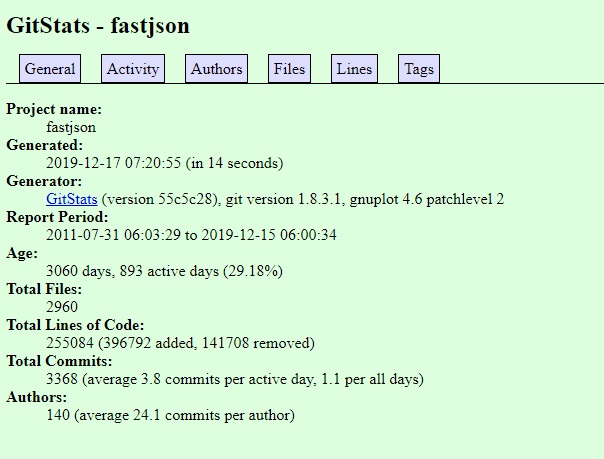
1. General statistics
You can see that this project is called fastjson. It has been 3060 days and 893 active days since the first code Submission on July 31, 2011. The total number of files is 2960, and the total number of lines of code is 250000.
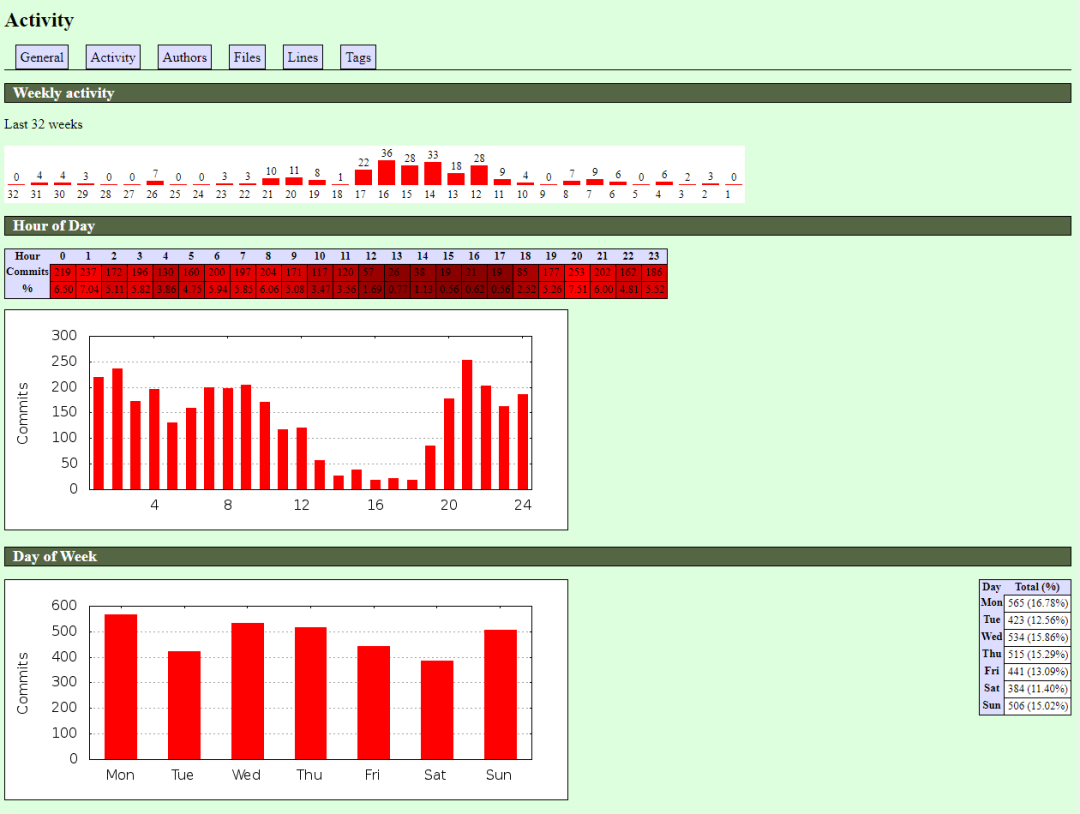
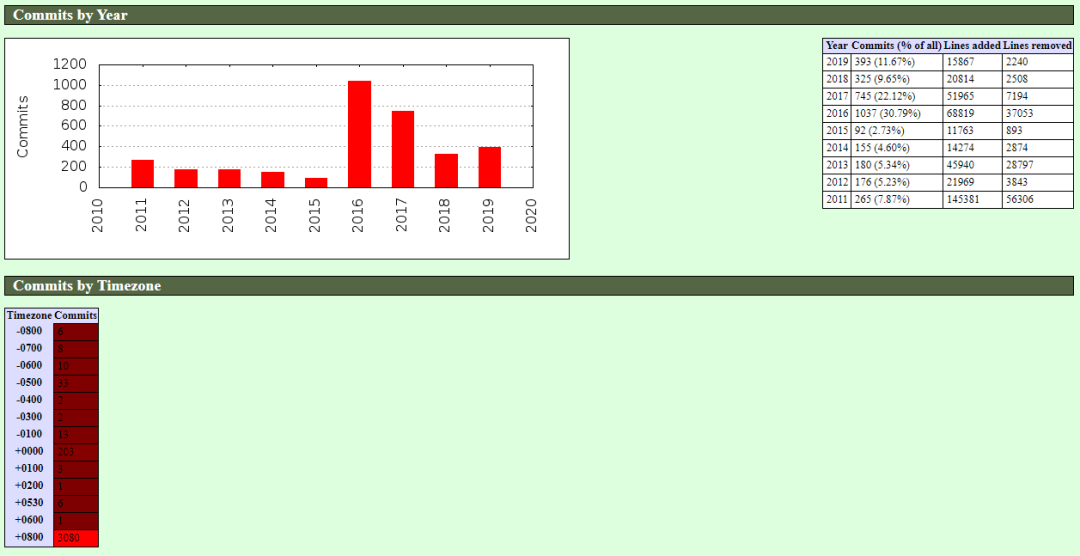
Activity
Number of submissions per hour per day, per day per week, per hour per week, per month per year, per year.
In the past 32 weeks, the first 12 to 17 weeks have been very active and submitted a lot. In addition, we can see that there are few submissions between 12:00 and 20:00 during the day. Most programmers are dealing with the work of the company during this time and are unable to contribute to open source projects.
After 20 pm, the number of submissions began to increase. It seems that he is a very hard-working developer. In addition, you can see that there are submissions from Monday to Sunday. Saturday is relatively the least. It should be Saturday to rest and relax. There are obviously more submissions on Sunday than on Saturday. It seems that it took a lot of valuable personal weekend time.
It can also be seen that the project is mainly completed from 2016 to 2017, and the time zone for completion is the East eighth district. This dimension can analyze the contribution of developers in different regions.
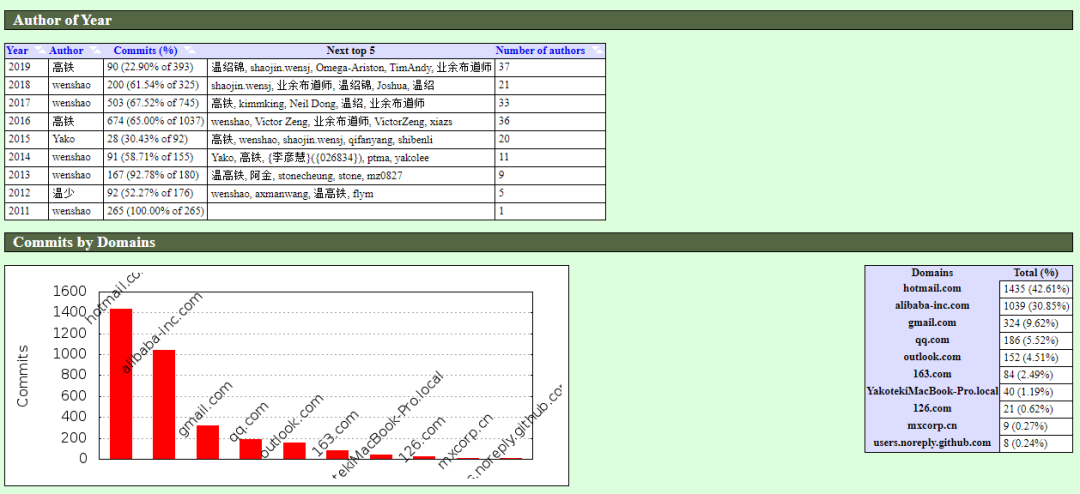
2. Contributors
List all authors, number of submissions, first submission and last submission.
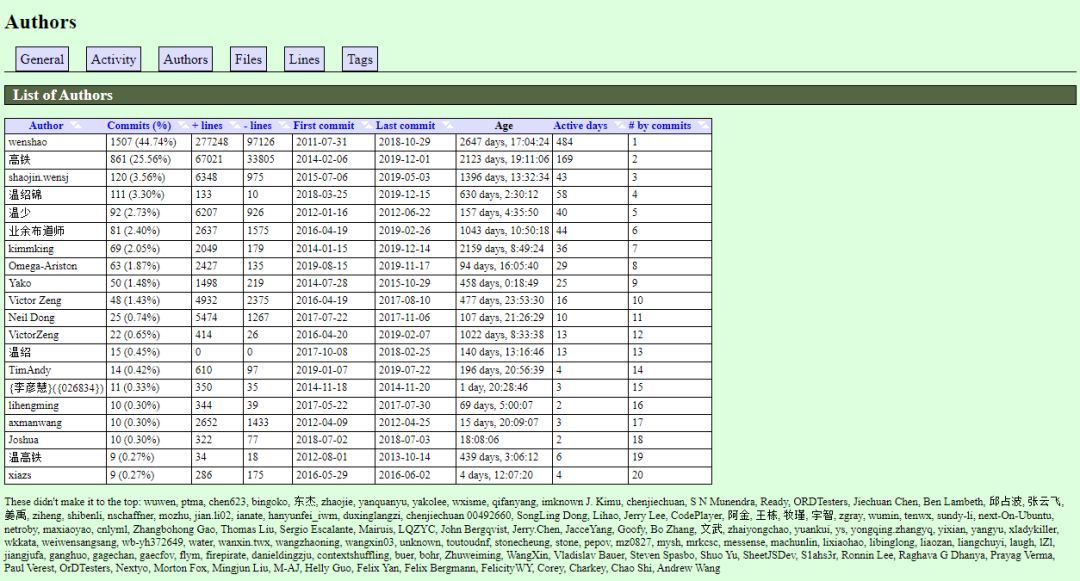
This picture also shows who is the creator of the project and who has contributed the most every year in recent years. You can also see the email account used by the submitter.
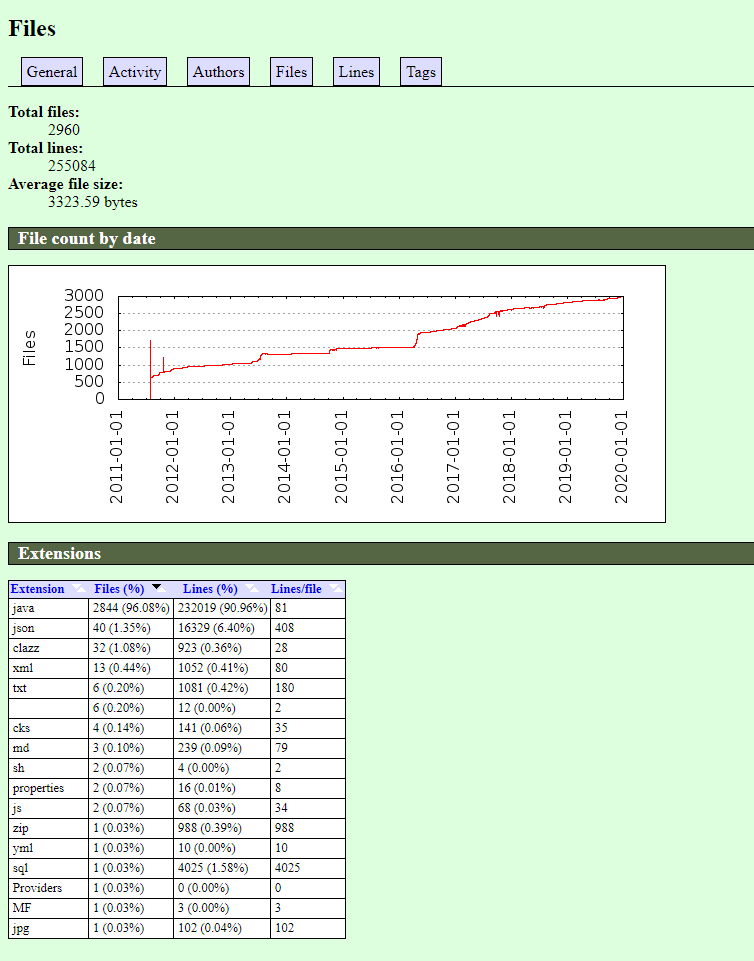
3. Number of files and lines
The total number of files is 2960, and the number of code lines is 250000.
In addition, you can also see the trend chart of file increase every year and the ranking of the number of these file types. You can see that java files account for 96.08%, followed by json.
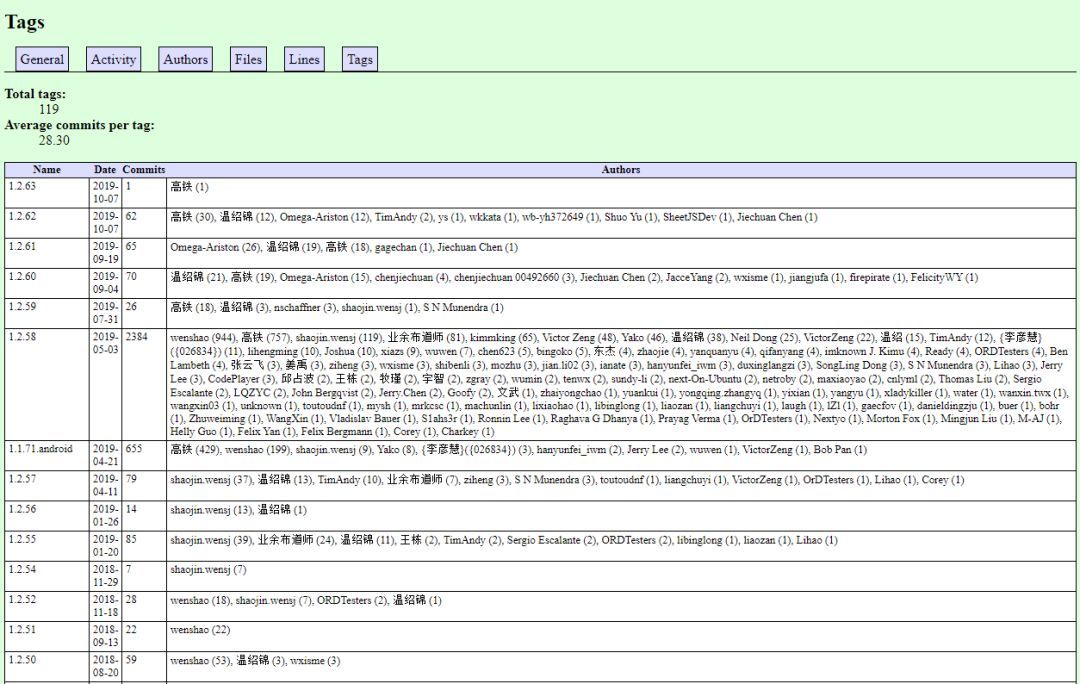
4,Tags
Tag s is a very important analysis indicator for the team (provided that the warehouse to be analyzed creates Tags after the release). You can see the contribution ranking of each version.
last
- If you are interested, you can analyze your own project or go to GitHub to find an interesting and influential project for analysis, such as 996 ICU and vue, etc.
- To facilitate team members' access, it is recommended to create an automated task that can be executed regularly by Jenkins to obtain the latest Git history, and then put the generated html on a Tomcat service so that all team members can access it.