1, glances introduction
Glaces is a python based language development, which can provide the function of monitoring and analyzing performance data for linux or UNIX performance. Glaces displays important system information on the user's terminal and updates it dynamically, so that the administrator can master the use of system resources in real time. However, dynamic monitoring does not consume a lot of system resources, such as CPU resources, which is usually less than 2%. Glaces updates the data every two seconds by default. At the same time, glaces can also capture the same data into a file, which is convenient for later analysis and graphic drawing of the report. The supported file formats are csv spreadsheet format and html format.
glances can analyze the of the system:
- CPU utilization
- Memory usage
- Kernel statistics and run queue information
- Disk I/O speed, transfer, and read / write ratio
- Disk adapter
- Network I/O speed, transmission and read / write ratio
- Page monitoring
- Process monitoring - processes that consume the most resources
- Computer information and system resources
2, Glaces installation method
- Source installation
- Installation based on pip command
- Public network yum source based on epel
Since the source code installation needs to solve the problem of relying on a large number of packages, and there is great pressure for Xiaobai students to learn, this paper will focus on the installation method based on yum, so that you can quickly install and experience the powerful and efficient grace monitoring in time.
3, Installing glaces based on public network source of epel
Since grace needs a python environment to run, we need to install the python environment first. Here I use a script to install Python 3 7.3, the latest version at present.
3.1,python3.7.3 installation script
#!/bin/bash
#
#Name:
#Author: Bai Shuming
#Created Time: 2019/10/1 11:20
#Release:
#Description:python 3.7.3 installation script

#variable
source_url="https://www.python.org/ftp/python/3.7.3/Python-3.7.3.tgz"
source_pkg="Python-3.7.3.tgz"
source_doc="Python-3.7.3"

cpu_count=`egrep "flags" /proc/cpuinfo |wc -l`

#program
check () {
  [ "$USER" != "root" ]&&echo "need be root so that"&&exit 1
  [ ! -x /usr/bin/wget ]&&echo "not found command: wget"&&exit 1
}


install_python () {

check

#1,download python source package
if ! (wget $source_url &>/dev/null) ;then
   echo "$source_pkg download fail"
   exit 1
fi
#2,Decompression source package
if [ -f $source_pkg ];then
    tar xf $source_pkg
else
    echo "not found package: $source_pkg"
    exit 1
fi

#3,python install pre
if ! (yum -y install gcc-* openssl-* libffi-devel  curses-devel lm_sensors sqlite-devel &>/dev/null);then
    echo "yum install software package fail"
    exit 1
fi


#4,configure python install env
if [ -d $source_doc ];then


   #5,python configure
   cd $source_doc

   sed -i.bak '212s/#//' Modules/Setup.dist
   sed -i '213s/#//' Modules/Setup.dist
   sed -i '214s/#//' Modules/Setup.dist

   echo "python configure...please waiting"
   if ./configure --enable-optimizations --with-openssl=/usr/bin/openssl &>/dev/null ;then

           #6,python make
           echo "python make...please waiting"
           if make -j $cpu_count &>/dev/null ;then

                #7,python install
                echo "python install...please waiting"
                if make install & > /dev/null;then
                    echo "$source_doc install success"
                else
                    echo "python make install fail"
                    exit 1
                fi
            else
                echo "python make fail"
                exit 1
            fi
    else
         echo "python configure fail"
         exit 1
    fi
else
   echo "not found $source_doc"
   exit 1
fi


post_install

}


#Post-installation settings
post_install () {
#update pip tool
pip3 install --upgrade pip

}


#function call

install_python && rm -rf $source_doc
3.2. glances installation
[root@manager01 ~]# pip install glances
Collecting glances
  Downloading https://files.pythonhosted.org/packages/32/34/72f9202ad5b7ada314507a50b9ab1fb604d2f468b138679e0a4fedeb91fa/Glances-3.1.0.tar.gz (6.7MB)
     |████████████████████████████████| 6.7MB 659kB/s
Collecting psutil>=5.3.0 (from glances)
  Downloading https://files.pythonhosted.org/packages/1c/ca/5b8c1fe032a458c2c4bcbe509d1401dca9dda35c7fc46b36bb81c2834740/psutil-5.6.3.tar.gz (435kB)
     |████████████████████████████████| 440kB 575kB/s
Installing collected packages: psutil, glances
  Running setup.py install for psutil ... done
  Running setup.py install for glances ... done
Successfully installed glances-3.1.0 psutil-5.6.3
3.3 installation of temperature monitoring tools
[root@manager01 ~]# yum -y install lm_sensors
3.4 installation of epel public network source
[root@manager01 ~]# yum install epel* -y
[root@manager01 ~]# yum -y install glances
4, glances monitoring
4.1. Enable glances monitoring
[root@manager01 ~]# glances
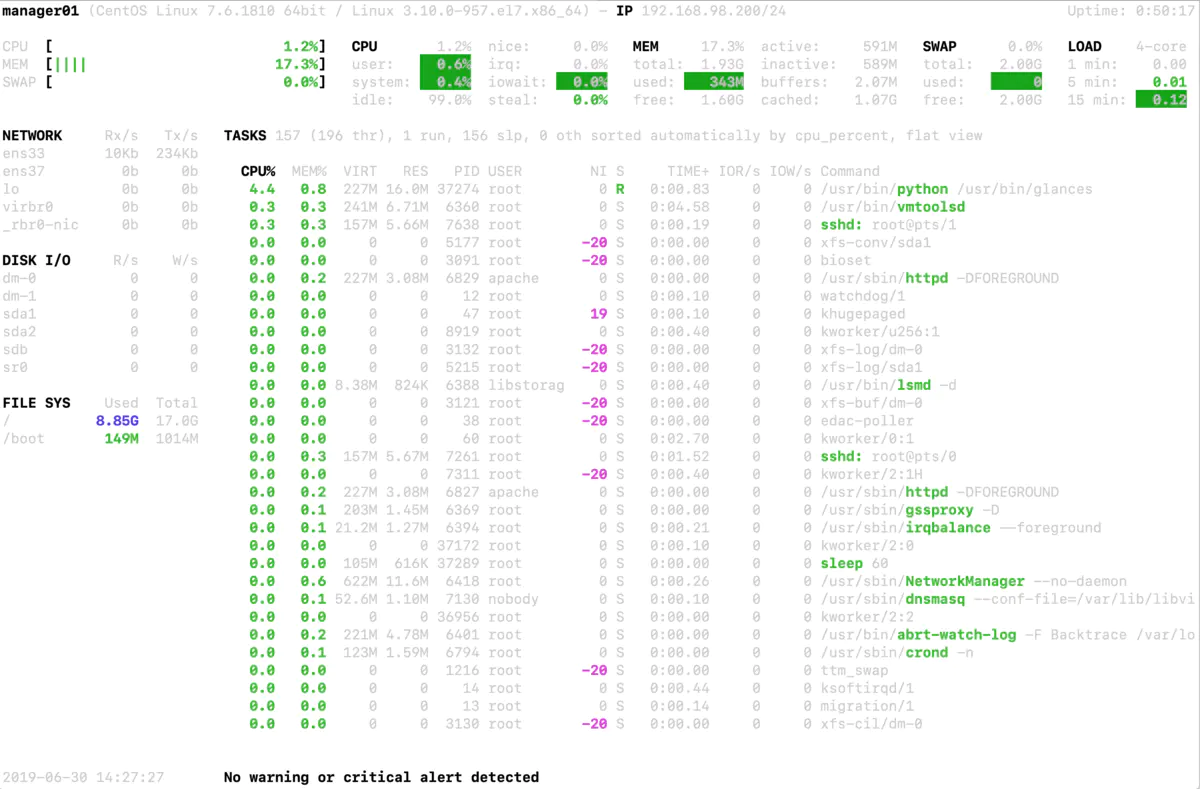
Description of glances working interface:
The upper part of the figure above shows the usage of CPU, Load, Mem and Swap. In the middle and upper part of the figure above are the usage of network interfaces and Processes. It usually includes the following fields:
 %CPU: The number of bytes occupied by this process CPU Utilization rate
 %MEM: The percentage of physical memory and total memory occupied by the process
 VIRT: Virtual memory size
 RES: The value of physical memory occupied by the process
 PID: process ID number
 USER: User name of the process owner
 NI: Process priority
 S: Process status, where S Indicates sleep, R Indicates that it is running, Z Indicates a dead state.
 TIME+: The total amount of time occupied since the process was started CPU time
 IO_R and IO_W: Reading and writing of processes I/O rate
 Command: Process name
On the left side of the figure above is the usage of network, disk IO and disk partition. In addition, glances can run the tool interactively. Users can use the following shortcut keys:
 h :  display help information
 q :  Exit program exit
 c : according to CPU The real-time load sorts the system processes
 m : Sort system processes by memory usage
 i: according to I/O Sort system processes by usage
 p:  Sort by process name
 d :  Display disk read / write status
 w :  Delete log file
 l : Show log
 s:  Display sensor information
 f :  Display system information
 1 : Show each in turn CPU Use of kernel (secondary option is only used in multi-core) CPU System)
4.2. Usage of glances
 glances Is a command line tool, including the following command options:
 -b: Display network connection speed Byte/ second
 -B @IP|host : Binding server side IP Address or host name
 -c @IP|host: connect glances Server side
 -C file: The default setting profile is /etc/glances/glances.conf
 -d: Close disk I/O modular
 -e: Display sensor temperature
 -f file: Set the output file (format is) HTML perhaps CSV)
 -m: Turn off the mounted disk module
 -n: Turn off the network module
 -p PORT: Set the running port to 61209 by default
 -P password: Set up client / Server password
 -s: set up glances The operation mode is server
 -t sec: Set the time interval of screen refresh in seconds. The default value is 2 seconds. The allowable range of values is 1~32767
 -h : display help information
 -v : display version information
5, Glaces C / S mode
glances also supports C/S mode monitoring. The monitored machine runs the server, and the monitoring end runs the client, which can realize remote monitoring.
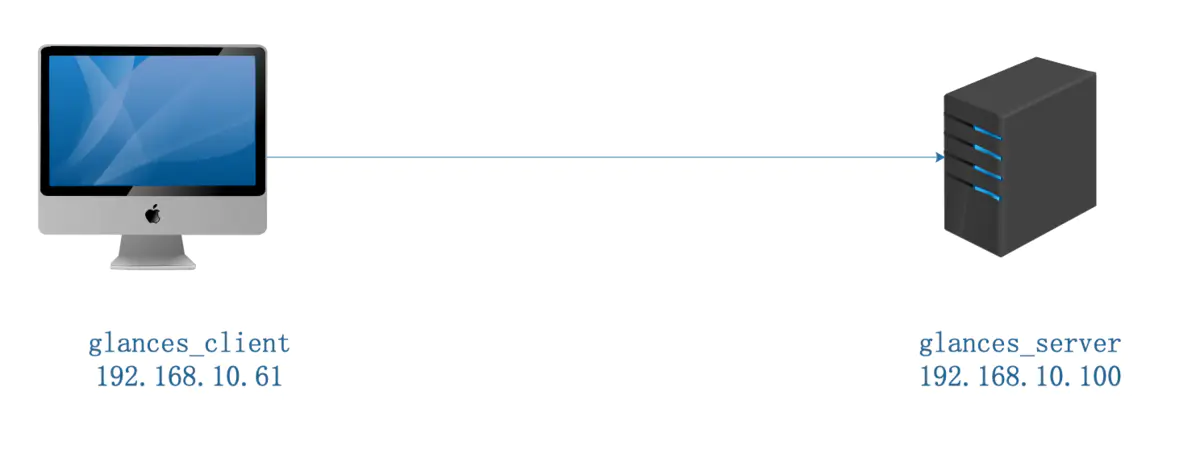
Note: the C/S mode can be implemented only when glaces is installed
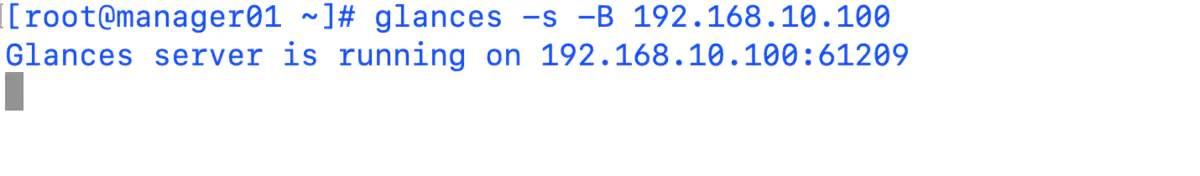
5.1. Server startup
The default port used by the server is 61209. If the server is used, please turn on the firewall.
5.2 client access
[root@node2 ~]# glances -c 192.168.10.100
6, Other data saving methods
Export data to CSV spreadsheet
[root@manager01 ~]# glances --export-csv /tmp/1.csv