Code address, logger branch: https://gitee.com/lsjWeiYi/go-admin/tree/logger/
Go admin's log system looks very detailed. It really records every process of the whole process, and it runs through the whole framework. It encapsulates a lot of modules. It is strongly coupled with the log system.
advantage:
- Rich logs are very helpful for the operation and maintenance of complex systems.
- Developers do not need to pay attention to the logging of http requests and database operations, but only the business
- For distributed systems, it can track the unique ID of the log of the same request.
Disadvantages:
- The coupling is in the whole framework and cannot be separated separately
- May consume system resources (unverified)
The log system is the core content of the project, but go admin runs it through the whole process, so first analyze the log system, and the later functions are coupled to it.
logger module
For obvious effect, first record the configuration modification of the log to the file:
  logger:
    # Log storage path
    path: temp/logs
    # Log output, file: file, default: command line, others: command line
    stdout: file #output to a file
    # Log level, trace, debug, info, warn, error, fatal
    level: info
    # Database log switch
    enableddb: false
Then, after starting the project, he will create a log file "2022-02-23.log" in the temp/logs directory
We run the system without enabling its log module and find that there is no log record. We open swagger and initiate a get request:
- When we do not explicitly log in the code, there is no log in the file.
- We explicitly call logging in the code. We can find that the log file records the log:
import "github.com/go-admin-team/go-admin-core/logger"

// Only relevant codes are extracted
name := c.DefaultQuery("name", "Default value")
logger.Info(name)
2022-02-23 09:31:15.554+0800 file:apis/health.go:23 level:info default
It is obvious that we can delete it in the second configuration file, because we can't find it in the log.
The log system we mentioned earlier is the implicit log of the system, which records http requests and database operation records. These processes are not documented in the business. It was recorded by the framework itself. Let's enable:
After entering swagger, I found that it recorded many logs:
2022-02-23 09:36:21.943+0800 file:middleware/logger.go:88 latencyTime:0s level:info method:GET statusCode:200 uri:/swagger/index.html x-request-id:c503e88a-9f2b-4604-b780-1cf296035dd3
2022-02-23 09:36:22.005+0800 file:middleware/logger.go:88 latencyTime:999.7µs level:info method:GET statusCode:200 uri:/swagger/swagger-ui-standalone-preset.js x-request-id:2138c91f-ef82-4855-af0c-7633e9d58cc8
2022-02-23 09:36:22.005+0800 file:middleware/logger.go:88 latencyTime:999.7µs level:info method:GET statusCode:200 uri:/swagger/swagger-ui.css x-request-id:018804aa-4277-477f-a85f-5f8b33ecc6bb
2022-02-23 09:36:22.007+0800 file:middleware/logger.go:88 latencyTime:2.4296ms level:info method:GET statusCode:200 uri:/swagger/swagger-ui-bundle.js x-request-id:c9b43b6a-7d32-4b09-a8c6-2b4abefe14ab
2022-02-23 09:36:22.312+0800 file:middleware/logger.go:88 latencyTime:0s level:info method:GET statusCode:200 uri:/swagger/favicon-16x16.png x-request-id:b13961dc-6aed-47d2-8294-5daf90faef80
2022-02-23 09:36:22.312+0800 file:middleware/logger.go:88 latencyTime:373.6µs level:info method:GET statusCode:200 uri:/swagger/doc.json x-request-id:d2f8a3ec-0e67-44b1-ad4f-e0d616386b13
You can see that the log information is very detailed. It's just that an ordinary request is recorded. We will launch the same get request again:
2022-02-23 09:39:07.677+0800 file:apis/health.go:23 latencyTime:0s level:info method:GET statusCode:200 uri:/swagger/favicon-16x16.png x-request-id:b13961dc-6aed-47d2-8294-5daf90faef80 Default value
2022-02-23 09:39:07.677+0800 file:middleware/logger.go:88 latencyTime:0s level:info method:GET statusCode:200 uri:/v1/health x-request-id:77172d62-b760-45ee-95d0-c0babe1bc3f9
You can see that two logs are recorded
- The first one is explicitly called by our code. It can be found that there are three words "default value", but the record is much more detailed than the original
- The second item should be the information recorded by default
Because this is a normal request, there is no specific log information. If there is an error, it will also be displayed in the log.
PS: in order to simplify the module, I deleted some record information that is not needed temporarily.
You think it's over here, not...
Generate request ID
After analyzing the code, it is found that the code also implements a middleware to generate request ID, but now the log clearly has x-request-id. why do you need it? Anyway, enable it to see the effect.
After enabling, look at the log. Ah, there are changes:
2022-02-23 10:10:32.998+0800 X-Request-Id:e7ad0ab0-d619-492a-849e-d2402a310bbc file:middleware/logger.go:88 latencyTime:0s level:info method:GET statusCode:200 uri:/swagger/index.html
2022-02-23 10:10:33.036+0800 X-Request-Id:22672be9-983f-4f44-911d-f1de71f748d2 file:middleware/logger.go:88 latencyTime:1.9961ms level:info method:GET statusCode:200 uri:/swagger/swagger-ui.css
2022-02-23 10:10:33.040+0800 X-Request-Id:c3c99d09-30e2-4549-8886-6ce18898e9be file:middleware/logger.go:88 latencyTime:2.8242ms level:info method:GET statusCode:200 uri:/swagger/swagger-ui-standalone-preset.js
2022-02-23 10:10:33.043+0800 X-Request-Id:b343e788-e3c1-4a5a-934b-7742f8712d07 file:middleware/logger.go:88 latencyTime:4.2873ms level:info method:GET statusCode:200 uri:/swagger/swagger-ui-bundle.js
2022-02-23 10:10:33.330+0800 X-Request-Id:0ed9cc72-1bad-48d1-b545-a81d27118044 file:middleware/logger.go:88 latencyTime:0s level:info method:GET statusCode:200 uri:/swagger/favicon-16x16.png
2022-02-23 10:10:33.330+0800 X-Request-Id:3255964f-1fb2-4236-a3b6-f2d4edbff28d file:middleware/logger.go:88 latencyTime:873.7µs level:info method:GET statusCode:200 uri:/swagger/doc.json
The X-Request-Id comes to the front and starts with uppercase. It seems that there is nothing different from others... Regardless of him, in short, it should be useful. There is no in-depth look at the source code.
It's not over yet..
_go-admin-logger-request
The middleware related to the log is also enabled in the code. I don't know what to do. Let's enable it first:
Good guy, after this is enabled again, I find that the log will be the same when the log module is just enabled. It's amazing, so what are these two things exactly. Wonder, I don't understand the logic of the source code for the time being. Put it first, and then add it when there is progress in the future.
code churn
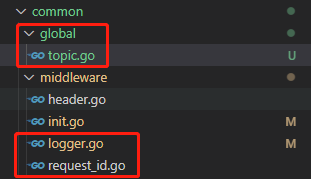
First of all, we should understand that these modules mentioned above are from middleware. Then, the initialization of middleware, as described earlier, is placed in "common / Middleware / init. Go":
func InitMiddleware(r *gin.Engine) {
	// Add requestID
	r.Use(RequestId(pkg.TrafficKey)) // newly added
	// Add go admin logger request
	r.Use(api.SetRequestLogger) // newly added
	// Log processing
	r.Use(LoggerToFile()) // newly added

	// Cross domain processing
	r.Use(Options)
	// Secure is a middleware function that appends security
	r.Use(Secure)
}
Three middleware are added, and then the following codes are added:
When you have time and need, analyze the code again.