1, Reference link
Alibaba open source mirror station OPSX mirror station Alibaba cloud developer community
What does grafana do_ Grafana Download_ Grafana features
2, Introduction to Grafana
What is Grafana
Grafana is a visual Dashboard with beautiful charts and layout display, fully functional measurement Dashboard and graphic editor. Support Graphite, zabbix, InfluxDB, Prometheus and OpenTSDB as data sources.
Grafana features
- 1. grafana has fast and flexible client charts. The panel plug-ins have many different visual indicators and logs. The official library has a wealth of dashboard plug-ins, such as heat map, line chart, chart and other display methods, which makes our complex data display beautiful and elegant.
- 2. Grafana supports many different time series data (data sources) storage backend. Each data source has a specific query editor. The following data sources are officially supported: Graphite, infoxdb, opensdb, prometheus, elasticsearch and cloudwatch. The query language and function of each data source are obviously different. You can combine data from multiple data sources into one dashboard, but each panel should be bound to a specific data source belonging to a specific organization
- 3. Alerts in grafana allow you to attach rules to dashboard panels. When you save the dashboard, Gravana extracts the alert rules into a separate alert rule store and schedules them for evaluation. The alarm message can also be pushed to the mobile terminal through nails, mailboxes, etc. But at present, grafana only supports the alarm of graph panel.
- 4. Grafana uses rich event annotation charts from different data sources. Hovering over the event will display complete event metadata and tags;
- 5. Grafana's use of ad hoc filters allows dynamic creation of new key / value filters that are automatically applied to all queries using the data source.
3, Grafana installation steps
< font color = Red > this experiment is based on CentOS 7.9 < / font >
1. Basic environment configuration
Modify host name
[root@localhost ~]# hostnamectl set-hostname grafana
[root@localhost ~]# bash
[root@grafana ~]# hostnamectl
   Static hostname: grafana
         Icon name: computer-vm
           Chassis: vm
        Machine ID: db3692199b194e6b9ac9f92ef24f9c6e
           Boot ID: 56bd71938e91499ca3106ce091c032ef
    Virtualization: vmware
  Operating System: CentOS Linux 7 (Core)
       CPE OS Name: cpe:/o:centos:centos:7
            Kernel: Linux 3.10.0-1160.el7.x86_64
      Architecture: x86-64
Turn off firewall and SElinux security mode
systemctl stop firewalld
systemctl disable firewalld
[root@grafana ~]# setenforce 0
[root@grafana ~]# getenforce
Permissive
Configure network card information
[root@grafana ~]# vi /etc/sysconfig/network-scripts/ifcfg-ens32
[root@grafana ~]# cat /etc/sysconfig/network-scripts/ifcfg-ens32
TYPE=Ethernet
PROXY_METHOD=none
BROWSER_ONLY=no
BOOTPROTO=static
DEFROUTE=yes
IPV4_FAILURE_FATAL=no
IPV6INIT=yes
IPV6_AUTOCONF=yes
IPV6_DEFROUTE=yes
IPV6_FAILURE_FATAL=no
IPV6_ADDR_GEN_MODE=stable-privacy
NAME=ens32
DEVICE=ens32
ONBOOT=yes
IPADDR=192.168.200.100
PREFIX=24
GATEWAY=192.168.200.1
DNS1=114.114.114.114
DNS2=192.168.200.1
Configure alicloud CentOS image source
[root@grafana yum.repos.d]# curl -o /etc/yum.repos.d/CentOS-Base.repo https://mirrors.aliyun.com/repo/Centos-7.repo
  % Total    % Received % Xferd  Average Speed   Time    Time     Time  Current
                                 Dload  Upload   Total   Spent    Left  Speed
100  2523  100  2523    0     0  14587      0 --:--:-- --:--:-- --:--:-- 14668
[root@grafana yum.repos.d]# ll
total 4
drwxr-xr-x. 2 root root  220 Feb 11 12:27 bak
-rw-r--r--. 1 root root 2523 Feb 11 12:27 CentOS-Base.repo
[root@grafana yum.repos.d]# yum clean all
[root@grafana yum.repos.d]# yum makecache
[root@grafana yum.repos.d]# yum repolist
Update CentOS system
[root@grafana ~]# yum update
2. Grafana Download
New / etc / yum.com repos. d/grafana. Repo, the content is
[grafana]
name=grafana
baseurl=https://mirrors.aliyun.com/grafana/yum/rpm
repo_gpgcheck=0
enabled=1
gpgcheck=0
 Press:wq Save and exit.

#Clear YUM cache
yum makecache

#Load YUM image source
yum repolist
3. Grafana installation
[root@grafana ~]# yum install grafana-enterprise
[root@grafana ~]# rpm -qa | grep grafana
grafana-enterprise-8.3.4-1.x86_64
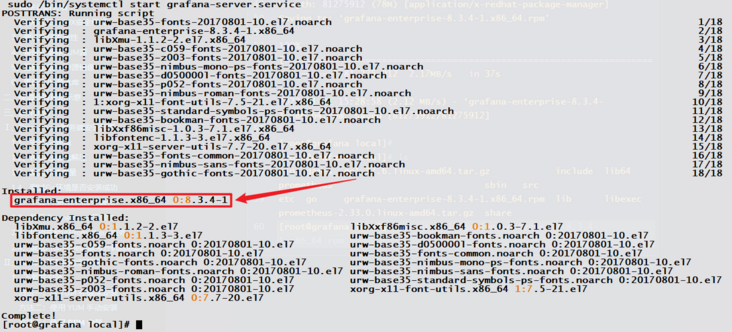
4. Start Grafana service
[root@grafana ~]# systemctl daemon-reload
[root@grafana ~]# systemctl start grafana-server
[root@grafana ~]# systemctl enable grafana-server
[root@grafana ~]# systemctl status grafana-server
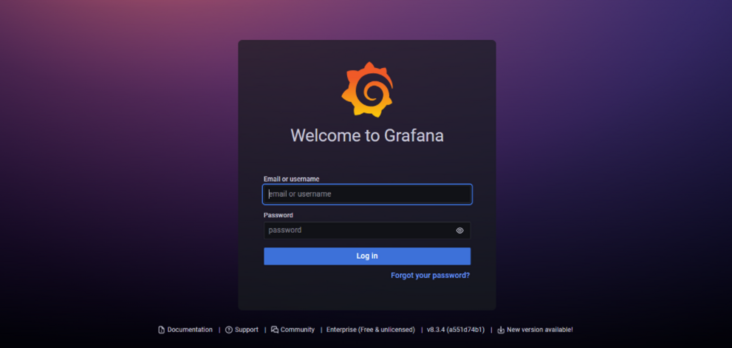
5. Accessing the Grafana Web control panel
Open the browser and enter http://192.168.200.100:3000 (the port is 3000), open the Grafana control panel, < font color = "green" > the initial default account and password are < font color = "red" > admin < / font >, and the password needs to be modified for the first login</ font>
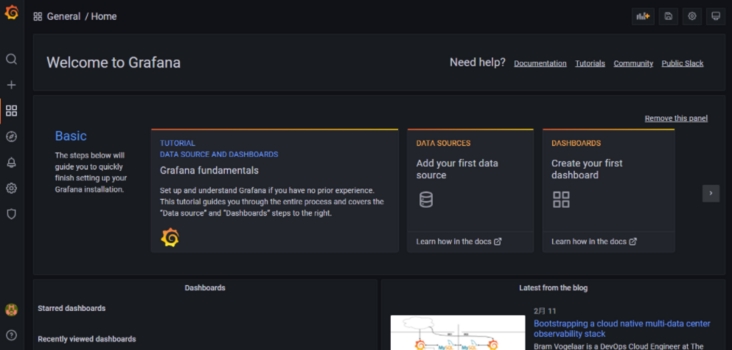
At this point, Grafana installation is complete.