Hello, I'm Zhang Jintao.
In this article, I will introduce you a tool - k6, which has no direct relationship with K8s. It is an open source performance pressure testing tool.
The story behind k6
In August 2016, k6 released its first version on GitHub. So far, an excellent open source load measurement tool has entered people's vision.
June 2021 is a big day for grafana and k6. Grafana Labs acquired k6.
In fact, the fate between Grafana and k6 dates back to two years earlier.
In 2019, during the pressure test of short-term token refresh behavior of Grafana 6.0, Grafana Labs conducted a series of technology selection.
Since most of the back-end software of Grafana Labs is implemented by Go, k6 happens to meet the needs of OSS and Go, and the load test is written in JS (both Grafana front-end framework and UI are used). This makes k6 continuously complete the task of tracking bug s for Grafana developers and testers since Grafana version 6.0.

Figure 1, k6 adding Grafana Labs
Various pressure measuring tools
A handy automatic load testing tool will greatly improve the code quality and efficiency of program developers.
The following figure shows some common tools used for load pressure measurement. We can see on GitHub that at present, the projects with frequent and active updates mainly include Gatling, Jmeter and k6.

Figure 2, pressure measuring tools
How to choose from them is simply a competition of tool efficiency. Mainly from the following two aspects:
- Tool performance
- Tool experience
The following figure gives a simple comparison of the above tools.
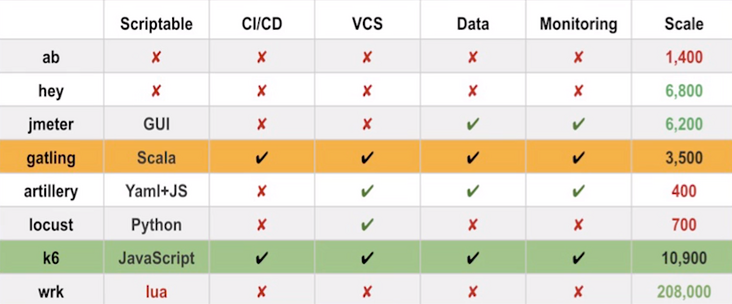
Here I mainly compare the three more active projects.
- JMeter - small partners familiar with Java may know this tool better. Due to its long existence, JMeter has the most comprehensive functions among them, and the integration and add-on components are better. The SaaS service Blazemeter based on it is familiar to everyone. This also leads to a great problem, the complexity of use is high and not lightweight enough;
- Gatling - Gatling also has the SaaS product Gatling Frontline. In terms of the use threshold, JS is much lower than Scala;
- k6 - k6 was originally developed and maintained by several employees of SaaS service Load Impact. The use threshold is low (JS), parameterization is simpler, and the concept of "load test is code" also makes its maintenance cost lower. It can be expected in the future.
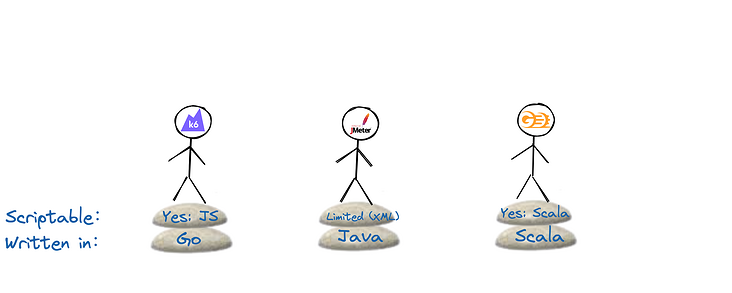
Figure 3. Comparison of three popular tools
Execution effect
Or this:
Installation k6
k6 is developed in Go language. The steps to install k6 are very simple. Just download the binary file directly on the Release page of GitHub. For example:
(MoeLove) ➜ wget -q https://github.com/grafana/k6/releases/download/v0.35.0/k6-v0.35.0-linux-amd64.tar.gz
(MoeLove) ➜ tar -xzf k6-v0.35.0-linux-amd64.tar.gz
(MoeLove) ➜ ls
k6-v0.35.0-linux-amd64  k6-v0.35.0-linux-amd64.tar.gz
(MoeLove) ➜ mv ./k6-v0.35.0-linux-amd64/k6 ~/bin/k6
(MoeLove) ➜ k6 version
k6 v0.35.0 (2021-11-17T09:53:18+0000/1c44b2d, go1.17.3, linux/amd64)
Or you can directly use its Docker image:
➜  ~ docker run  --rm loadimpact/k6  version
k6 v0.35.0 (2021-11-17T09:53:03+0000/1c44b2d, go1.17.3, linux/amd64)
Core concept
There are not many concepts in k6. The most important one is the virtual users (VUs) used to execute tests. Its essence is the number of concurrent tasks.
When using k6 to execute tests, you can specify -- vus or - u. the default is 1.
Hands on practice
I personally feel k6 that among the current mainstream pressure measurement tools, the user experience is better. It is convenient to use JS (ES6) as the configuration language. Let's do some examples.
Simple request
When making http requests, we only need to import http from k6/http.
Note that in k6, there must be a default function as the entry by default, which is similar to the main function we often use.
import http from "k6/http";

export default function(){
  http.get("https://test-api.k6.io/public/crocodiles/")
}
The effects after implementation are as follows:
(MoeLove) ➜ k6 run simple_http_get.js

          /\      |‾‾| /‾‾/   /‾‾/
     /\  /  \     |  |/  /   /  /
    /  \/    \    |     (   /   ‾‾\
   /          \   |  |\  \ |  (‾)  |
  / __________ \  |__| \__\ \_____/ .io

  execution: local
     script: simple_http_get.js
     output: -

  scenarios: (100.00%) 1 scenario, 1 max VUs, 10m30s max duration (incl. graceful stop):
           * default: 1 iterations for each of 1 VUs (maxDuration: 10m0s, gracefulStop: 30s)


running (00m01.1s), 0/1 VUs, 1 complete and 0 interrupted iterations
default ✓ [======================================] 1 VUs  00m01.1s/10m0s  1/1 iters, 1 per VU

     data_received..................: 6.3 kB 5.7 kB/s
     data_sent......................: 634 B  578 B/s
     http_req_blocked...............: avg=848.34ms min=848.34ms med=848.34ms max=848.34ms p(90)=848.34ms p(95)=848.34ms
     http_req_connecting............: avg=75.59µs  min=75.59µs  med=75.59µs  max=75.59µs  p(90)=75.59µs  p(95)=75.59µs
     http_req_duration..............: avg=247.46ms min=247.46ms med=247.46ms max=247.46ms p(90)=247.46ms p(95)=247.46ms
       { expected_response:true }...: avg=247.46ms min=247.46ms med=247.46ms max=247.46ms p(90)=247.46ms p(95)=247.46ms
     http_req_failed................: 0.00%  ✓ 0        ✗ 1
     http_req_receiving.............: avg=455.24µs min=455.24µs med=455.24µs max=455.24µs p(90)=455.24µs p(95)=455.24µs
     http_req_sending...............: avg=103.77µs min=103.77µs med=103.77µs max=103.77µs p(90)=103.77µs p(95)=103.77µs
     http_req_tls_handshaking.......: avg=848.07ms min=848.07ms med=848.07ms max=848.07ms p(90)=848.07ms p(95)=848.07ms
     http_req_waiting...............: avg=246.9ms  min=246.9ms  med=246.9ms  max=246.9ms  p(90)=246.9ms  p(95)=246.9ms
     http_reqs......................: 1      0.911502/s
     iteration_duration.............: avg=1.09s    min=1.09s    med=1.09s    max=1.09s    p(90)=1.09s    p(95)=1.09s
     iterations.....................: 1      0.911502/s
     vus............................: 1      min=1      max=1
     vus_max........................: 1      min=1      max=1
k6 will output the executed result to the terminal by default. At the same time, it comes with some indicators that will be output at the same time.
These indicators are basically semantic. You can understand their meaning by looking at the name. I won't introduce them one by one here.
Request with check
We can add some tests to the request to judge whether the response value of the interface meets our expectations. As follows:
import http from "k6/http";
import { check, group } from "k6";

export default function() {

    group("GET", function() {
        let res = http.get("http://httpbin.org/get?verb=get");
        check(res, {
            "status is 200": (r) => r.status === 200,
            "is verb correct": (r) => r.json().args.verb === "get",
        });
    });
}
The check function is introduced to execute some judgment logic. Of course, the above = = > is actually a abbreviation in ES6. It can also be expanded into a normal function. For example:
import http from "k6/http";
import { check, group } from "k6";
export default function() {
group("GET", function() {
let res = http.get("http://httpbin.org/get?verb=get");
check(res, {
"status is 200": function(r){
return r.status === 200
},
"is verb correct": (r) => r.json().args.verb === "get",
});
});
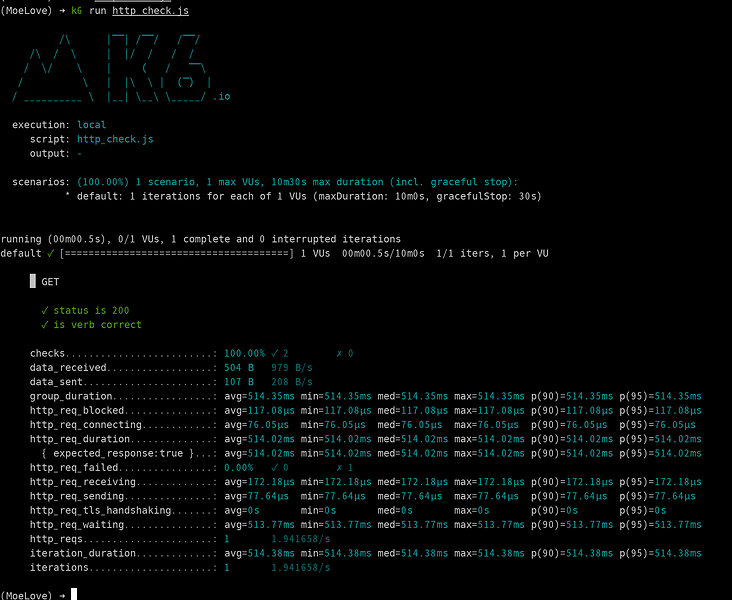
}After using k6 to execute this script, the output is as follows:
     █ GET

       ✓ status is 200
       ✓ is verb correct

     checks.........................: 100.00% ✓ 2        ✗ 0
From here, we can see whether the test of the current request interface has passed (which can also be used to judge whether the current interface can provide services normally).
Custom indicator output
Next, we try to define some of our own indicators in the pressure measurement process. You only need to import some different types of indicators from k6/metrics. This is basically the same as the type in Prometheus.
Here I added two metric. A testCounter is used to count the total number of tests executed, and passedRate calculates the pass rate.
import http from "k6/http";
import { Counter, Rate } from "k6/metrics";
import { check, group } from "k6";


let testCounter = new Counter("test_counter");
let passedRate = new Rate("passed_rate");

export default function() {

    group("GET", function() {
        let res = http.get("http://httpbin.org/get?verb=get");
        let passed = check(res, {
            "status is 200": (r) => r.status === 200,
            "is verb correct": (r) => r.json().args.verb === "get",
        });

        testCounter.add(1);
        passedRate.add(passed);
    });
}
Here we set two VU S and set the execution process to 10s. The output after execution is as follows:
(MoeLove) ➜ k6 run -u 2 -d 10s  simple_custom_metrics.js
...
  execution: local
     script: simple_custom_metrics.js
     output: -

  scenarios: (100.00%) 1 scenario, 2 max VUs, 40s max duration (incl. graceful stop):
           * default: 2 looping VUs for 10s (gracefulStop: 30s)


running (10.4s), 0/2 VUs, 36 complete and 0 interrupted iterations
default ✓ [======================================] 2 VUs  10s

     █ GET

       ✓ status is 200
       ✓ is verb correct

     checks.........................: 100.00% ✓ 72       ✗ 0
     data_received..................: 18 kB   1.7 kB/s
     data_sent......................: 3.9 kB  372 B/s
     group_duration.................: avg=567.35ms min=440.56ms med=600.52ms max=738.73ms p(90)=620.88ms p(95)=655.17ms
     http_req_blocked...............: avg=266.72µs min=72.33µs  med=135.14µs max=776.66µs p(90)=644.4µs  p(95)=719.96µs
     http_req_connecting............: avg=170.04µs min=45.51µs  med=79.9µs   max=520.69µs p(90)=399.41µs p(95)=463.55µs
     http_req_duration..............: avg=566.82ms min=439.69ms med=600.31ms max=738.16ms p(90)=620.52ms p(95)=654.61ms
       { expected_response:true }...: avg=566.82ms min=439.69ms med=600.31ms max=738.16ms p(90)=620.52ms p(95)=654.61ms
     http_req_failed................: 0.00%   ✓ 0        ✗ 36
     http_req_receiving.............: avg=309.13µs min=122.4µs  med=231.72µs max=755.3µs  p(90)=597.95µs p(95)=641.92µs
     http_req_sending...............: avg=80.69µs  min=20.47µs  med=38.91µs  max=235.1µs  p(90)=197.87µs p(95)=214.79µs
     http_req_tls_handshaking.......: avg=0s       min=0s       med=0s       max=0s       p(90)=0s       p(95)=0s
     http_req_waiting...............: avg=566.43ms min=439.31ms med=600.16ms max=737.8ms  p(90)=620.19ms p(95)=654.18ms
     http_reqs......................: 36      3.472534/s
     iteration_duration.............: avg=567.38ms min=440.62ms med=600.53ms max=738.75ms p(90)=620.89ms p(95)=655.2ms
     iterations.....................: 36      3.472534/s
     passed_rate....................: 100.00% ✓ 36       ✗ 0
     test_counter...................: 36      3.472534/s
     vus............................: 2       min=2      max=2
     vus_max........................: 2       min=2      max=2
You can see two more lines in the output:
     passed_rate....................: 100.00% ✓ 36       ✗ 0
     test_counter...................: 36      3.472534/s
In line with our expectations.
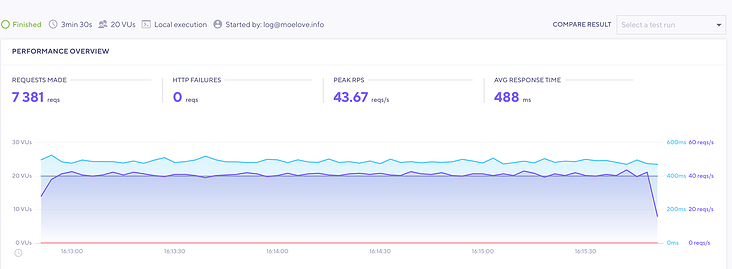
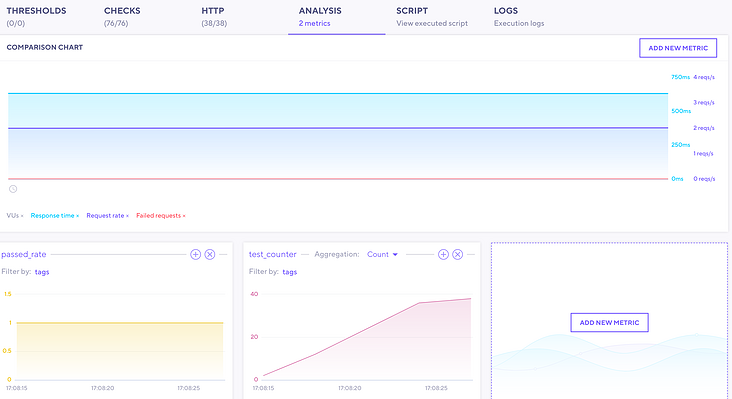
However, it doesn't seem intuitive enough. We can try to use k6 Cloud to show the results. After logging in, you can see all the indicators on the cloud as long as you specify the output to the cloud through - o cloud when executing k6
summary
This article mainly introduces a modern pressure measuring tool with relatively good user experience k6. I am currently planning to introduce it into the CI of our project to understand the impact of each core part change on project performance.
If the follow-up progress is successful, we will share k6 how to apply it to CI environment. Please look forward to it.
Welcome to subscribe my official account number [MoeLove].