
Author: Han Xinzi@ShowMeAI
Tutorial address: http://www.showmeai.tech/tutorials/84
Article address: http://www.showmeai.tech/article-detail/180
Notice: All Rights Reserved. Please contact the platform and the author for reprint and indicate the source
1.Spark machine learning workflow
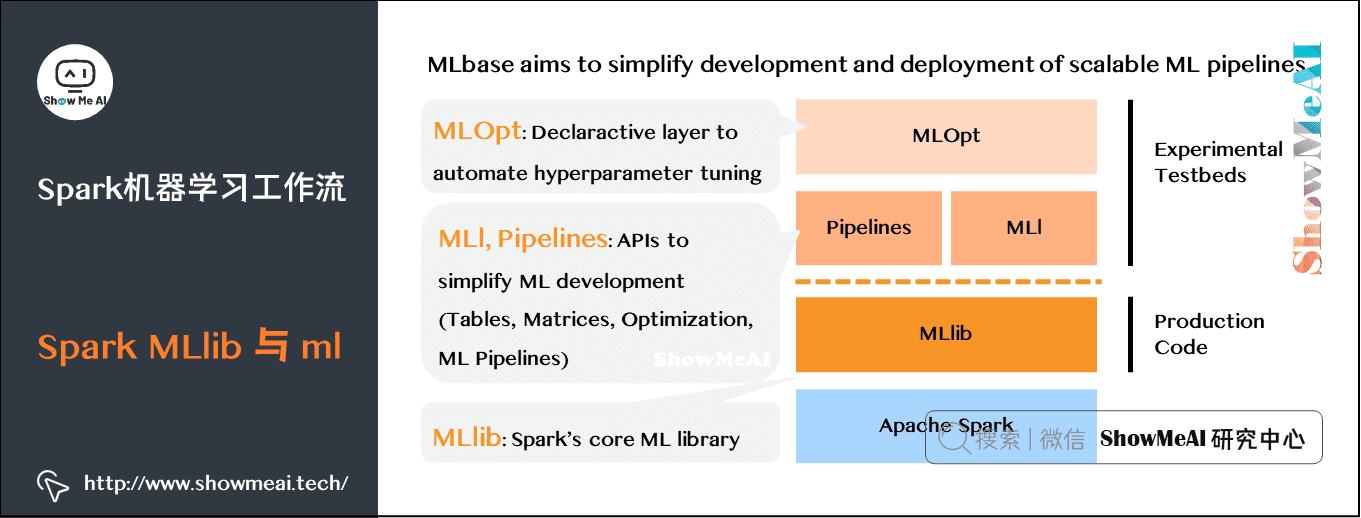
1) Spark mllib and ml
Spark also has MLlib/ML for big data machine learning, which can support the modeling and application of massive data.
2) Machine learning workflow (Pipeline)
A typical machine learning process starts from data collection and needs to go through multiple steps to get the required output. It is a multi-step pipelined work:
- Source data ETL (extract, transform, load)
- Data preprocessing
- Index extraction
- Model training and cross validation
- New data forecast
MLlib is simple enough to use, but in some cases, using MLlib will make the program structure complex and difficult to understand and implement.
- The structure of the target data set is complex and needs to be processed many times.
- When predicting new data, it is necessary to combine multiple trained single models for comprehensive prediction. ML Pipeline introduced after spark version 1.2 can be used to build complex machine learning workflow applications.
The following is an explanation of several important concepts:
(1)DataFrame
The DataFrame in Spark SQL is used as the data set, which can accommodate various data types. Compared with RDD, DataFrame contains schema information, which is more similar to two-dimensional tables in traditional databases.
It is used by ML Pipeline to store source data. For example, the columns in DataFrame can be stored text, feature vector, real label and predicted label.
(2) Transformer
Is an algorithm that can convert one DataFrame into another. For example, a model is a Transformer, which can label a test data set DataFrame without prediction label and convert it into another DataFrame with prediction label.
Technically, Transformer implements a method transform(), which converts one DataFrame into another by attaching one or more columns.
(3) Estimator (estimator / evaluator)
It is the conceptual abstraction of learning algorithm or training method on training data. Pipeline is usually used to manipulate DataFrame data and produce a Transformer. Technically, Estimator implements a method fit(), which accepts a DataFrame and generates a Transformer converter.
(4)Parameter
Parameter is used to set the parameters of Transformer or Estimator. All transformers and estimators can now share a common API for specifying parameters. ParamMap is a set of (parameter, value) pairs.
(5) Pipeline (workflow / pipeline)
Workflow connects multiple workflow stages (Transformer converter and Estimator) to form a machine learning workflow and obtain the result output.
3) Build a Pipeline workflow
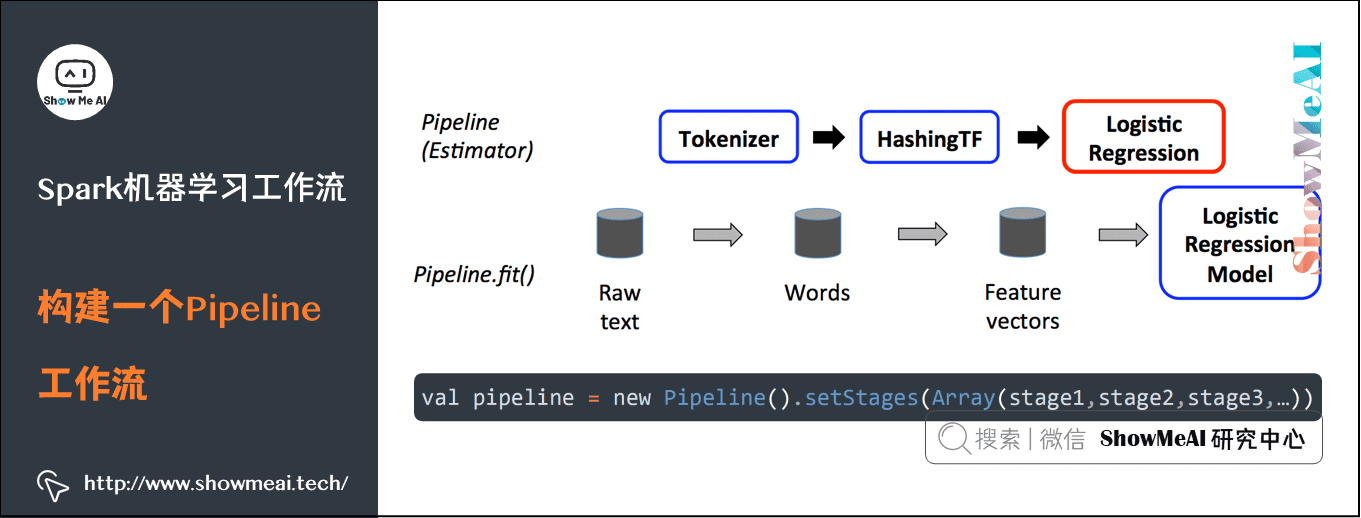
val pipeline = new Pipeline().setStages(Array(stage1,stage2,stage3,...))
① First, you need to define each pipelinestage (workflow stage) in the Pipeline.
- Including Transformer converter and Estimator evaluator.
- Such as index extraction and transformation model training.
- With these Transformer converters and Estimator evaluators that deal with specific problems, you can orderly organize PipelineStages and create a Pipeline according to specific processing logic.
② Then, you can take the training data set as an input parameter and call the fit method of the Pipelin instance to start processing the source training data in a stream manner.
- This call returns an instance of the PipelineModel class, which is then used to predict the label of the test data
③ Each stage of the workflow runs in sequence, and the input DataFrame is transformed as it passes through each stage.
- For the Transformer converter phase, call the transform() method on the DataFrame.
- For the Estimator estimator phase, the fit() method is called to generate a converter (which becomes part of the PipelineModel or a fitted Pipeline), and the transform() method of the converter is called in the DataFrame.
4) Build Pipeline example
- Get data set and code → official GitHub of ShowMeAI https://github.com/ShowMeAI-Hub/awesome-AI-cheatsheets
- Running code segment and learning → online programming environment http://blog.showmeai.tech/python3-compiler
from pyspark.ml import Pipeline
from pyspark.ml.classification import LogisticRegression
from pyspark.ml.feature import HashingTF, Tokenizer

# Prepare training documents from a list of (id, text, label) tuples.
training = spark.createDataFrame([
    (0, "a b c d e spark", 1.0),
    (1, "b d", 0.0),
    (2, "spark f g h", 1.0),
    (3, "hadoop mapreduce", 0.0)
], ["id", "text", "label"])

# Configure an ML pipeline, which consists of three stages: tokenizer, hashingTF, and lr.
tokenizer = Tokenizer(inputCol="text", outputCol="words")
hashingTF = HashingTF(inputCol=tokenizer.getOutputCol(), outputCol="features")
lr = LogisticRegression(maxIter=10, regParam=0.001)
pipeline = Pipeline(stages=[tokenizer, hashingTF, lr])

# Fit the pipeline to training documents.
model = pipeline.fit(training)

# Prepare test documents, which are unlabeled (id, text) tuples.
test = spark.createDataFrame([
    (4, "spark i j k"),
    (5, "l m n"),
    (6, "spark hadoop spark"),
    (7, "apache hadoop")
], ["id", "text"])

# Make predictions on test documents and print columns of interest.
prediction = model.transform(test)
selected = prediction.select("id", "text", "probability", "prediction")
for row in selected.collect():
    rid, text, prob, prediction = row  # type: ignore
    print(
        "(%d, %s) --> prob=%s, prediction=%f" % (
            rid, text, str(prob), prediction   # type: ignore
        )
    )
2. Spark ML Feature Engineering Based on DataFrame
- Get data set and code → official GitHub of ShowMeAI https://github.com/ShowMeAI-Hub/awesome-AI-cheatsheets
- Running code segment and learning → online programming environment http://blog.showmeai.tech/python3-compiler
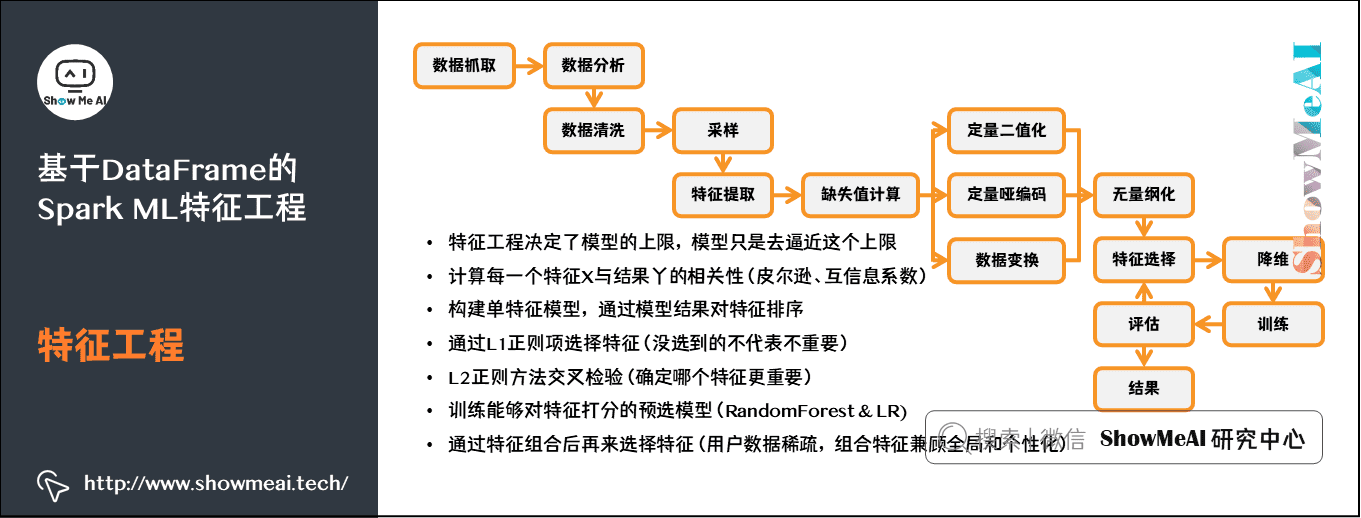
1) Characteristic Engineering
2) Binarization
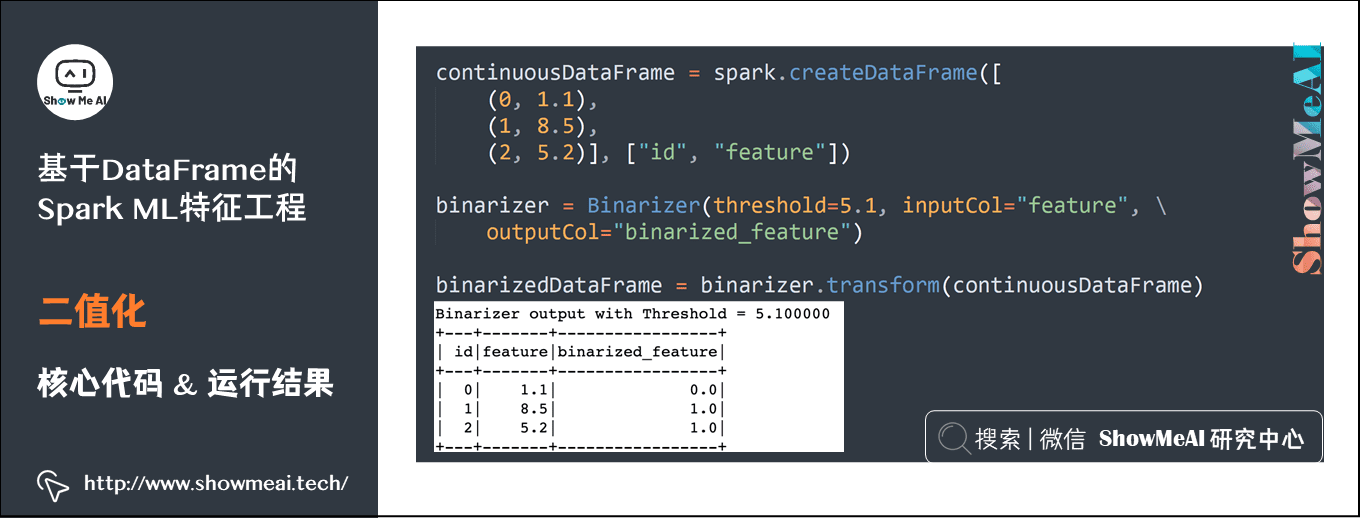
continuousDataFrame = spark.createDataFrame([(0, 1.1),(1, 8.5),(2, 5.2)], ["id", "feature"])
binarizer = Binarizer(threshold=5.1, inputCol="feature", outputCol="binarized_feature")
binarizedDataFrame = binarizer.transform(continuousDataFrame)
3) Definite boundary discretization
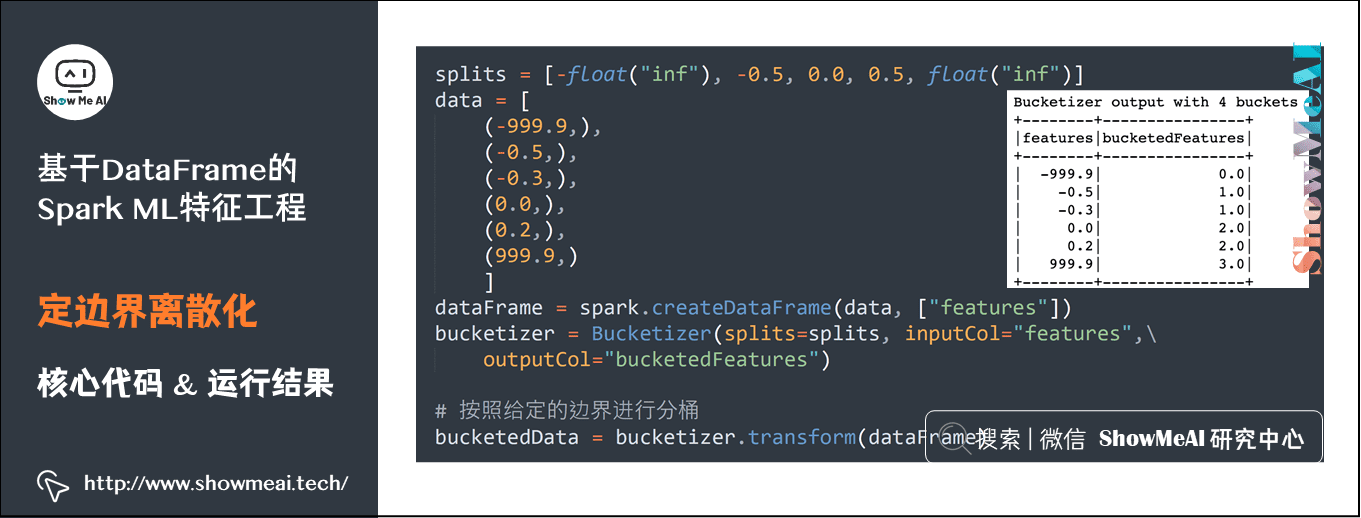
splits = [-float("inf"), -0.5, 0.0, 0.5, float("inf")]
data = [(-999.9,),(-0.5,),(-0.3,),(0.0,),(0.2,),(999.9,)]
dataFrame = spark.createDataFrame(data, ["features"])
bucketizer = Bucketizer(splits=splits, inputCol="features", outputCol="bucketedFeatures")

# Divide barrels according to the given boundary
bucketedData = bucketizer.transform(dataFrame)
4) Discretization according to quantile
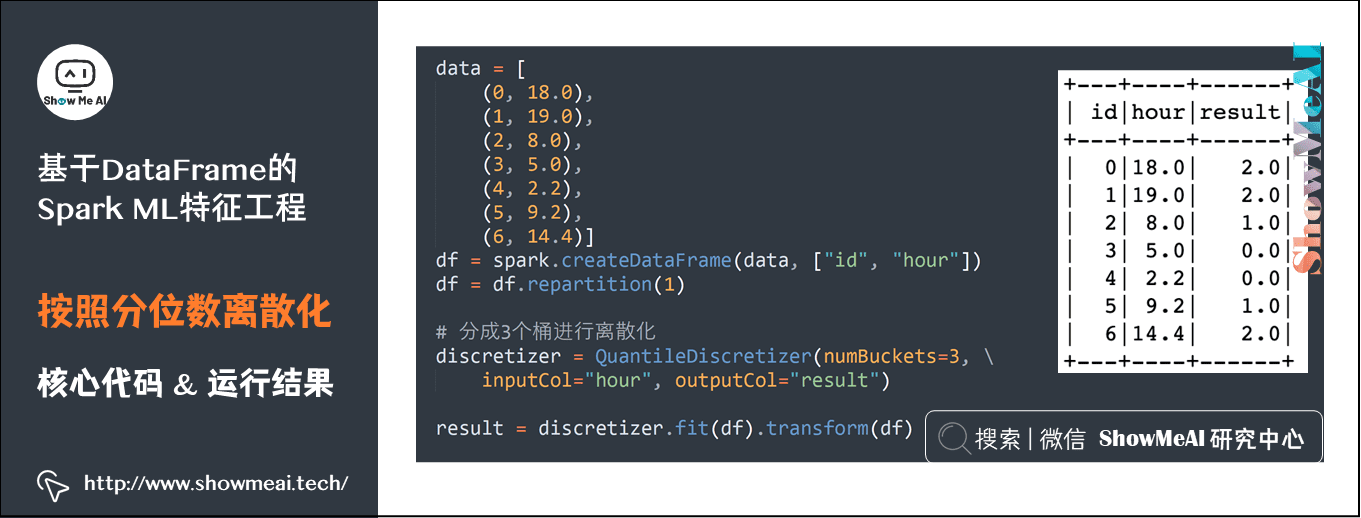
data = [(0, 18.0), (1, 19.0), (2, 8.0), (3, 5.0), (4, 2.2), (5, 9.2), (6, 14.4)]
df = spark.createDataFrame(data, ["id", "hour"])
df = df.repartition(1)

# Divided into 3 buckets for discretization
discretizer = QuantileDiscretizer(numBuckets=3, inputCol="hour", outputCol="result")
result = discretizer.fit(df).transform(df)
5) Continuous value amplitude scaling
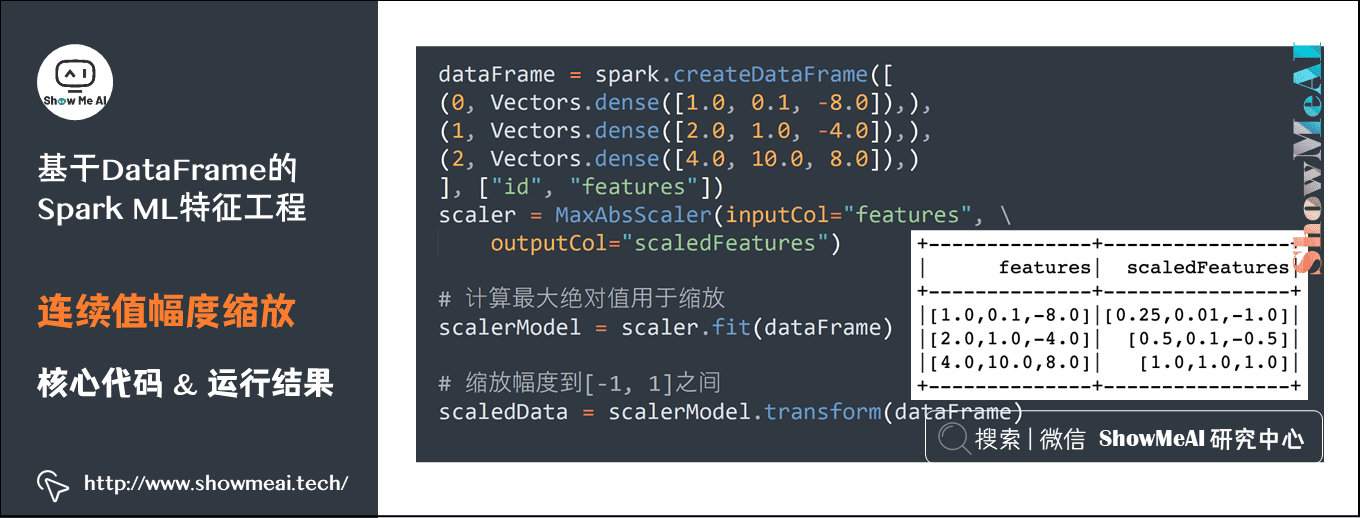
dataFrame = spark.createDataFrame([
(0, Vectors.dense([1.0, 0.1, -8.0]),),
(1, Vectors.dense([2.0, 1.0, -4.0]),),
(2, Vectors.dense([4.0, 10.0, 8.0]),)
], ["id", "features"])
scaler = MaxAbsScaler(inputCol="features", outputCol="scaledFeatures")

# Calculate the maximum absolute value for scaling
scalerModel = scaler.fit(dataFrame)

# Zoom to [- 1, 1]
scaledData = scalerModel.transform(dataFrame)
6) Standardization
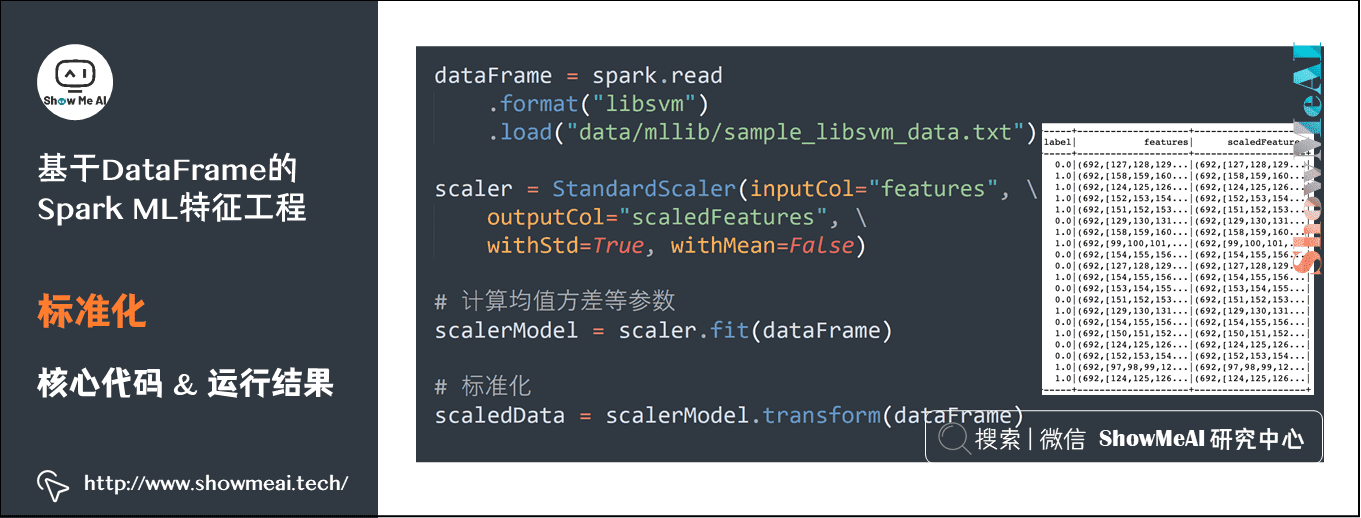
dataFrame = spark.read.format("libsvm").load("data/mllib/sample_libsvm_data.txt")
scaler = StandardScaler(inputCol="features", outputCol="scaledFeatures", withStd=True, withMean=False)

# Calculate the mean variance and other parameters
scalerModel = scaler.fit(dataFrame)

# Standardization
scaledData = scalerModel.transform(dataFrame)
7) Add polynomial feature
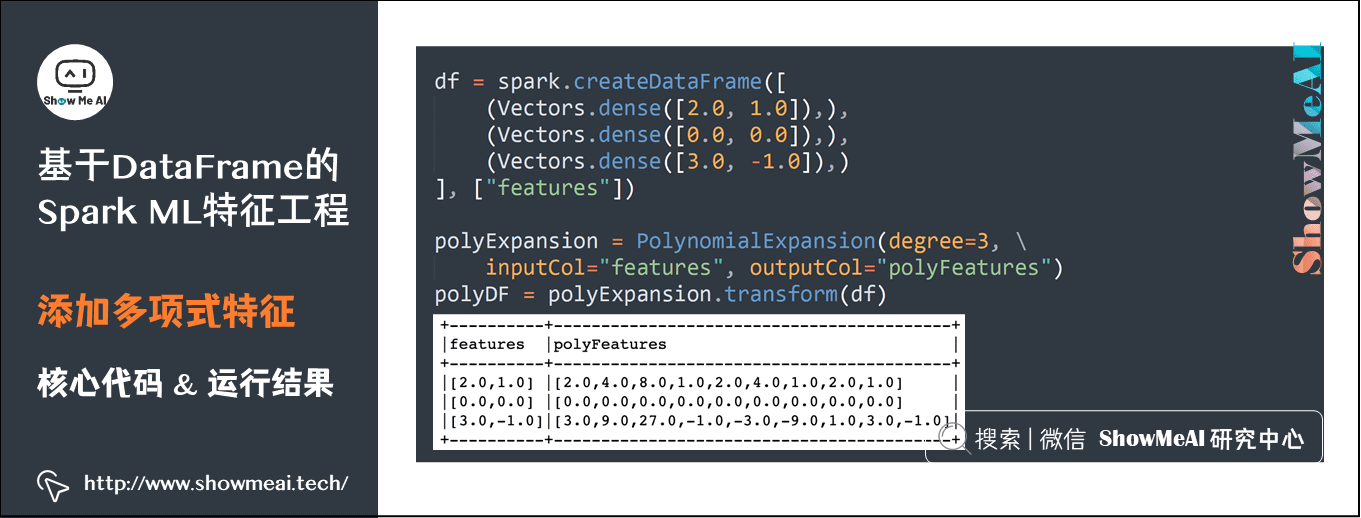
df = spark.createDataFrame([(Vectors.dense([2.0, 1.0]),), (Vectors.dense([0.0, 0.0]),), (Vectors.dense([3.0, -1.0]),)], ["features"])
polyExpansion = PolynomialExpansion(degree=3, inputCol="features", outputCol="polyFeatures")
polyDF = polyExpansion.transform(df)
8) Category independent heat vector coding
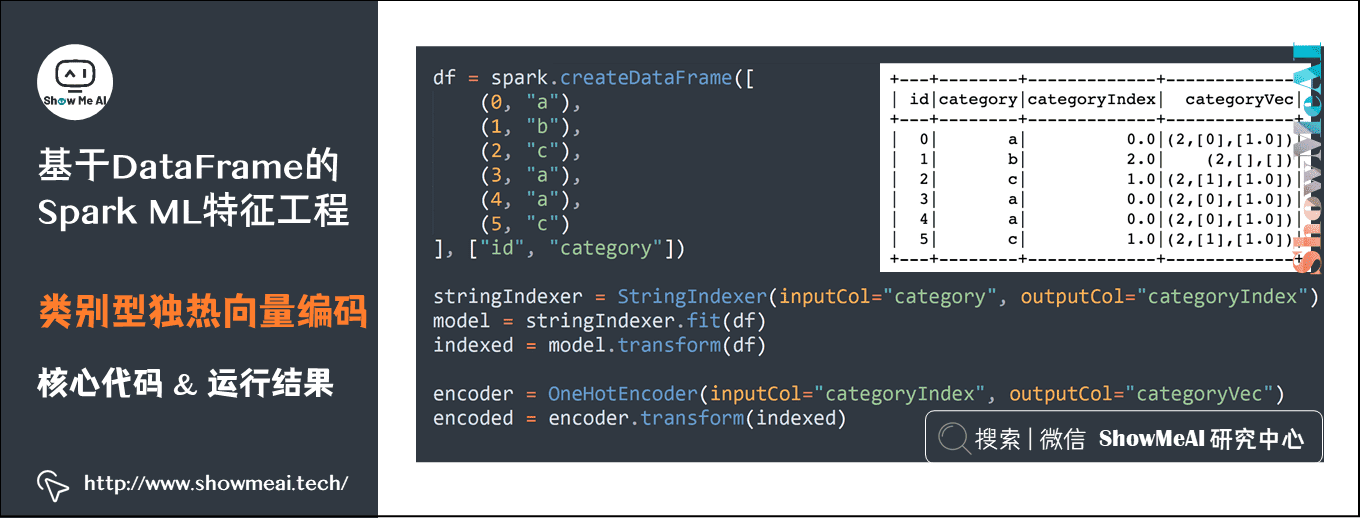
df = spark.createDataFrame([ (0,"a"), (1,"b"), (2,"c"), (3,"a"), (4,"a"), (5,"c")], ["id","category"])
stringIndexer = StringIndexer(inputCol="category", outputCol="categoryIndex")
model = stringIndexer.fit(df)
indexed = model.transform(df)

encoder = OneHotEncoder(inputCol="categoryIndex", outputCol="categoryVec")
encoded = encoder.transform(indexed)
9) Text feature extraction
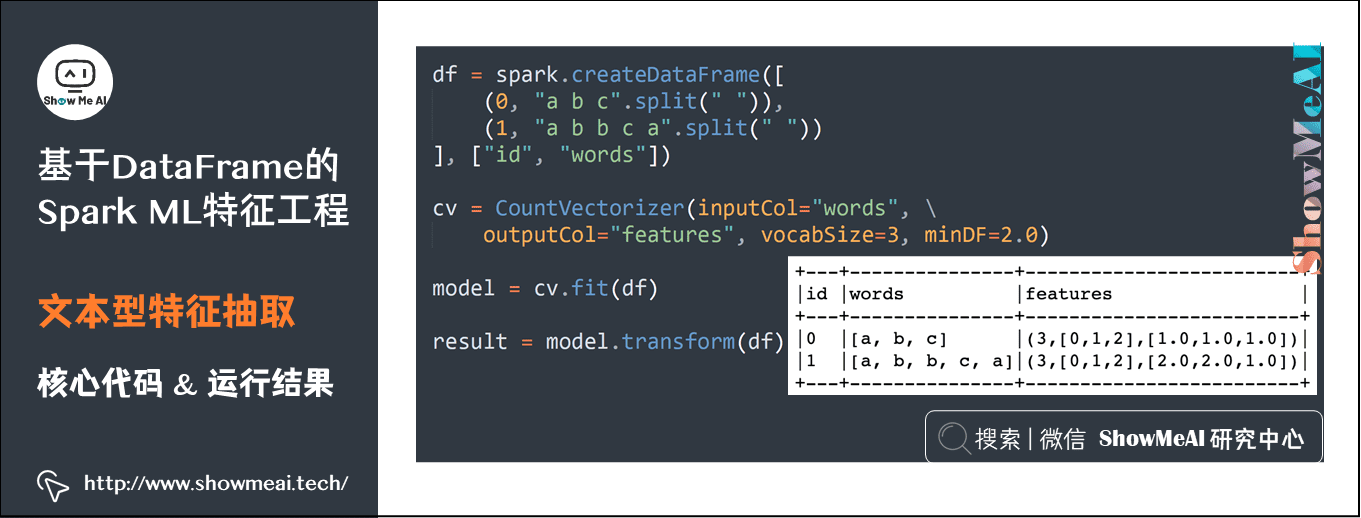
df = spark.createDataFrame([(0, "a b c".split(" ")), (1, "a b b c a".split(" "))], ["id", "words"])
cv = CountVectorizer(inputCol="words", outputCol="features", vocabSize=3, minDF=2.0)
model = cv.fit(df)
result = model.transform(df)
10) Text feature extraction
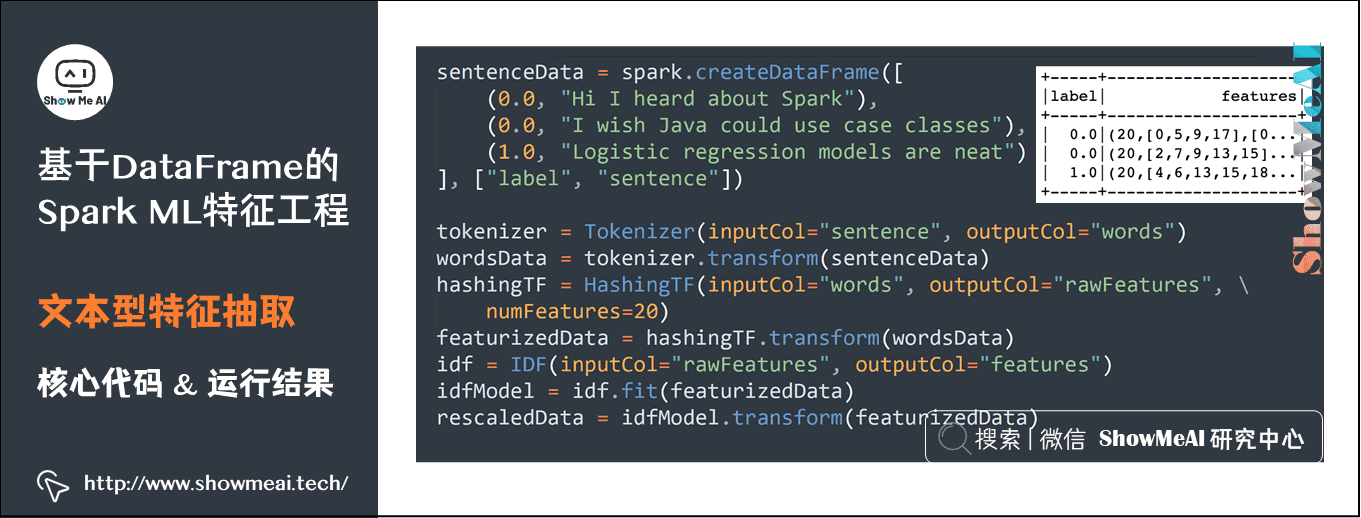
sentenceData = spark.createDataFrame([
(0.0, "Hi I heard about Spark"),
(0.0, "I wish Java could use case classes"),
(1.0, "Logistic regression models are neat")
], ["label", "sentence"])

tokenizer = Tokenizer(inputCol="sentence", outputCol="words")
wordsData = tokenizer.transform(sentenceData)
hashingTF = HashingTF(inputCol="words", outputCol="rawFeatures", numFeatures=20)
featurizedData = hashingTF.transform(wordsData)
idf = IDF(inputCol="rawFeatures", outputCol="features")
idfModel = idf.fit(featurizedData)
rescaledData = idfModel.transform(featurizedData)
3. References
- Quick search of data science tools | Spark User Guide (RDD version) http://www.showmeai.tech/article-detail/106
- Quick search of data science tools | Spark User Guide (SQL version) http://www.showmeai.tech/article-detail/107
- Huang Meiling, Spark MLlib machine learning: detailed explanation of algorithm, source code and actual combat, electronic industry press, 2016
- Using ML Pipeline to build machine learning workflow https://www.ibm.com/developerworks/cn/opensource/os-cn-spark-practice5/index.html
- Spark official document: Machine Learning Library (MLlib) guide, http://spark.apachecn.org/docs/cn/2.2.0/ml-guide.html
ShowMeAI related articles recommended
- Illustrated big data | introduction: big data ecology and Application
- Graphic big data | distributed platform: detailed explanation of Hadoop and map reduce
- Illustrated big data | practical case: Hadoop system construction and environment configuration
- Illustrated big data | practical case: big data statistics using map reduce
- Illustrated big data | practical case: Hive construction and application case
- Graphic big data | massive database and query: detailed explanation of Hive and HBase
- Graphic big data | big data analysis and mining framework: Spark preliminary
- Graphic big data | Spark operation: big data processing analysis based on RDD
- Graphic big data | Spark operation: big data processing analysis based on Dataframe and SQL
- Illustrating big data covid-19: using spark to analyze the new US crown pneumonia epidemic data
- Illustrated big data | comprehensive case: mining retail transaction data using Spark analysis
- Illustrated big data | comprehensive case: Mining music album data using Spark analysis
- Graphic big data | streaming data processing: Spark Streaming
- Graphic big data | Spark machine learning (Part I) - workflow and Feature Engineering
- Graphical big data | Spark machine learning (Part 2) - Modeling and hyperparametric optimization
- Graphic big data | Spark GraphFrames: graph based data analysis and mining
ShowMeAI series tutorial recommendations
- Proficient in Python: Tutorial Series
- Graphic data analysis: a series of tutorials from introduction to mastery
- Fundamentals of graphic AI Mathematics: a series of tutorials from introduction to mastery
- Illustrated big data technology: a series of tutorials from introduction to mastery
- Graphical machine learning algorithms: a series of tutorials from introduction to mastery
