1, mapreduce job oom
1. If the task has not been started, an error will be directly oom reported
AM journal:
21/05/10 15:15:13 INFO mapreduce.Job: Task Id : attempt_1617064346277_101596_m_000000_1, Status : FAILEDError: Java heap space21/05/10 15:15:16 INFO mapreduce.Job: Task Id : attempt_1617064346277_101596_m_000000_2, Status : FAILEDError: Java heap space
maptask Log of:
2021-05-10 17:02:41,893 INFO [main] org.apache.hadoop.mapred.MapTask: Processing split: hdfs://emr-cluster/tmp/gc/wordcount.txt:0+52
2021-05-10 17:02:41,988 ERROR [main] org.apache.hadoop.mapred.YarnChild: Error running child : java.lang.OutOfMemoryError: Java heap space
	at org.apache.hadoop.mapred.MapTask$MapOutputBuffer.init(MapTask.java:1000)
	at org.apache.hadoop.mapred.MapTask.createSortingCollector(MapTask.java:408)
	at org.apache.hadoop.mapred.MapTask.access$100(MapTask.java:82)
	at org.apache.hadoop.mapred.MapTask$NewOutputCollector.<init>(MapTask.java:710)
	at org.apache.hadoop.mapred.MapTask.runNewMapper(MapTask.java:782)
	at org.apache.hadoop.mapred.MapTask.run(MapTask.java:347)
The reason may be MapReduce task. io. sort. MB adjustment too large
2. The task has started, but oom appears in the map phase
[2021-05-21 15:35:41.032]Container [pid=17140,containerID=container_e04_1621582172453_0001_01_000113] is running 17997824B beyond the 'PHYSICAL' memory limit. Current usage: 1.0 GB of 1.0 GB physical memory used; 2.8 GB of 5.0 TB virtual memory used. Killing container.
Increase MapReduce map. memory. MB of memory
2, HDFS considerations
1. HDFS data write policy
HDFS has two strategies for selecting volumes (disks) during writing: Round Robin volumechoosing policy and available space volumechoosing policy.
By HDFS site DFS. XML datanode. fsdataset. volume. choosing. Policy attribute. The desirable value is org apache. hadoop. hdfs. server. datanode. fsdataset. Roundrobin volumechoosingpolicy or AvailableSpaceVolumeChoosingPolicy. There are two other attributes to note when selecting a policy based on available space.
dfs.datanode.available-space-volume-choosing-policy.balanced-space-threshold
The default value is 10737418240, i.e. 10G. It means the threshold value of the difference between the maximum free space and the minimum free space in all volumes. If it is less than this threshold value, it is considered that the storage is balanced, and polling is directly used to select volumes.
dfs.datanode.available-space-volume-choosing-policy.balanced-space-preference-fraction
The default value is 0.75. It means the probability that data blocks are stored on volumes with more free space. Therefore, if this value is less than 0.5, it is meaningless for the policy, and the default value is generally adopted.
2. Data imbalance adjustment
preface
Students doing cluster operation and maintenance may encounter such a problem: Hadoop cluster has been used for a long time, and the data on each node will become unbalanced, with 70,80% more and 10,20% less In this scenario, we usually use the Balancer tool of HDFS to balance the data But sometimes, you will find that although the data between nodes is balanced, the data of each disk block in the node is unbalanced This is something that the Balancer tool cannot do Through this scenario, we introduce a topic of this paper: data balance in HDFS nodes This problem was actually raised very early. See issue hdfs-1312 (re balance disks within a datanode) for details I believe you have encountered this problem more or less when using Hadoop cluster This article will talk about this topic and the current solutions of the community
Occurrence of data imbalance between disks
The phenomenon of data imbalance between disks comes from the imbalance of data size during long-term write operations Because you can guarantee the order of writing to the disk every time you write, but you can't guarantee that the amount of data written each time is the same size For example, for disks A,B, C and D, you use the default RoundRobin disk selection strategy to write. The last four disks have been written, but the block block of a and B may be 1M, while C and D may be 128M
Problems caused by data imbalance between disks
If the data imbalance between disks does occur, what impact will it have on us? Some people may think that it is not an ordinary disk, but not a system disk. Too much space on the system disk will affect the system performance, but the ordinary disk should be no problem This view sounds OK, but it's too shallow We analyze this phenomenon from the reading and writing level of HDFS The following two points are summarized here:
First, the imbalance of data between disks indirectly leads to the difference of disk IO pressure As we all know, the data access frequency on HDFS is very high, which will involve a large number of read-write disk operations. Disks with more data will naturally have higher frequency access operations If the IO operation of a disk is very intensive, it is bound to affect its read and write performance
Second, the high utilization of disks leads to the reduction of node optional storage directories When HDFS writes Block data, it will select when the remaining free space meets the size of the Block to be written. If there are too many disk directories with high utilization, such candidate blocks will become less Therefore, this aspect is actually biased towards the impact on HDFS
Traditional solutions to data imbalance between disks
The data imbalance between disks has appeared. What measures do we have to solve it? Here are 2 existing solutions:
Scheme 1: the node goes offline and then goes online Take the machines with unbalanced data in the node offline and then go online again After going online, it will be a new node, and the data will be re stored on each disk This approach makes people feel violent. When the cluster is small, the cost is too high. At this time, a node offline will have a great impact on the cluster service
Scheme 2: manually move some data block storage directories This scheme is more flexible than scheme 1, but the accuracy of data directory movement should be ensured, otherwise the data will not be found after moving the directory Let's take a practical example. For example, we want to move the data on disk 1 to disk 2 The storage directory to be moved of existing disk 1 is as follows:
/data/1/dfs/dn/ current/BP-1788246909-xx.xx.xx.xx-1412278461680/current/ finalized/subdir0/subdir1/
The path I moved to the target disk should be the same as the path format. Only the directory where the disk is located should be changed. The target path is as follows:
/data/2/dfs/dn/current/BP-1788246909-xx.xx.xx.xx-1412278461680/current/finalized/subdir0/subdir1/
If the above directory structure changes, HDFS will not find this data block
Community solution: DiskBalancer
So much has been foreshadowed in order to lead to the content to be emphasized in this section: DiskBalancer From the name of DiskBalancer, we can see that it is a data balancing tool similar to Balancer But its scope is limited to Disk First of all, it should be noted that DiskBalancer is currently an unpublished feature, so you can't find this tool in the existing release Now I will introduce DiskBalancer in all aspects to let you know and understand this powerful tool
Design core of DiskBalancer
First, let's understand the design core of DiskBalancer, which is a little different from Balancer The core of Balancer is the balance of data. If the data is well balanced, it's OK DiskBalancer proposed two goals in its design:
First Data Spread Report. Distributed data reporting This is a report function In other words, the DiskBalancer tool can support the function of each node reporting the usage of disk blocks. Through this function, I can know the node disks with the current utilization rate of TopN in the cluster
Second Disk Balancing. The second point is the balance of disk data However, when balancing the data in the disk, we should consider the different storagetypes of each disk. As mentioned earlier, different disks may have different storage media for heterogeneous storage of HDFS. At present, DiskBalancer does not support data transfer across storage media, so it is required to work under one storageType
The above two points are taken from the design documents of DiskBalancer (see the reference link at the end of the article for the relevant design documents of DiskBalancer)
Architecture design of DiskBalancer
This section discusses the architecture design of DiskBalancer Through architecture design, we can better understand its overall situation The core architecture idea of DiskBalancer is shown in the figure below:
The above process goes through three stages, from discover to plan, and then from plan to execute These three stages are explained in detail below:
Discover
What the discovery phase does is actually calculate the disk usage in each node, and then get the list of disks that need data balance Here, the concept of Volume Data Density disk usage density will be used as A criterion, and the standard value will take the total utilization rate of nodes as the comparison value For example, if the total utilization rate of A node is 75%, that is 0.75, and the utilization rate of disk A is 0.5 (50%), then the volumeDataDensity value of disk A is equal to 0.75-0.5 = 0.25 Similarly, if it is exceeded, the density value will be negative Therefore, we can use the absolute value of volumeDataDensity of each disk in the node to judge the data balance between disks in the node. If the sum of the total absolute value is greater, it means that the data is more unbalanced, which is somewhat similar to the concept of variance The following connector objects will be used in the Discover phase:
1.DBNameNodeConnector
2.JsonConnector
3.NullConnector
The first object will call the NameNodeConnector object under the Balancer package to read the cluster node and disk data
Plan
After receiving the report result data of the previous stage, the execution plan will be generated Plan is not the smallest execution unit. Its interior is composed of various steps The source and target disks will be specified in Step The disk object here is a layer of wrapped object: DiskBalancerVolume, which is not the original FsVolume By the way, the transformation of concepts such as disk node in DiskBalancer:
1.DiskBalancerCluster. Through this object, you can read the node information in the cluster. The node information here is presented in the form of diskbalancerdatonode
2.DiskBalancerDataNode. This object represents a wrapped DataNode
3.DiskBalancerVolume and DiskBalancerVolumeSet Datanode disk object and disk object collection The disk storage directory type in the DiskBalancerVolumeSet needs to be the same StorageType
Execute
The last part is the execution phase. After all plans are generated, it comes to the execution phase These plans will be submitted to their respective datanodes and then executed in the DiskBalancer class There are special class objects in the DiskBalancer class to balance data between disks. The name of this class is DiskBalancerMover In the process of data balancing between disks, disks with high utilization will move data blocks to disks with relatively low utilization. When a certain threshold relationship is met, DiskBalancer will gradually exit During the execution phase of DiskBalancer, the following points should be noted:
1. Bandwidth limitation DiskBalancer can also support bandwidth limitation, which is 10M by default, through the configuration item DFS disk. balancer. max.disk. Throughputinmbpersec for control
2. Limit of failure times The number of failures will be controlled in DiskBalancer In case of IOException exception when copying block data block, the cumulative count of failure times will be carried out. If the maximum tolerance value is exceeded, DiskBalancer will also exit
3. Data balance threshold control DiskBalancer can provide a data balance threshold between disks as a standard for whether to continue balancing data. The configuration item is DFS disk. balancer. block. tolerance. percent.
Command execution of DiskBalancer
DiskBalancer internally provides many kinds of command operations, such as the following query commands:
hdfs diskbalancer -query nodename.mycluster.com
1
We can also execute the corresponding plan command to generate the plan file
hdfs diskbalancer -uri hdfs://mycluster.com -plan node1.mycluster.com
1
Then we can use the generated json file to execute DiskBalancer
hdfs diskbalancer -execute /system/diskbalancer/nodename.plan.json
1
Of course, if we find that we have executed the wrong plan, we can also clear it through the cancel command:
hdfs diskbalancer -cancel /system/diskbalancer/nodename.plan.json
1
or
hdfs diskbalancer -cancel -node
1
There are many object json relational transformations involved in DiskBalancer, so you will see some bands json suffix file
Summary
In short, DiskBalancer is a very practical feature In Hadoop, there is a special branch for developing this function, HDFS-1312. Interested students can download the latest code of Hadoop for learning I am very honored to submit a small patch, issue number, HDFS-10560 to this function This new feature will soon be released in the new version of Hadoop. I believe it will be very helpful to Hadoop cluster managers
reference material
1.https://issues.apache.org/jira/secure/attachment/12755226/disk-balancer-proposal.pdf
2.https://issues.apache.org/jira/secure/attachment/12810720/Architecture_and_test_update.pdf
2.https://issues.apache.org/jira/browse/HDFS-1312
3.https://issues.apache.org/jira/browse/HDFS-10560
3. Block loss processing
There are 2 missing blocks. The following files may be corrupted:
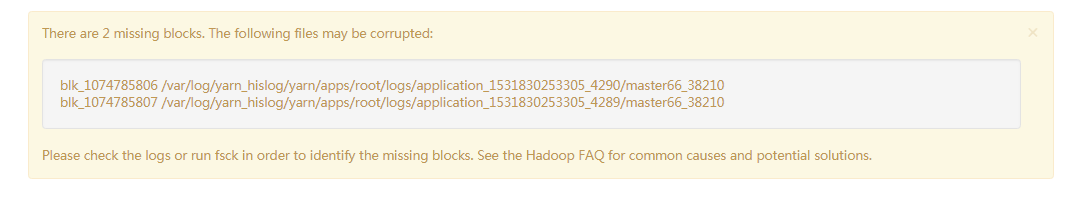
Step 1: check the missing files
As you can see,
blk_1074785806 /var/log/yarn_hislog/yarn/apps/root/logs/application_1531830253305_4290/master66_38210
blk_1074785807 /var/log/yarn_hislog/yarn/apps/root/logs/application_1531830253305_4289/master66_38210
Indeed, each has lost a Block. The file has been damaged and cannot be recovered.
[root@master66 datacollectors]# hdfs fsck /var/log/yarn_hislog/yarn/apps/root/logs/application_1531830253305_4290/master66_38210
Connecting to namenode via http://master66:50070
FSCK started by root (auth:SIMPLE) from /10.3.70.116 for path /var/log/yarn_hislog/yarn/apps/root/logs/application_1531830253305_4290/master66_38210 at Thu Sep 06 09:23:04 CST 2018
Step 2: delete the missing file
hdfs fsck -delete blk_1074785806 /var/log/yarn_hislog/yarn/apps/root/logs/application_1531830253305_4290/master66_38210
hdfs fsck -delete blk_1074785807 /var/log/yarn_hislog/yarn/apps/root/logs/application_1531830253305_4289/master66_38210
Step 3: check the health of the cluster
3, yarn
1. Common commands
hdfs haadmin -getServiceState nn1 view active or standby state
2. Manually switch between active and standby
dfs. ha. automatic-failover. This instruction is not supported when enabled = true
hdfs haadmin -failover -forcefence -forceactive nn2 nn1 active / standby switchover
3. yarn exception due to insufficient disk
2020-09-17 13:12:31,660 ERROR org.mortbay.log: /ws/v1/cluster/apps
javax.ws.rs.WebApplicationException: javax.xml.bind.MarshalException
 - with linked exception:
[javax.xml.stream.XMLStreamException: org.mortbay.jetty.EofException]
	at com.sun.jersey.core.provider.jaxb.AbstractRootElementProvider.writeTo(AbstractRootElementProvider.java:159)
	at com.sun.jersey.spi.container.ContainerResponse.write(ContainerResponse.java:306)
	at com.sun.jersey.server.impl.application.WebApplicationImpl._handleRequest(WebApplicationImpl.java:1437)
	at com.sun.jersey.server.impl.application.WebApplicationImpl.handleRequest(WebApplicationImpl.java:1349)
	at com.sun.jersey.server.impl.application.WebApplicationImpl.handleRequest(WebApplicationImpl.java:1339)
	at com.sun.jersey.spi.container.servlet.WebComponent.service(WebComponent.java:416)
	at com.sun.jersey.spi.container.servlet.ServletContainer.service(ServletContainer.java:537)
	at com.sun.jersey.spi.container.servlet.ServletContainer.doFilter(ServletContainer.java:886)
	at com.sun.jersey.spi.container.servlet.ServletContainer.doFilter(ServletContainer.java:834)
	at org.apache.hadoop.yarn.server.resourcemanager.webapp.RMWebAppFilter.doFilter(RMWebAppFilter.java:142)
	at com.sun.jersey.spi.container.servlet.ServletContainer.doFilter(ServletContainer.java:795)
	at com.google.inject.servlet.FilterDefinition.doFilter(FilterDefinition.java:163)
	at com.google.inject.servlet.FilterChainInvocation.doFilter(FilterChainInvocation.java:58)
	at com.google.inject.servlet.ManagedFilterPipeline.dispatch(ManagedFilterPipeline.java:118)
	at com.google.inject.servlet.GuiceFilter.doFilter(GuiceFilter.java:113)
	at org.mortbay.jetty.servlet.ServletHandler$CachedChain.doFilter(ServletHandler.java:1212)
	at org.apache.hadoop.http.lib.StaticUserWebFilter$StaticUserFilter.doFilter(StaticUserWebFilter.java:109)
	at org.mortbay.jetty.servlet.ServletHandler$CachedChain.doFilter(ServletHandler.java:1212)
	at org.apache.hadoop.security.authentication.server.AuthenticationFilter.doFilter(AuthenticationFilter.java:595)
	at org.apache.hadoop.security.token.delegation.web.DelegationTokenAuthenticationFilter.doFilter(DelegationTokenAuthenticationFilter.java:294)
	at org.apache.hadoop.security.authentication.server.AuthenticationFilter.doFilter(AuthenticationFilter.java:554)
	at org.apache.hadoop.yarn.server.security.http.RMAuthenticationFilter.doFilter(RMAuthenticationFilter.java:82)
	at org.mortbay.jetty.servlet.ServletHandler$CachedChain.doFilter(ServletHandler.java:1212)
	at org.apache.hadoop.http.HttpServer2$QuotingInputFilter.doFilter(HttpServer2.java:1243)
	at org.mortbay.jetty.servlet.ServletHandler$CachedChain.doFilter(ServletHandler.java:1212)
	at org.apache.hadoop.http.NoCacheFilter.doFilter(NoCacheFilter.java:45)
	at org.mortbay.jetty.servlet.ServletHandler$CachedChain.doFilter(ServletHandler.java:1212)
	at org.apache.hadoop.http.NoCacheFilter.doFilter(NoCacheFilter.java:45)
	at org.mortbay.jetty.servlet.ServletHandler$CachedChain.doFilter(ServletHandler.java:1212)
	at org.mortbay.jetty.servlet.ServletHandler.handle(ServletHandler.java:399)
	at org.mortbay.jetty.security.SecurityHandler.handle(SecurityHandler.java:216)
	at org.mortbay.jetty.servlet.SessionHandler.handle(SessionHandler.java:182)
	at org.mortbay.jetty.handler.ContextHandler.handle(ContextHandler.java:766)
	at org.mortbay.jetty.webapp.WebAppContext.handle(WebAppContext.java:450)
	at org.mortbay.jetty.handler.ContextHandlerCollection.handle(ContextHandlerCollection.java:230)
	at org.mortbay.jetty.handler.HandlerWrapper.handle(HandlerWrapper.java:152)
	at org.mortbay.jetty.Server.handle(Server.java:326)
	at org.mortbay.jetty.HttpConnection.handleRequest(HttpConnection.java:542)
	at org.mortbay.jetty.HttpConnection$RequestHandler.headerComplete(HttpConnection.java:928)
	at org.mortbay.jetty.HttpParser.parseNext(HttpParser.java:549)
	at org.mortbay.jetty.HttpParser.parseAvailable(HttpParser.java:212)
	at org.mortbay.jetty.HttpConnection.handle(HttpConnection.java:404)
	at org.mortbay.io.nio.SelectChannelEndPoint.run(SelectChannelEndPoint.java:410)
	at org.mortbay.thread.QueuedThreadPool$PoolThread.run(QueuedThreadPool.java:582)
Caused by: javax.xml.bind.MarshalException
 - with linked exception:
[javax.xml.stream.XMLStreamException: org.mortbay.jetty.EofException]
	at com.sun.xml.bind.v2.runtime.MarshallerImpl.write(MarshallerImpl.java:327)
	at com.sun.xml.bind.v2.runtime.MarshallerImpl.marshal(MarshallerImpl.java:177)
	at com.sun.jersey.json.impl.BaseJSONMarshaller.marshallToJSON(BaseJSONMarshaller.java:103)
	at com.sun.jersey.json.impl.provider.entity.JSONRootElementProvider.writeTo(JSONRootElementProvider.java:136)
	at com.sun.jersey.core.provider.jaxb.AbstractRootElementProvider.writeTo(AbstractRootElementProvider.java:157)
	... 43 more
Caused by: javax.xml.stream.XMLStreamException: org.mortbay.jetty.EofException
	at com.sun.jersey.json.impl.writer.Stax2JacksonWriter.writeStartElement(Stax2JacksonWriter.java:204)
	at com.sun.xml.bind.v2.runtime.output.XMLStreamWriterOutput.beginStartTag(XMLStreamWriterOutput.java:118)
	at com.sun.xml.bind.v2.runtime.output.XmlOutputAbstractImpl.beginStartTag(XmlOutputAbstractImpl.java:102)
	at com.sun.xml.bind.v2.runtime.output.NamespaceContextImpl$Element.startElement(NamespaceContextImpl.java:496)
	at com.sun.xml.bind.v2.runtime.XMLSerializer.endNamespaceDecls(XMLSerializer.java:291)
	at com.sun.xml.bind.v2.runtime.XMLSerializer.childAsXsiType(XMLSerializer.java:687)
	at com.sun.xml.bind.v2.runtime.property.SingleElementNodeProperty.serializeBody(SingleElementNodeProperty.java:156)
	at com.sun.xml.bind.v2.runtime.ClassBeanInfoImpl.serializeBody(ClassBeanInfoImpl.java:344)
	at com.sun.xml.bind.v2.runtime.XMLSerializer.childAsXsiType(XMLSerializer.java:700)
	at com.sun.xml.bind.v2.runtime.property.ArrayElementNodeProperty.serializeItem(ArrayElementNodeProperty.java:69)
	at com.sun.xml.bind.v2.runtime.property.ArrayElementProperty.serializeListBody(ArrayElementProperty.java:172)
	at com.sun.xml.bind.v2.runtime.property.ArrayERProperty.serializeBody(ArrayERProperty.java:159)
	at com.sun.xml.bind.v2.runtime.ClassBeanInfoImpl.serializeBody(ClassBeanInfoImpl.java:344)
	at com.sun.xml.bind.v2.runtime.XMLSerializer.childAsSoleContent(XMLSerializer.java:597)
	at com.sun.xml.bind.v2.runtime.ClassBeanInfoImpl.serializeRoot(ClassBeanInfoImpl.java:328)
	at com.sun.xml.bind.v2.runtime.XMLSerializer.childAsRoot(XMLSerializer.java:498)
	at com.sun.xml.bind.v2.runtime.MarshallerImpl.write(MarshallerImpl.java:320)
	... 47 more
Caused by: org.mortbay.jetty.EofException
	at org.mortbay.jetty.HttpGenerator.flush(HttpGenerator.java:791)
	at org.mortbay.jetty.AbstractGenerator$Output.blockForOutput(AbstractGenerator.java:551)
	at org.mortbay.jetty.AbstractGenerator$Output.flush(AbstractGenerator.java:572)
	at org.mortbay.jetty.HttpConnection$Output.flush(HttpConnection.java:1012)
	at org.mortbay.jetty.AbstractGenerator$Output.write(AbstractGenerator.java:651)
	at org.mortbay.jetty.AbstractGenerator$Output.write(AbstractGenerator.java:580)
	at com.sun.jersey.spi.container.servlet.WebComponent$Writer.write(WebComponent.java:307)
	at com.sun.jersey.spi.container.ContainerResponse$CommittingOutputStream.write(ContainerResponse.java:134)
	at sun.nio.cs.StreamEncoder.writeBytes(StreamEncoder.java:221)
	at sun.nio.cs.StreamEncoder.implWrite(StreamEncoder.java:282)
	at sun.nio.cs.StreamEncoder.write(StreamEncoder.java:125)
	at java.io.OutputStreamWriter.write(OutputStreamWriter.java:207)
	at org.codehaus.jackson.impl.WriterBasedGenerator._flushBuffer(WriterBasedGenerator.java:1812)
	at org.codehaus.jackson.impl.WriterBasedGenerator._writeString(WriterBasedGenerator.java:987)
	at org.codehaus.jackson.impl.WriterBasedGenerator._writeFieldName(WriterBasedGenerator.java:328)
	at org.codehaus.jackson.impl.WriterBasedGenerator.writeFieldName(WriterBasedGenerator.java:197)
	at com.sun.jersey.json.impl.writer.JacksonStringMergingGenerator.writeFieldName(JacksonStringMergingGenerator.java:140)
	at com.sun.jersey.json.impl.writer.Stax2JacksonWriter.writeStartElement(Stax2JacksonWriter.java:183)
	... 63 more
Caused by: java.io.IOException: Connection reset by peer
	at sun.nio.ch.FileDispatcherImpl.write0(Native Method)
	at sun.nio.ch.SocketDispatcher.write(SocketDispatcher.java:47)
	at sun.nio.ch.IOUtil.writeFromNativeBuffer(IOUtil.java:93)
4. The yarn queue submission shows that the queue does not exist
The user has a root etl. Streaming queue, but use queue = root etl. When streaming reports an error that there is no queue, use queue = ETL Streaming also reports that there is no queue
Solution: the queue only needs to specify the last queue name, so it succeeds after queue=streaming
5. The job submitted by the user is always ACCEPTED
1) The following logs are found in the description information of ACCEPTED operation:
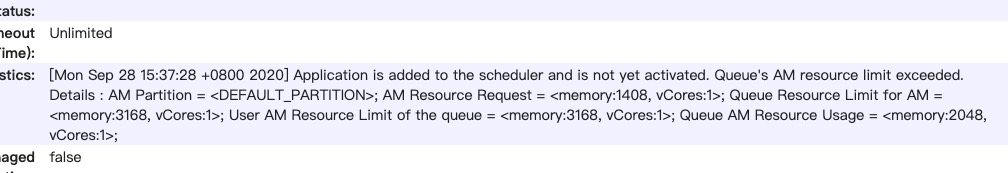
yarn. scheduler. capacity. The maximum am resource percentage is 0.25 by default and can be increased appropriately
6. Another is that the corresponding queue is full, for example:
A total of 34000, 32768 have been used, and the task submitted by the user is ACCEPTED
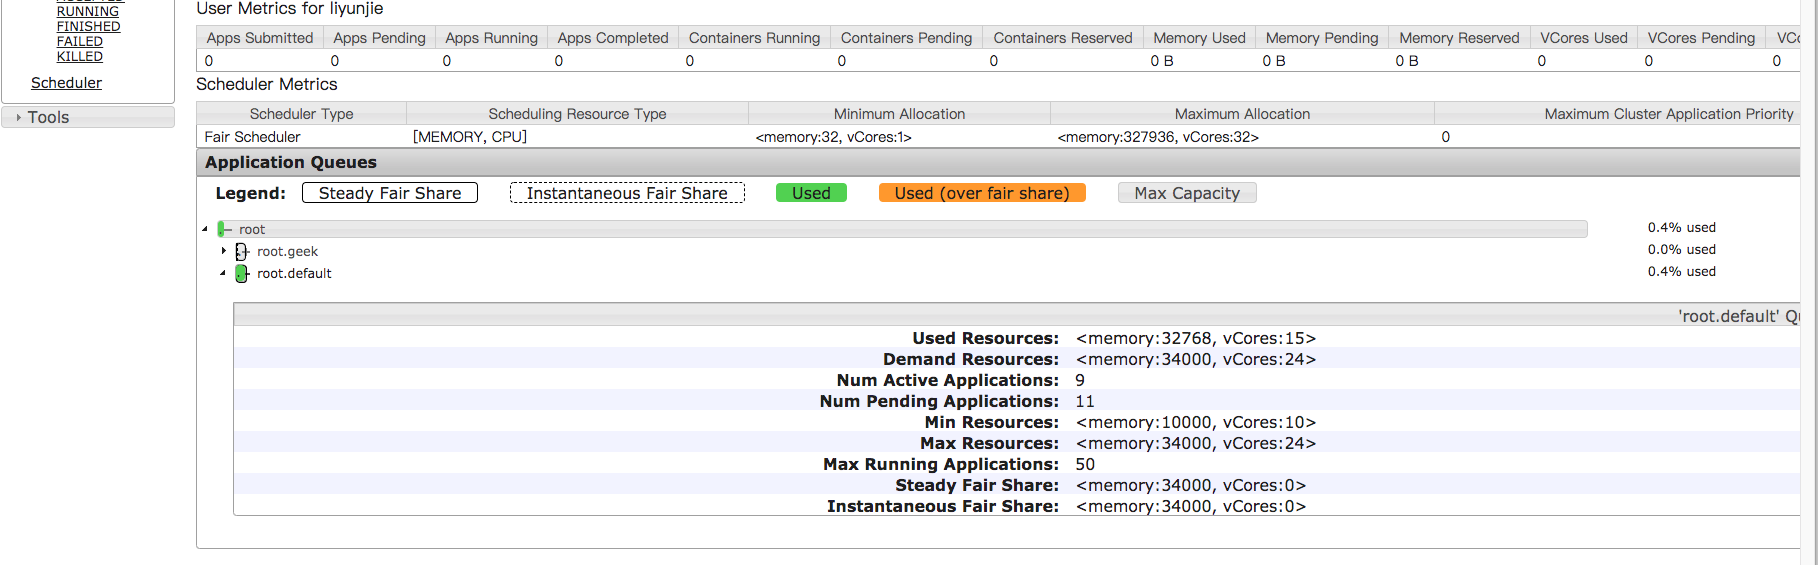
Increase the size of the queue~
7. The user has two queues. The default queue allocates 75% of the resources, but the maximum resource is set to 100%. When 75% is used, the task is ACCEPTED
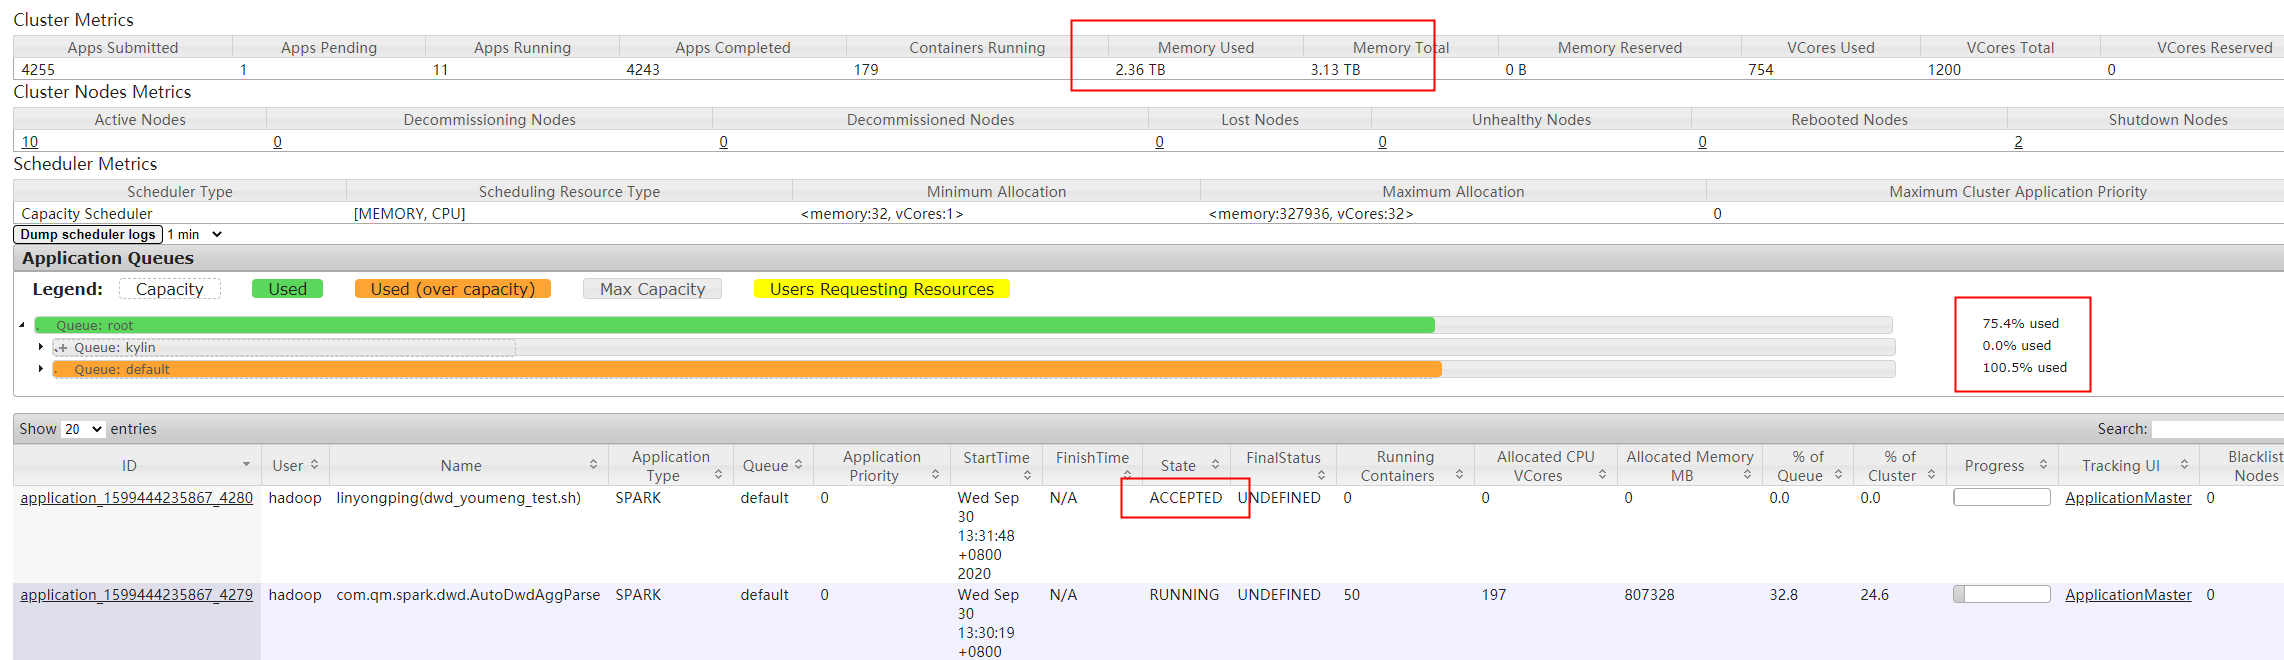
When the reason is yarn scheduler. capacity. root. default. When the user limit factor parameter is 1 by default, it identifies that a user can only use 75% of the maximum value of queue allocation when yarn scheduler. capacity. root. default. When the user limit factor is set to 2, you can continue to commit to free memory
, or another user can submit the job to free memory
8. The user sets the submission permission of queue acl, but it does not take effect
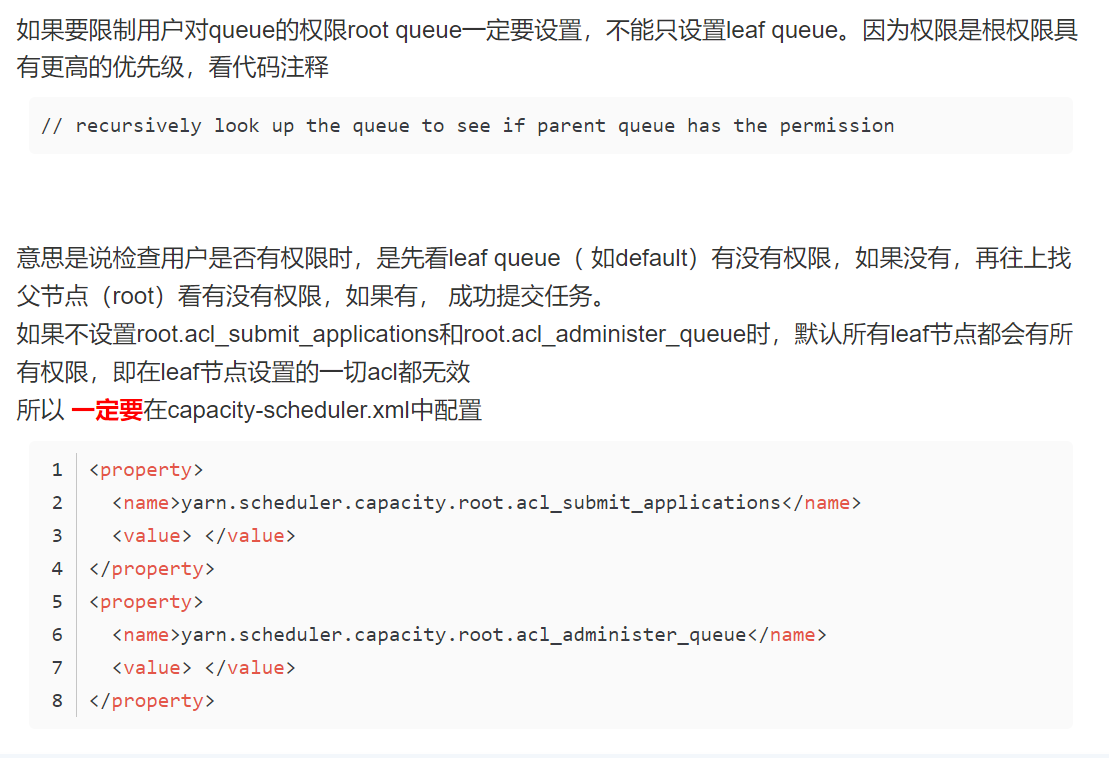
You must set permissions on root
9. Add the yarn node after it goes offline
(1) Modify and remove the address of the offline node / etc / ECM / Hadoop conf / yarn exclude
(2) . the header node executes yarn rmadmin -refreshNodes
(3) . emr console startup nm
10,curl http://emr-header-1:8088/cluster Show no permission
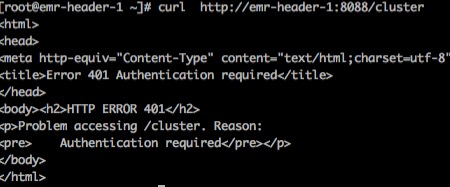
New version Hadoop http. authentication. simple. anonymous. The value of allowed is false, which causes you to add "allowed" when accessing the yarn page? user.name=xxxxxx, otherwise you have no permission
Or open the permission Hadoop http. authentication. simple. anonymous. Change allowed to true and restart yarn
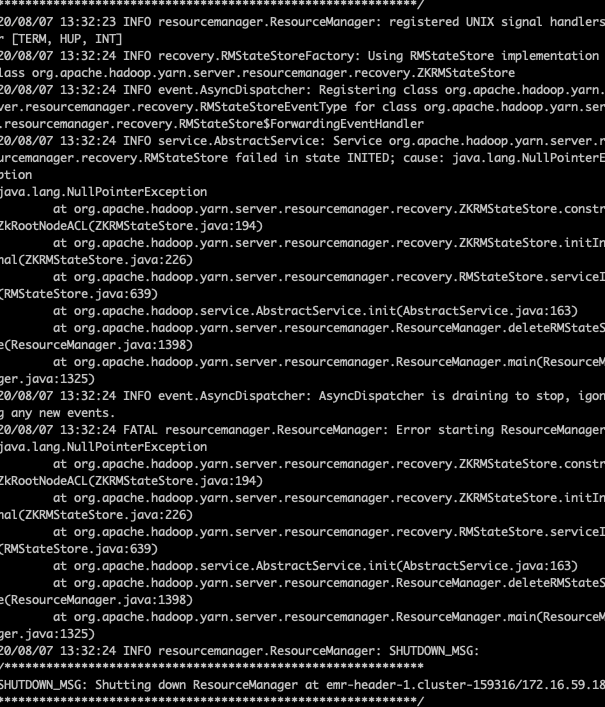
11. After the emr cluster restarts, the two RMS are all standby
Problem Description: after the user restarts rm, both RMS are in standby state,
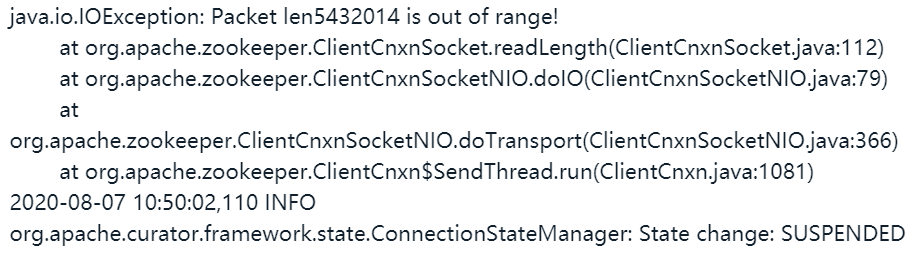
First, use the hadoop user to execute the command yarn rmadmin -transitionToActive rm1 --forcemanual to force rm1 to switch to active, but it is unsuccessful
Reading the wrong information is a problem with zk, but using zkcli SH is no problem. Open source data query needs to be increased
"-Djute.maxbuffer=10000000"
Restart zk one by one and start the follower first
If you still report an error, add / var / lib / ECM agent / cache / ECM / service / yarn / x.x.x.x/package/templates to the environment of yarn and find yarn env sh YARN_ OPTS = “-Djute.maxbuffer=10000000”
Restart yarn, or report an error
Use the command yarn ResourceManager - Format state store to format the state store of rm,
If an error is reported, you can only zk delete the corresponding task znode status manually
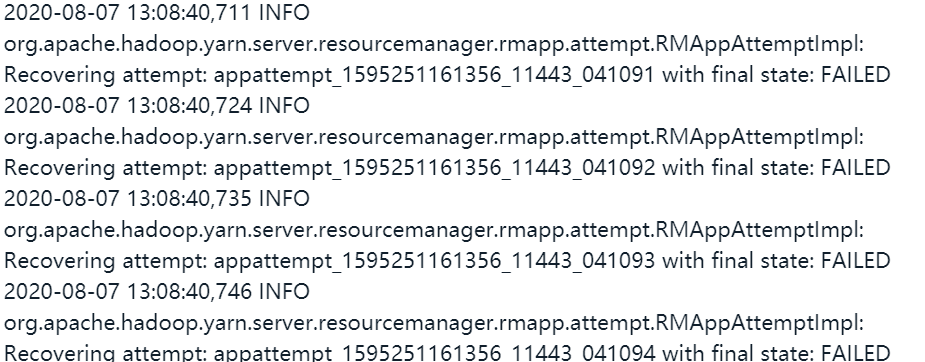
deleteall /rmstore/ZKRMStateRoot/RMAppRoot/application_ 1595251161356_11443
Successfully deleted
Solution: the job triggered the exception of ResourceManager zk. After fixing the zk problem, restart RM and get stuck in an abnormal job 1595251161356_ 11443. In this case, the zk store can be cleared for quick recovery, but there is an exception, so the zk information of the abnormal job is cleared manually
12. The number of vcore s displayed by spark on yarn does not match the submitted parameters
yarn.scheduler.capacity.resource-calculator
org.apache.hadoop.yarn.util.resource.DefaultResourceCalculator
Change to org apache. hadoop. yarn. util. resource. The display of dominantresourcecalculator is normal