1, Heap histogram
Reducing memory usage is an important goal, and the simplest method for heap analysis is to use heap histogram. Through the heap histogram, we can quickly see the number of objects in the application, and there is no need for a complete heap dump (because the heap dump takes a period of time to analyze and consumes a lot of disk space).
Histograms are good at identifying problems caused by too many instances assigned to one or two specific classes. For example, the memory pressure in the application is caused by some specific object types. The clue can be seen quickly by using the heap histogram.
1.1. Obtained through jcmd
The heap histogram can be obtained through the jcmd command:
[ciadmin@2-103test_app ~]$ jcmd 26964 GC.class_histogram | more
26964:

 num     #instances         #bytes  class name
----------------------------------------------
   1:         91488       21270064  [C
   2:          9058       18963152  [B
   3:         80620        2579840  java.util.concurrent.ConcurrentHashMap$Node
   4:         24081        2119128  java.lang.reflect.Method
   5:         86860        2084640  java.lang.String
   6:         13013        1444264  java.lang.Class
   7:         24376        1170048  org.aspectj.weaver.reflect.ShadowMatchImpl
   8:         26822        1072880  java.util.LinkedHashMap$Entry
   9:           553         921168  [Ljava.util.concurrent.ConcurrentHashMap$Node;
  10:         15903         890568  java.util.LinkedHashMap
  11:         12092         847832  [Ljava.util.HashMap$Node;
  12:           307         829712  [J
  13:         24376         780032  org.aspectj.weaver.patterns.ExposedState
  14:         12621         718696  [Ljava.lang.Object;
  15:          5433         686400  [I
  16:         36341         581456  java.lang.Object
  17:         17746         567872  java.util.HashMap$Node
  18:          1267         476392  java.lang.Thread
  19:         13207         422624  java.lang.ThreadLocal$ThreadLocalMap$Entry
  20:          2516         270336  [Ljava.lang.ThreadLocal$ThreadLocalMap$Entry;
explain:
1. Field description
- [C: character array
- [B: byte array
- [Ljava.lang.Object:Object array
2,GC.class_histogram output contains only active objects
1.2. Obtained through jmap
The command is: jmap -histo process_id
The output of jmap contains objects that will be recycled (dead objects). To force Full GC once before you see the histogram, run the following command instead:
Add the following in the command line: after the live parameter, the output histogram is the data after Full GC
[ciadmin@2-103test_app ~]$ jmap -histo:live 26964 | more

 num     #instances         #bytes  class name
----------------------------------------------
   1:         91488       21270064  [C
   2:          9058       18963152  [B
   3:         80620        2579840  java.util.concurrent.ConcurrentHashMap$Node
   4:         24081        2119128  java.lang.reflect.Method
   5:         86860        2084640  java.lang.String
   6:         13013        1444264  java.lang.Class
   7:         24376        1170048  org.aspectj.weaver.reflect.ShadowMatchImpl
   8:         26822        1072880  java.util.LinkedHashMap$Entry
   9:           553         921168  [Ljava.util.concurrent.ConcurrentHashMap$Node;
  10:         15903         890568  java.util.LinkedHashMap
  11:         12092         847832  [Ljava.util.HashMap$Node;
  12:           307         829712  [J
  13:         24376         780032  org.aspectj.weaver.patterns.ExposedState
  14:         12621         718696  [Ljava.lang.Object;
  15:          5433         686400  [I
  16:         36341         581456  java.lang.Object
  17:         17749         567968  java.util.HashMap$Node
  18:          1267         476392  java.lang.Thread
  19:         13207         422624  java.lang.ThreadLocal$ThreadLocalMap$Entry
  20:          2516         270336  [Ljava.lang.ThreadLocal$ThreadLocalMap$Entry;
  21:          8056         257792  java.util.LinkedList
  22:         11664         247432  [Ljava.lang.Class;
  23:          4397         187064  [Ljava.lang.String;
  24:          1945         186720  org.springframework.beans.GenericTypeAwarePropertyDescriptor
  25:          5631         180192  java.lang.ref.WeakReference
  26:          3630         174240  java.util.HashMap
The histogram is very small, but it takes a few seconds to get the histogram. You need to pay attention to it during performance testing.
2, Heap dump
Histograms are good at identifying problems caused by too many instances assigned to one or two specific classes, but for in-depth analysis, heap dumps are required.
- 2.1. Use jcmd for heap dump
[ciadmin@2-103test_app pos-gateway-cloud]$ jcmd 26964 GC.heap_dump /home/ciadmin/pos-gateway-cloud/heap_dump.hprof
26964:
Heap dump file created
- 2.2. Heap dump using jmap
[ciadmin@2-103test_app pos-gateway-cloud]$ jmap -dump:live,file=/home/ciadmin/pos-gateway-cloud/heap_dump2.hprof 26964
Dumping heap to /home/ciadmin/pos-gateway-cloud/heap_dump2.hprof ...
Heap dump file created
jmap contains the live option, which will execute a Full GC before heap dump; Jcmd does this by default. If you do not want to include other objects (i.e. dead objects) for some reason, you can add - all at the end of the jcmd command.
- 2.3 automatic heap dump
OutOfMemoryError is unpredictable and it is difficult to determine when a heap dump should be obtained. There are several JVM flags that can help.
-20: + heapdumponoutofmemoryerror this flag is false by default. When this flag is turned on, the JVM will create a heap dump when throwing OutOfMemoryError.
-20: Heapdumppath = < Path > this flag knows the location where the heap dump will be written. By default, it is the production Java in the current working directory_ pid<pid>. Hprof file.
-20: + heapdumpafterfullgc this will generate a heap dump file after running Full GC once.
-20: + heapdumpbeforefullgc this generates a heap dump file before running Full GC once.
In some cases, multiple heap dump files will be generated (because Full GC is executed for many times). At this time, the JVM will append a sequence number to the name of the heap dump file.
Both commands will create a file named *. In the specified directory hprof file. After generation, there are many tools to open the file. Here are the three most common tools.
3, Heap dump file analysis tool
- jhat
This is the most original analysis tool. It will read the heap dump file and run a small HTTP server, which allows you to view the heap dump information through a series of Netease links.
[ciadmin@2-103test_app pos-gateway-cloud]$ jhat heap_dump.hprof
Reading from heap_dump.hprof...
Dump file created Mon Mar 05 18:33:10 CST 2018
Snapshot read, resolving...
Resolving 751016 objects...
Chasing references, expect 150 dots......................................................................................................................................................
Eliminating duplicate references......................................................................................................................................................
Snapshot resolved.
Started HTTP server on port 7000
Server is ready.
Find a machine with a browser to access it, http://ip:7000
- jvisualvm
The Monitor tab of the jvisualvm can obtain the heap dump file from a running program or open the previously generated heap dump file.
For more information, see< Java VisualVM>
- mat
The open source eclipse link memory analyzer tool (mat) can load one or more heap dump files and perform analysis. It can generate reports and suggest possible problems to us. It can also be used for traffic heap and execute SQL like queries on the heap.
In particular, mat has a built-in function: if two heap dump files are opened, mat has an option to calculate the difference between the histograms in the two heaps.
For more information, see< One of mat -- eclipse installs Memory Analyzer>
The first analysis of the heap usually involves reserving memory. The reserved memory of an object refers to the amount of memory that can be released by recycling the object.
For information about memory retention, see< GC 2 -- judgment basis, shallow size, retained size and Deep size of how GC is recycled>
4, Memory overflow error
In the following cases, the jvm will throw out of memory error:
- JVM has no native memory available;
- Insufficient permanent generation (in java7 and earlier versions) or meta space (java8) memory;
- Insufficient memory of java heap itself -- there are too many active objects in the application for a given heap space;
- JVM takes too much time to execute GC;
1. Insufficient native memory
The reason has nothing to do with the heap. In a 32-bit JVM, the maximum memory of a process is 4GB. It is dangerous to specify a very large heap size, such as 3.8GB, so that the size of the application is very close to the limit of 4GB.
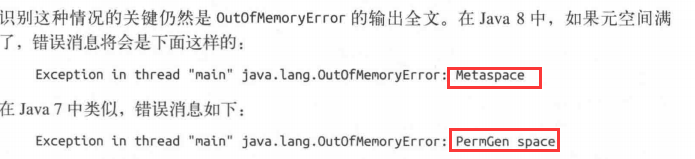
2. Out of permanent generation or meta space memory
First of all, it has nothing to do with the heap. There may be two root causes:
- The first case is that the application uses too many classes, which exceeds the default accommodation range of the permanent generation; Solution: increase the size of the permanent generation
- The second case is relatively tricky: it involves a memory leak in the class loader. This often occurs in Java EE application servers. Class loading leads to memory overflow. Through heap dump analysis, find all instances of ClassLoader class in the histogram, and then track their GC roots to see which objects still retain references to them.
Example:
3. Insufficient heap memory
When the heap memory itself is indeed insufficient, the error message will be as follows:
OutOfMemoryError: Java heap space
Possible reasons are:
1. The number of active objects cannot fit in the heap space configured for them.
2. It may also be that the application has a memory leak: it continues to allocate new objects without letting other objects out of the scope.
In either case, heap dump analysis is necessary to find out which objects consume the most memory;
4. GC overhead limit reached
The last case in which the JVM throws OutOfMemoryError is that the JVM task spends too much time executing GC:
OutOfMemoryError: GC overhead limit exceeded
This error is thrown when all of the following conditions are met:
1. The time spent on Full GC exceeds the value specified by the - XX:GCTimeLimit=N flag. The default is 98
2. The amount of memory reclaimed by Full GC at one time is less than the value specified by the - XX:GCHeapFreeLimit=N flag. The default value is 2 (2%)
3. The above two conditions are true for 5 consecutive full GCS (this value cannot be adjusted)
4. - XX: + usegcoverhead limit flag is true (also true by default)
All four conditions must be met. Generally speaking, if you have more than 5 consecutive full GCS, you may not throw exceptions. Even if 98% of the time is spent on Full GC, the heap space released during each GC will exceed 2%. In this case, the value of - XX:GCHeapFreeLimit can be increased.
Please also note that if the first two conditions are true for 4 consecutive Full GC cycles, all soft references in the JVM will be released before the fifth Full GC as the last attempt to free memory. This often prevents this error because the fifth Full GC is likely to free more than 2% of heap memory (assuming that the application uses soft references).