1, Kafka monitoring indicators
1. Kafka host monitoring indicators
Host monitoring is to monitor the performance of the node machine where the Kafka cluster Broker is located. Common host monitoring indicators include:
(1) Machine Load
(2) CPU utilization
(3) Memory usage, including Free Memory and Used Memory
(4) Disk I/O utilization, including read utilization and write utilization
(5) I/O utilization
(6) Number of TCP connections
(7) Number of open files
(8) inode usage
2. JVM monitoring indicators
Kafka Broker process is an ordinary Java process, so all monitoring methods about JVM can be used to monitor Kafka Broker process.
(1) The frequency and duration of Full GC are used to evaluate the impact of Full GC on the Broker process. A long pause will cause the Broker to throw various timeout exceptions.
(2) The active object size is an important basis for setting the heap size, which can help fine-grained tune the heap size of each generation of the JVM.
(3) Total number of application threads. Understand the CPU usage of the Broker process.
2019-07-30t09:13:03.809 + 0800: 552.982: [GC cleanup 827m - > 645m (1024m), 0.0019078 secs] the Broker JVM process uses the G1 GC algorithm by default. When the cleanup step is completed, the size of active objects on the heap is reduced from 827MB to 645MB. Since Kafka version 0.9.0.0, the default GC collector is G1, and the Full GC in G1 is executed by a single thread, which is very slow. Therefore, it is necessary to monitor the Broker GC log, that is, kafkaserver GC Log file. If the Broker process is found to have frequent Full GC, you can turn on the - XX:+PrintAdaptiveSizePolicy switch of G1 to let the JVM indicate who caused the Full GC.
3. Cluster monitoring indicators
(1) Check whether the Broker process is started and whether the port is established. In a containerized Kafka environment, when using Docker to start Kafka Broker, although the Docker container is successfully started, if the network settings are wrong, there may be a situation that the process has been started but the port has not successfully established listening.
(2) View the broker side key logs. Broker server log Log, controller log Log and subject partition state change log state change log.
(3) View the running status of key threads on the Broker side. The Kafka Broker process will start more than a dozen or even dozens of threads. In the actual production environment, the log comparison thread starts with Kafka log cleaner thread and is responsible for log comparison; The thread that pulls messages from the replica, usually starting with ReplicaFetcherThread, is responsible for executing the logic of pulling messages from the Follower replica to the Leader replica.
(4) View the key JMX indicators on the Broker side.
BytesIn/BytesOut: refers to the number of inbound and outbound bytes per second at the Broker end. If the value is close to the network bandwidth, it is prone to network packet loss.
NetworkProcessorAvgIdlePercent: refers to the average idle ratio of threads in the network thread pool. It is usually necessary to ensure that its value is greater than 30% for a long time. If it is less than 30%, it indicates that the network thread pool is very busy. You need to reduce the burden on the Broker by increasing the number of network threads or transferring the load to other servers.
RequestHandlerAvgIdlePercent: the average idle ratio of I/O thread pool threads. If the value is less than 30% for a long time, you need to adjust the number of I/O thread pools or reduce the load on the Broker side.
Under replicated partitions: the number of partitions that were not fully backed up. The so-called insufficient backup means that not all Follower copies are synchronized with the Leader copy.
Isrlink / isrexpand: refers to the frequency index of ISR contraction and expansion. If the replica in ISR is frequently accessed in the production environment, its value must be very high. It is necessary to diagnose the cause of frequent access of copies to ISR and take appropriate measures.
ActiveControllerCount: the number of controllers that are currently active. Generally, the ActiveControllerCount indicator value on the Broker where the Controller is located is 1, and the value on other brokers is 0. If the ActiveControllerCount value on multiple brokers is 1, it indicates that there is a brain crack in Kafka cluster, which must be handled as soon as possible. The processing method is mainly to check the network connectivity. Brain crack is a very serious distributed fault. Kafka currently relies on ZooKeeper to prevent brain crack. Once brain crack occurs, Kafka cannot ensure normal operation.
(5) Monitor Kafka client. The network round trip time (RTT) between the machine where the client is located and the Kafka Broker machine. For producers, threads starting with Kafka Producer network thread are responsible for sending actual messages. Once they hang up, the Producer will not work normally, but the Producer process will not hang up automatically. For consumers, the heartbeat thread starting with Kafka coordinator heartbeat thread is related to Rebalance.
From the perspective of Producer, the JMX index that needs attention is request latency, that is, the delay of message production request, which directly represents the TPS of Producer program; From the perspective of consumers, records lag and records lead are two important JMX indicators. If you use Consumer Group, you need to pay attention to the join rate and sync rate indicators, which indicate the frequency of rebalancing.
2, JMX monitoring Kafka
1. Introduction to JMX
JMX (Java Management Extensions) can manage and monitor running Java programs, which are used to manage threads, memory, log Level, service restart, system environment, etc.
2. Kafka turns on JMX
There are two ways to open JMX ports:
(1) Set JMX when starting Kafka_ PORT
export JMX_PORT=9999 kafka-server-start.sh -daemon config/server.properties
(2) Modify Kafka run class sh
In Kafka run class The SH file begins with the following lines:
JMX_PORT=9999
Modify Kafka run class Restart the Kafka cluster after the file.
(3) JMX startup of Kafka Docker container service
Docker compose. For Kafka container service YML file import KAFKA_JMX_OPTS and JMX_PORT environment variable.
KAFKA_JMX_OPTS: "-Dcom.sun.management.jmxremote -Dcom.sun.management.jmxremote.authenticate=false -Dcom.sun.management.jmxremote.ssl=false -Djava.rmi.server.hostname=192.168.0.105 -Dcom.sun.management.jmxremote.rmi.port=9999"
JMX_PORT: 9999
Expose the corresponding JMX port to the outside world.
ports:
      - "9999:9999" # External exposure port number
3,JMX_PORT occupancy problem
When Kafka needs to monitor Broker and Topic data, it needs to turn on JMX_PORT, usually in the script Kafka run class JMX is defined in SH_ Port variable, but JMX_ After the port definition is completed, the script tool under the bin directory will report an error. The reason is
kafka-run-class.sh is the called script. When called by other scripts, Java will bind JMX_PORT, causing the port to be occupied.
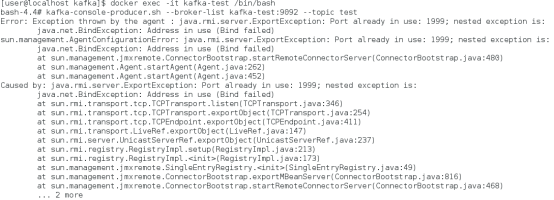
The workaround is to specify JMX when performing Kafka startup_ PORT.
(1) Supervisor starts Kafka and adds environment = JMX to the supervisor service startup configuration file_ PORT=9999.
(2)kafka-server-start. The SH script starts Kafka and exports JMX at startup_ Port = 9999 or at Kafka server start Specified by the SH script.
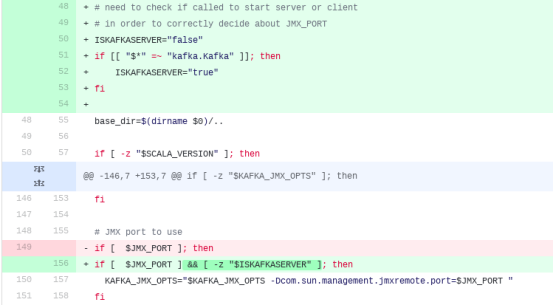
(3) Modify Kafka run class SH script
Modify bin / Kafka run class. In the Kafka installation directory SH file:
III. Kafka monitoring tool
1. JMXTool tool
JMXTool is a tool of Kafka community, which can view Kafka JMX indicators in real time.
kafka-run-class.sh kafka.tools.JmxTool
--attributes: Specifies the JMX attribute name to query, which is in comma separated CSV format.
--Date format: Specifies the format of the displayed log
--JMX URL: Specifies the JMX interface to be connected. The default format is service:jmx:rmi:///jndi/rmi://:JMX Port / jmxrmi.
--Object name: Specifies the name of the JMX MBean to query.
--Reporting interval: Specifies the time interval of real-time query, which is 2s by default.
Query the inbound traffic per second (bytesinpercec) of the Broker in the past 1 minute every second. The command is as follows:
kafka-run-class.sh kafka.tools.JmxTool --object-name kafka.server:type=BrokerTopicMetrics,name=BytesInPerSec --jmx-url service:jmx:rmi:///jndi/rmi://:9999/jmxrmi --date-format "YYYY-MM-dd HH:mm:ss" --attributes OneMinuteRate --reporting-interval 1000
The ActiveController JMX index view command is as follows:
kafka-run-class.sh kafka.tools.JmxTool --object-name kafka.controller:type=KafkaController,name=ActiveControllerCount --jmx-url service:jmx:rmi:///jndi/rmi://:9999/jmxrmi --date-format "YYYY-MM-dd HH:mm:ss" --reporting-interval 1000
2,Kafka Manager
Kafka Manager is a Kafka monitoring framework opened by Yahoo in 2015. It is developed in Scala language and is mainly used to manage and monitor Kafka clusters.
Kafka Manager has been renamed CMAK (Cluster Manager for Apache Kafka).
GitHub address:
Kafka manager Docker image: kafkamanager / Kafka Manager
If you need to set Kafka manager basic security authentication, you can set environment variables for Kafka Manager:
KAFKA_MANAGER_AUTH_ENABLED: "true"
KAFKA_MANAGER_USERNAME: username
KAFKA_MANAGER_PASSWORD: password
Kafka manager service deployment docker compose The YML file is as follows:
# Define Kafka Manager Service
kafka-manager-test:
  image: kafkamanager/kafka-manager # Kafka manager image
  restart: always
  container_name: kafka-manager-test
  hostname: kafka-manager-test
  ports:
    - "9000:9000"  # External exposure port to provide web access
  depends_on:
    - kafka-test # rely on
  environment:
    ZK_HOSTS: zookeeper-test:2181 # Host IP
    KAFKA_BROKERS: kafka-test:9090 # kafka
    KAFKA_MANAGER_AUTH_ENABLED: "true"
    KAFKA_MANAGER_USERNAME: admin
    KAFKA_MANAGER_PASSWORD: password
Start Kafka Manager service and log in to Kafka Manager Web.
Web address: http://127.0.0.1:9000

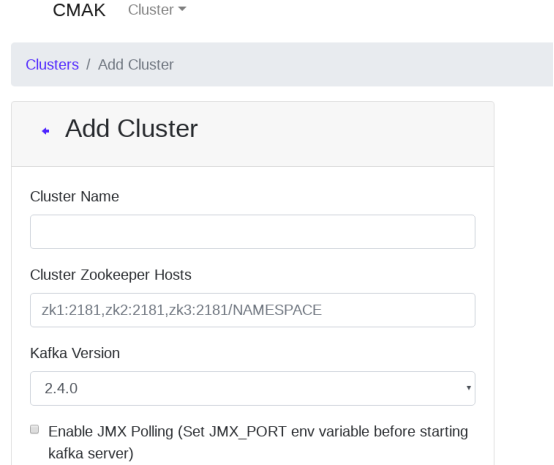
Add Kafka manager management node:
3,JMXTrans + InfluxDB + Grafana
Generally, the monitoring framework can use the combination of JMXTrans + InfluxDB + Grafana. Since Grafana supports the monitoring of JMX indicators, it is easy to integrate various JMX indicators of Kafka. For companies that have adopted JMXTrans + InfluxDB + Grafana monitoring scheme, they can directly reuse the existing monitoring framework, which can greatly save operation and maintenance costs.
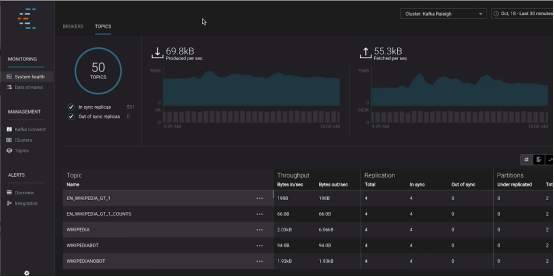
4,Confluent Control Center
The Control Center can monitor the Kafka cluster in real time and help operate and build real-time streaming applications based on Kafka. The Control Center is not free. You must use the Confluent Kafka Platform enterprise edition to use it.
5,jconsole
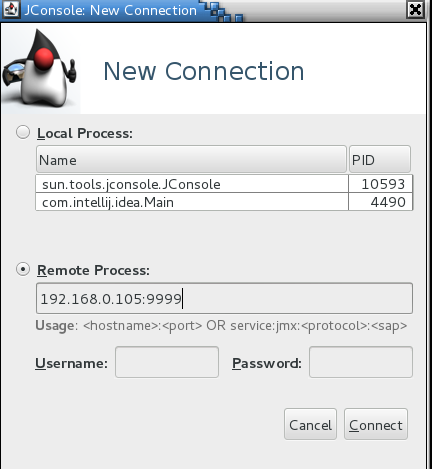
Jconsole (Java Monitoring and Management Console) is a visual monitoring and management tool based on JMX. It provides overview, memory, thread, class, VM overview and MBean monitoring.
Execute jsoncole in Linux Terminal and enter service: JMX: in the remote process of the pop-up window rmi:///jndi/rmi://192.168.0.105:9999/jmxrmi Or 192.168.0.105:9999.
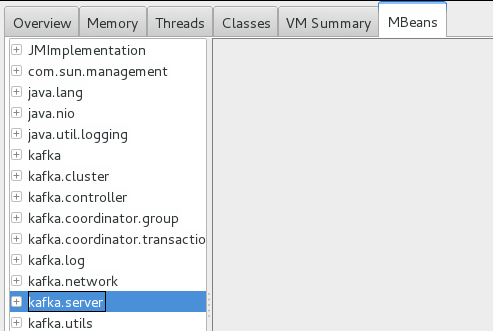
Select the MBeans tab,
6,KafkaCenter
KafkaCenter is the implementation practice of EC Bigdata Team with many years of kafka experience. It integrates unified one-stop solutions such as cluster management, cluster operation and maintenance, production monitoring, consumption monitoring and surrounding ecology. At present, it has been open source.
Main functional modules of KafkaCenter:
(1) Home: view the Kafka Cluster cluster information and monitoring information managed by the platform.
(2) Topic: users can view their own topics, initiate applications for new topics, and conduct production and consumption tests on topics.
(3) Monitor: users can view the production and consumption of topics, and set alert information for consumption delay.
(4) Kafka Connect: enables users to quickly create their own Connect jobs and maintain their own Connect.
(5) KSQL: enables users to quickly create their own KSQL jobs and maintain their own jobs.
(6) Approve: it is mainly used when ordinary users apply to create topics and the administrator approves them.
(7) Setting: the main function is to maintain User, Team and kafka cluster information for administrators.
(8) Kafka Manager: used for the normal maintenance of the cluster by the administrator.
GitHub address: https://github.com/xaecbd/KafkaCenter
4, JMXTrans
1. Introduction to JMXTrans
JMXTrans is a data collector that collects Java applications through JMX. As long as the Java application opens the JMX port, it can collect data.
JMXTrans runs in the form of deamon at the back station and collects data every 1 minute.
GitHub address: https://github.com/jmxtrans/jmxtrans
JMXTrans Docker container image download:
docker pull jmxtrans/jmxtrans
2. JMXTrans configuration file
JMXTrans reads all data source configuration files (json format files) in / var/lib/jmxtrans directory by default, obtains data from the data source in real time, parses the data and stores it in InfluxDB.
JMXTrans configuration JSON file is as follows:
{
   "servers": [{
      "port": "9901",
      "host": "192.168.0.105",
      "queries": [{
         "obj": "kafka.server:type=BrokerTopicMetrics,name=MessagesInPerSec",
         "attr": ["MeanRate", "OneMinuteRate", "FiveMinuteRate", "FifteenMinuteRate"],
         "resultAlias": "kafkaServer",
         "outputWriters": [{
            "@class": "com.googlecode.jmxtrans.model.output.InfluxDbWriterFactory",
            "url": "http://192.168.0.105:8086/",
            "username": "admin",
            "password": "123456",
            "database": "jmx",
            "tags": {
               "application": "kafka_server"
            }
         }]
      }]
   }]
}
servers: array, data source configuration.
Port: string, the port that receives the json data of jmx
host: string, the IP address of the json data received by jmx
queries: array, specific monitoring indicator items. Multiple indicator items are listed in JSON format. Monitoring indicators can be obtained through jconsole tool (JDK's own tool).
obj: string, name of monitoring indicator
attr: array, the index item field to be stored, is the field name of the data target table
resultAlias: string, table name in incluxdb
outputWriters: array, data destination
@Class: string, the class of data destination
url: string, the url of the data destination (InfluxDb)
username: string, incluxdb login name
Password: string, infixdb login password
Database: string, incluxdb database name (need to be created in advance)
tags: json to avoid duplicate names of fields corresponding to indicator items in the InfluxDbB table
3. Kafka JMX monitoring indicators
The JMX monitoring indicators of Kafka can be obtained through jconsole.
For BytesInPerSec monitoring indicators, find BytesInPerSe on the MBeans option page of jconsole.
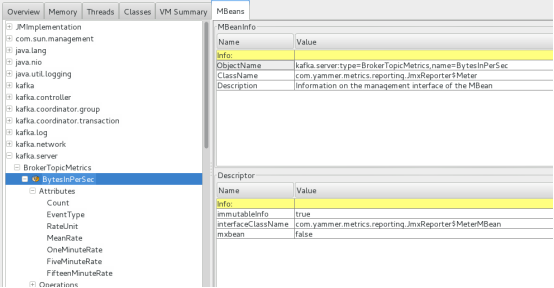
The value of ObjectName is the value of monitoring indicator obj.
The attribute of ObjectName is the indicator value corresponding to "attr". You can select one or more.
The metric name is the indicator value corresponding to resultAlias, and the measurement name in InfluxDB.
"tags" corresponds to the tag function of InfluxDB, which is used to distinguish from different monitoring indicators stored in the same measures.
{
   "obj":"kafka.server:type=BrokerTopicMetrics,name=BytesInPerSec",
         "attr":[ "Count", "EventType","RateUnit","OneMinuteRate" ],
         "resultAlias":"BytesInPerSec",
         "outputWriters": [{
      "@class" :   "com.googlecode.jmxtrans.model.output.InfluxDbWriterFactory",
              "url" :   "http://192.168.0.105:8086/",
              "username" :   "admin",
              "password" :   "123456",
              "database" :   "jmx",
              "tags"     :  {
         "application" :   "BytesInPerSec"
      }
   } ]
}
For global monitoring, each monitoring indicator corresponds to an InfluxDB measurement, and the same monitoring indicator data of all Kafka nodes is written into the same measurement; For the monitoring indicators of a Topic, all Kafka nodes of the same Topic are written to the same measures and named after the Topic.
{
  "servers" : [ {
    "port" : "9999",
    "host" : "192.168.0.105",
    "queries" : [ {
      "obj" : "java.lang:type=Memory",
      "attr" : [ "HeapMemoryUsage", "NonHeapMemoryUsage" ],
      "resultAlias":"jvmMemory",
      "outputWriters" : [ {
        "@class" : "com.googlecode.jmxtrans.model.output.InfluxDbWriterFactory",
        "url" : "http://192.168.0.105:8086/",
        "username" : "admin",
        "password" : "123456",
        "database" : "jmx",
        "tags"     : {"application" : "kafka_server"}
      } ]
    },{
      "obj" : "kafka.server:type=BrokerTopicMetrics,name=MessagesInPerSec",
      "attr" : [ "MeanRate","OneMinuteRate","FiveMinuteRate","FifteenMinuteRate" ],
      "resultAlias":"kafkaServer",
      "outputWriters" : [ {
        "@class" : "com.googlecode.jmxtrans.model.output.InfluxDbWriterFactory",
        "url" : "http://192.168.0.105:8086/",
        "username" : "admin",
        "password" : "123456",
        "database" : "jmx",
        "tags"     : {"application" : "kafka_server"}
      } ]
    },{
      "obj" : "kafka.server:type=BrokerTopicMetrics,name=BytesInPerSec",
      "attr" : [ "MeanRate","OneMinuteRate","FiveMinuteRate","FifteenMinuteRate" ],
      "resultAlias":"kafkaServer",
      "outputWriters" : [ {
        "@class" : "com.googlecode.jmxtrans.model.output.InfluxDbWriterFactory",
        "url" : "http://192.168.0.105:8086/",
        "username" : "admin",
        "password" : "123456",
        "database" : "jmx",
        "tags"     : {"application" : "kafka_server"}
      } ]
    },{
      "obj" : "kafka.server:type=BrokerTopicMetrics,name=BytesOutPerSec",
      "attr" : [ "MeanRate","OneMinuteRate","FiveMinuteRate","FifteenMinuteRate" ],
      "resultAlias":"kafkaServer",
      "outputWriters" : [ {
        "@class" : "com.googlecode.jmxtrans.model.output.InfluxDbWriterFactory",
        "url" : "http://192.168.0.105:8086/",
        "username" : "admin",
        "password" : "123456",
        "database" : "jmx",
        "tags"     : {"application" : "kafka_server"}
      } ]
    },{
      "obj" : "kafka.server:type=BrokerTopicMetrics,name=FailedProduceRequestsPerSec",
      "attr" : [ "MeanRate","OneMinuteRate","FiveMinuteRate","FifteenMinuteRate" ],
      "resultAlias":"kafkaServer",
      "outputWriters" : [ {
        "@class" : "com.googlecode.jmxtrans.model.output.InfluxDbWriterFactory",
        "url" : "http://192.168.0.105:8086/",
        "username" : "admin",
        "password" : "123456",
        "database" : "jmx",
        "tags"     : {"application" : "kafka_server"}
      } ]
    },{
      "obj" : "kafka.server:type=BrokerTopicMetrics,name=FailedFetchRequestsPerSec",
      "attr" : [ "MeanRate","OneMinuteRate","FiveMinuteRate","FifteenMinuteRate" ],
      "resultAlias":"kafkaServer",
      "outputWriters" : [ {
        "@class" : "com.googlecode.jmxtrans.model.output.InfluxDbWriterFactory",
        "url" : "http://192.168.0.105:8086/",
        "username" : "admin",
        "password" : "123456",
        "database" : "jmx",
        "tags"     : {"application" : "kafka_server"}
      } ]
    },{
      "obj" : "kafka.server:type=BrokerTopicMetrics,name=TotalFetchRequestsPerSec",
      "attr" : [ "MeanRate","OneMinuteRate","FiveMinuteRate","FifteenMinuteRate" ],
      "resultAlias":"kafkaServer",
      "outputWriters" : [ {
        "@class" : "com.googlecode.jmxtrans.model.output.InfluxDbWriterFactory",
        "url" : "http://192.168.0.105:8086/",
        "username" : "admin",
        "password" : "123456",
        "database" : "jmx",
        "tags"     : {"application" : "kafka_server"}
      } ]
    },{
      "obj" : "kafka.server:type=BrokerTopicMetrics,name=TotalProduceRequestsPerSec",
      "attr" : [ "MeanRate","OneMinuteRate","FiveMinuteRate","FifteenMinuteRate" ],
      "resultAlias":"kafkaServer",
      "outputWriters" : [ {
        "@class" : "com.googlecode.jmxtrans.model.output.InfluxDbWriterFactory",
        "url" : "http://192.168.0.105:8086/",
        "username" : "admin",
        "password" : "123456",
        "database" : "jmx",
        "tags"     : {"application" : "kafka_server"}
      } ]
    },{
      "obj" : "kafka.server:type=ReplicaManager,name=UnderReplicatedPartitions",
      "attr" : [ "Value" ],
      "resultAlias":"underReplicated",
      "outputWriters" : [ {
        "@class" : "com.googlecode.jmxtrans.model.output.InfluxDbWriterFactory",
        "url" : "http://192.168.0.105:8086/",
        "username" : "admin",
        "password" : "123456",
        "database" : "jmx",
        "tags"     : {"application" : "kafka_server"}
      } ]
    },{
      "obj" : "kafka.controller:type=KafkaController,name=ActiveControllerCount",
      "attr" : [ "Value" ],
      "resultAlias":"activeController",
      "outputWriters" : [ {
        "@class" : "com.googlecode.jmxtrans.model.output.InfluxDbWriterFactory",
        "url" : "http://192.168.0.105:8086/",
        "username" : "admin",
        "password" : "123456",
        "database" : "jmx",
        "tags"     : {"application" : "kafka_server"}
      } ]
    },{
      "obj" : "java.lang:type=OperatingSystem",
      "attr" : [ "FreePhysicalMemorySize","SystemCpuLoad","ProcessCpuLoad","SystemLoadAverage" ],
      "resultAlias":"jvmMemory",
      "outputWriters" : [ {
        "@class" : "com.googlecode.jmxtrans.model.output.InfluxDbWriterFactory",
        "url" : "http://192.168.0.105:8086/",
        "username" : "admin",
        "password" : "123456",
        "database" : "jmx",
        "tags"     : {"application" : "kafka_server"}
      } ]
    } ,{
      "obj" : "kafka.network:type=SocketServer,name=NetworkProcessorAvgIdlePercent",
      "attr" : [ "Value" ],
      "resultAlias":"network",
      "outputWriters" : [ {
        "@class" : "com.googlecode.jmxtrans.model.output.InfluxDbWriterFactory",
        "url" : "http://192.168.0.105:8086/",
        "username" : "admin",
        "password" : "123456",
        "database" : "jmx",
        "tags"     : {"application" : "kafka_server"}
      } ]
    },{
      "obj" : "kafka.server:type=KafkaRequestHandlerPool,name=RequestHandlerAvgIdlePercent",
      "attr" : [ "MeanRate","OneMinuteRate","FiveMinuteRate","FifteenMinuteRate" ],
      "resultAlias":"network",
      "outputWriters" : [ {
        "@class" : "com.googlecode.jmxtrans.model.output.InfluxDbWriterFactory",
        "url" : "http://192.168.0.105:8086/",
        "username" : "admin",
        "password" : "123456",
        "database" : "jmx",
        "tags"     : {"application" : "kafka_server"}
      } ]
    },{
      "obj" : "java.lang:type=GarbageCollector,name=G1 Young Generation",
      "attr" : [ "CollectionCount","CollectionTime" ],
      "resultAlias":"gc",
      "outputWriters" : [ {
        "@class" : "com.googlecode.jmxtrans.model.output.InfluxDbWriterFactory",
        "url" : "http://192.168.0.105:8086/",
        "username" : "admin",
        "password" : "123456",
        "database" : "jmx",
        "tags"     : {"application" : "kafka_server"}
      } ]
    }]
  } ]
}
4. JMXTrans deployment
JMX is connected through the network, so JMXtrans has two deployment schemes:
(1) Centralized. Deploy JMXtrans on one server, connect all Kafka Broker instances respectively, and write data to InfluxDB. In order to reduce network transmission, it is usually deployed to the server where InfluxDB is located.
(2) Distributed. Each Kafka Broker instance deploys a JMXtrans.
JMXTrans configuration files are divided into global indicators (each Kafka node) and Topic indicators. Global indicators are a configuration file for each node. The naming rule is Kafka brokerxx JSON, Topic index is a configuration file for each Topic, and the naming rule is topicname json.
5, Example of Kafka monitoring scheme
1. Kafka monitoring architecture scheme selection
The architecture of monitoring system is usually divided into three parts: data acquisition, analysis and conversion, and data display (visualization).
(1) Data acquisition
Data acquisition usually develops data acquisition program first, and then uses Nagios, Zabbix and other monitoring software to schedule execution, and reports the collected data. For Java programs, you can use JMXTrans to collect data.
(2) Analysis and transformation
Kafka is a Java application. The performance index data provided by Kafka has been very comprehensive. The histogram, times, maximum and minimum and standard variance of the index have been calculated. Therefore, there is no need to analyze and process the data, and the MBeans data is directly stored in InfluxDB.
(3) Data visualization
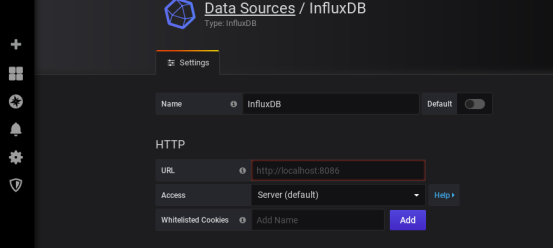
Grafana is an open source Dashboard that supports Graphite, Zabbix, InfluxDB, Prometheus and OpenTSDB as data sources.
2. InfluxDB deployment
InfluxDB is an open source distributed time series, events and indicators database written in Go language. It does not need external dependence. It is mainly used to store a large amount of timestamp data, such as DevOps monitoring data, APP metrics, lOT sensor data and real-time analysis data.
docker pull influxdb
influxdb.yml file:
version: '2'
services:
  influxdb:
    image: influxdb
    container_name: influxdb
    volumes:
      - /data/influxdb/conf:/etc/influxdb
      - /data/influxdb/data:/var/lib/influxdb/data
      - /data/influxdb/meta:/var/lib/influxdb/meta
      - /data/influxdb/wal:/var/lib/influxdb/wal
    ports:
      - "8086:8086"
    restart: always
Result view:
docker exec -it influxdb influx
3. JMXTrans deployment
JMXTrans is a data collector that collects Java applications through JMX. As long as the Java application opens the JMX port, it can collect data.
docker pull jmxtrans/jmxtrans
JMXTrans reads all data source configuration files (json format files) in / var/lib/jmxtrans directory by default, obtains data from the data source in real time, parses the data and stores it in InfluxDB.
version: '2'
services:
  # JMXTrans service
  jmxtrans:
    image: jmxtrans/jmxtrans
    container_name: jmxtrans
    volumes:
      - ./jmxtrans:/var/lib/jmxtrans
4. Grafana deployment
Grafana is a visual Dashboard with beautiful charts and layout display, fully functional measurement Dashboard and graphic editor, and supports Graphite, zabbix, InfluxDB, Prometheus and OpenTSDB as data sources.
The main features of Grafana are as follows:
(1) Display method: fast and flexible client-side chart. The panel plug-in has many different visual indicators and logs. There are rich dashboard plug-ins in the official library, such as heat map, line chart, chart and other display methods.
(2) Data sources: Graphite, InfluxDB, OpenTSDB, Prometheus, Elasticsearch, CloudWatch, KairosDB, etc.
(3) Notification reminder: define the alarm rules of the most important indicators in a visual way. Grafana will continuously calculate and send notifications, and get notifications through Slack, PagerDuty, etc. when the data reaches the threshold.
(4) Mixed display: mix different data sources in the same chart. You can specify data sources based on each query or even customize data sources.
(5) Note: using rich event annotation charts from different data sources, hovering over the event will display the complete event metadata and tags.
(6) Filters: ad hoc filters allow dynamic creation of new key / value filters, which are automatically applied to all queries using the data source.
GitHub address: https://github.com/grafana/grafana
Grafana container image download:
docker pull grafana/grafana:6.5.0
Grafana container startup:
docker run -d --name=grafana -p 3000:3000 grafana/grafana:6.5.0
Web login: 192.168.0.105:3000
admin/admin login is used by default for the first login, and the password will be forced to be changed after login.
Add data source:
Import DashBoard template:

The DashBoard template json file is as follows:
{
"__inputs": [
{
"name": "DS_KAFKAMONITOR",
"label": "KafkaMonitor",
"description": "",
"type": "datasource",
"pluginId": "influxdb",
"pluginName": "InfluxDB"
}
],
"__requires": [
{
"type": "grafana",
"id": "grafana",
"name": "Grafana",
"version": "6.7.3"
},
{
"type": "panel",
"id": "graph",
"name": "Graph",
"version": ""
},
{
"type": "datasource",
"id": "influxdb",
"name": "InfluxDB",
"version": "1.0.0"
}
],
"annotations": {
"list": [
{
"$$hashKey": "object:318",
"builtIn": 1,
"datasource": "-- Grafana --",
"enable": true,
"hide": true,
"iconColor": "rgba(0, 211, 255, 1)",
"name": "Annotations & Alerts",
"type": "dashboard"
}
]
},
"editable": true,
"gnetId": null,
"graphTooltip": 0,
"id": null,
"links": [],
"panels": [
{
"aliasColors": {},
"bars": false,
"dashLength": 10,
"dashes": false,
"datasource": "${DS_KAFKAMONITOR}",
"description": "java.lang:type=OperatingSystem",
"fill": 1,
"fillGradient": 0,
"gridPos": {
"h": 12,
"w": 8,
"x": 0,
"y": 0
},
"hiddenSeries": false,
"id": 6,
"legend": {
"alignAsTable": true,
"avg": true,
"current": true,
"max": true,
"min": true,
"show": true,
"total": false,
"values": true
},
"lines": true,
"linewidth": 1,
"nullPointMode": "null",
"options": {
"dataLinks": []
},
"percentage": false,
"pointradius": 2,
"points": false,
"renderer": "flot",
"seriesOverrides": [],
"spaceLength": 10,
"stack": false,
"steppedLine": false,
"targets": [
{
"alias": "",
"groupBy": [
{
"params": [
"1m"
],
"type": "time"
},
{
"params": [
"hostname"
],
"type": "tag"
},
{
"params": [
"null"
],
"type": "fill"
}
],
"measurement": "jvmMemory",
"orderByTime": "ASC",
"policy": "default",
"refId": "A",
"resultFormat": "time_series",
"select": [
[
{
"params": [
"ProcessCpuLoad"
],
"type": "field"
},
{
"params": [],
"type": "last"
},
{
"params": [
"process CPU Utilization rate"
],
"type": "alias"
}
]
],
"tags": []
}
],
"thresholds": [],
"timeFrom": null,
"timeRegions": [],
"timeShift": null,
"title": "Kafka process CPU Utilization rate",
"tooltip": {
"shared": true,
"sort": 0,
"value_type": "individual"
},
"type": "graph",
"xaxis": {
"buckets": null,
"mode": "time",
"name": null,
"show": true,
"values": []
},
"yaxes": [
{
"$$hashKey": "object:1134",
"format": "percentunit",
"label": null,
"logBase": 1,
"max": null,
"min": null,
"show": true
},
{
"$$hashKey": "object:1135",
"format": "short",
"label": null,
"logBase": 1,
"max": null,
"min": null,
"show": true
}
],
"yaxis": {
"align": false,
"alignLevel": null
}
},
{
"aliasColors": {},
"bars": false,
"dashLength": 10,
"dashes": false,
"datasource": "${DS_KAFKAMONITOR}",
"description": "The server CPU Utilization rate",
"fill": 1,
"fillGradient": 0,
"gridPos": {
"h": 12,
"w": 8,
"x": 8,
"y": 0
},
"hiddenSeries": false,
"id": 2,
"legend": {
"alignAsTable": true,
"avg": true,
"current": true,
"max": true,
"min": true,
"show": true,
"total": false,
"values": true
},
"lines": true,
"linewidth": 1,
"nullPointMode": "null",
"options": {
"dataLinks": []
},
"percentage": false,
"pointradius": 2,
"points": false,
"renderer": "flot",
"seriesOverrides": [],
"spaceLength": 10,
"stack": false,
"steppedLine": false,
"targets": [
{
"alias": "",
"groupBy": [
{
"params": [
"1m"
],
"type": "time"
},
{
"params": [
"hostname"
],
"type": "tag"
},
{
"params": [
"null"
],
"type": "fill"
}
],
"measurement": "jvmMemory",
"orderByTime": "ASC",
"policy": "default",
"refId": "A",
"resultFormat": "time_series",
"select": [
[
{
"params": [
"SystemCpuLoad"
],
"type": "field"
},
{
"params": [],
"type": "last"
},
{
"params": [
"CPU Utilization rate"
],
"type": "alias"
}
]
],
"tags": []
}
],
"thresholds": [],
"timeFrom": null,
"timeRegions": [],
"timeShift": null,
"title": "CPU Utilization rate",
"tooltip": {
"shared": true,
"sort": 0,
"value_type": "individual"
},
"type": "graph",
"xaxis": {
"buckets": null,
"mode": "time",
"name": null,
"show": true,
"values": []
},
"yaxes": [
{
"$$hashKey": "object:369",
"format": "percentunit",
"label": null,
"logBase": 1,
"max": null,
"min": null,
"show": true
},
{
"$$hashKey": "object:370",
"format": "short",
"label": null,
"logBase": 1,
"max": null,
"min": null,
"show": true
}
],
"yaxis": {
"align": false,
"alignLevel": null
}
},
{
"aliasColors": {},
"bars": false,
"dashLength": 10,
"dashes": false,
"datasource": "${DS_KAFKAMONITOR}",
"description": "java.lang:type=OperatingSystem\nLinux System load",
"fill": 1,
"fillGradient": 0,
"gridPos": {
"h": 12,
"w": 8,
"x": 16,
"y": 0
},
"hiddenSeries": false,
"id": 4,
"legend": {
"alignAsTable": true,
"avg": false,
"current": true,
"max": true,
"min": false,
"show": true,
"total": false,
"values": true
},
"lines": true,
"linewidth": 1,
"nullPointMode": "null",
"options": {
"dataLinks": []
},
"percentage": false,
"pointradius": 2,
"points": false,
"renderer": "flot",
"seriesOverrides": [],
"spaceLength": 10,
"stack": false,
"steppedLine": false,
"targets": [
{
"alias": "",
"groupBy": [
{
"params": [
"1m"
],
"type": "time"
},
{
"params": [
"hostname"
],
"type": "tag"
},
{
"params": [
"null"
],
"type": "fill"
}
],
"measurement": "jvmMemory",
"orderByTime": "ASC",
"policy": "default",
"refId": "A",
"resultFormat": "time_series",
"select": [
[
{
"params": [
"SystemLoadAverage"
],
"type": "field"
},
{
"params": [],
"type": "last"
},
{
"params": [
"System load"
],
"type": "alias"
}
]
],
"tags": []
}
],
"thresholds": [],
"timeFrom": null,
"timeRegions": [],
"timeShift": null,
"title": "System load",
"tooltip": {
"shared": true,
"sort": 0,
"value_type": "individual"
},
"type": "graph",
"xaxis": {
"buckets": null,
"mode": "time",
"name": null,
"show": true,
"values": []
},
"yaxes": [
{
"$$hashKey": "object:656",
"format": "short",
"label": null,
"logBase": 1,
"max": null,
"min": null,
"show": true
},
{
"$$hashKey": "object:657",
"format": "short",
"label": null,
"logBase": 1,
"max": null,
"min": null,
"show": true
}
],
"yaxis": {
"align": false,
"alignLevel": null
}
},
{
"aliasColors": {},
"bars": false,
"dashLength": 10,
"dashes": false,
"datasource": "${DS_KAFKAMONITOR}",
"description": "Kafka each broker Amount of data per second, including__consumer_offsets topic",
"fill": 1,
"fillGradient": 0,
"gridPos": {
"h": 12,
"w": 8,
"x": 0,
"y": 12
},
"hiddenSeries": false,
"id": 34,
"legend": {
"alignAsTable": true,
"avg": false,
"current": true,
"max": true,
"min": true,
"show": true,
"total": false,
"values": true
},
"lines": true,
"linewidth": 1,
"nullPointMode": "null",
"options": {
"dataLinks": []
},
"percentage": false,
"pointradius": 2,
"points": false,
"renderer": "flot",
"seriesOverrides": [],
"spaceLength": 10,
"stack": false,
"steppedLine": false,
"targets": [
{
"alias": "",
"groupBy": [
{
"params": [
"1m"
],
"type": "time"
},
{
"params": [
"hostname"
],
"type": "tag"
}
],
"hide": false,
"measurement": "kafkaServer",
"orderByTime": "ASC",
"policy": "default",
"refId": "D",
"resultFormat": "time_series",
"select": [
[
{
"params": [
"OneMinuteRate"
],
"type": "field"
},
{
"params": [],
"type": "last"
},
{
"params": [
"Average per second"
],
"type": "alias"
}
]
],
"tags": [
{
"key": "typeName",
"operator": "=",
"value": "type=BrokerTopicMetrics,name=MessagesInPerSec"
}
]
},
{
"alias": "",
"groupBy": [
{
"params": [
"1m"
],
"type": "time"
}
],
"hide": false,
"measurement": "kafkaServer",
"orderByTime": "ASC",
"policy": "default",
"refId": "A",
"resultFormat": "time_series",
"select": [
[
{
"params": [
"OneMinuteRate"
],
"type": "field"
},
{
"params": [],
"type": "sum"
},
{
"params": [
"All broker Average per second"
],
"type": "alias"
}
]
],
"tags": [
{
"key": "typeName",
"operator": "=",
"value": "type=BrokerTopicMetrics,name=MessagesInPerSec"
}
]
}
],
"thresholds": [],
"timeFrom": null,
"timeRegions": [],
"timeShift": null,
"title": "Kafka Topic Data per second",
"tooltip": {
"shared": true,
"sort": 0,
"value_type": "individual"
},
"type": "graph",
"xaxis": {
"buckets": null,
"mode": "time",
"name": null,
"show": true,
"values": []
},
"yaxes": [
{
"$$hashKey": "object:2118",
"format": "none",
"label": null,
"logBase": 1,
"max": null,
"min": null,
"show": true
},
{
"$$hashKey": "object:2119",
"format": "short",
"label": null,
"logBase": 1,
"max": null,
"min": null,
"show": true
}
],
"yaxis": {
"align": false,
"alignLevel": null
}
},
{
"aliasColors": {},
"bars": false,
"dashLength": 10,
"dashes": false,
"datasource": "${DS_KAFKAMONITOR}",
"description": "java.lang:type=OperatingSystem\n Server available physical memory",
"fill": 1,
"fillGradient": 0,
"gridPos": {
"h": 12,
"w": 8,
"x": 8,
"y": 12
},
"hiddenSeries": false,
"id": 32,
"legend": {
"alignAsTable": true,
"avg": false,
"current": true,
"max": false,
"min": false,
"show": true,
"total": false,
"values": true
},
"lines": true,
"linewidth": 1,
"nullPointMode": "null",
"options": {
"dataLinks": []
},
"percentage": false,
"pointradius": 2,
"points": false,
"renderer": "flot",
"seriesOverrides": [],
"spaceLength": 10,
"stack": false,
"steppedLine": false,
"targets": [
{
"alias": "",
"groupBy": [
{
"params": [
"1m"
],
"type": "time"
},
{
"params": [
"hostname"
],
"type": "tag"
},
{
"params": [
"null"
],
"type": "fill"
}
],
"measurement": "jvmMemory",
"orderByTime": "ASC",
"policy": "default",
"refId": "A",
"resultFormat": "time_series",
"select": [
[
{
"params": [
"FreePhysicalMemorySize"
],
"type": "field"
},
{
"params": [],
"type": "last"
},
{
"params": [
"Remaining physical memory in the system"
],
"type": "alias"
}
]
],
"tags": []
}
],
"thresholds": [],
"timeFrom": null,
"timeRegions": [],
"timeShift": null,
"title": "free physical memory",
"tooltip": {
"shared": true,
"sort": 0,
"value_type": "individual"
},
"type": "graph",
"xaxis": {
"buckets": null,
"mode": "time",
"name": null,
"show": true,
"values": []
},
"yaxes": [
{
"$$hashKey": "object:2324",
"format": "decbytes",
"label": null,
"logBase": 1,
"max": null,
"min": null,
"show": true
},
{
"$$hashKey": "object:2325",
"format": "short",
"label": null,
"logBase": 1,
"max": null,
"min": null,
"show": true
}
],
"yaxis": {
"align": false,
"alignLevel": null
}
},
{
"aliasColors": {},
"bars": false,
"cacheTimeout": null,
"dashLength": 10,
"dashes": false,
"datasource": "${DS_KAFKAMONITOR}",
"description": "kafka.controller:type=KafkaController,name=ActiveControllerCount\n\nKafka The number of controllers, only one machine in each cluster is 1, and the machine with 1 is Kafka controller Crontroller",
"fill": 1,
"fillGradient": 0,
"gridPos": {
"h": 12,
"w": 8,
"x": 16,
"y": 12
},
"hiddenSeries": false,
"id": 26,
"legend": {
"alignAsTable": true,
"avg": false,
"current": true,
"max": false,
"min": false,
"show": true,
"total": false,
"values": true
},
"lines": true,
"linewidth": 1,
"links": [],
"nullPointMode": "null",
"options": {
"dataLinks": []
},
"percentage": false,
"pluginVersion": "6.7.3",
"pointradius": 2,
"points": false,
"renderer": "flot",
"seriesOverrides": [],
"spaceLength": 10,
"stack": false,
"steppedLine": false,
"targets": [
{
"alias": "",
"groupBy": [
{
"params": [
"1m"
],
"type": "time"
},
{
"params": [
"hostname"
],
"type": "tag"
}
],
"measurement": "activeController",
"orderByTime": "ASC",
"policy": "default",
"query": "SELECT sum(\"Value\") AS \"Get the number of controllers\" FROM \"activeController\" WHERE $timeFilter GROUP BY time($__interval), \"hostname\"",
"rawQuery": false,
"refId": "A",
"resultFormat": "time_series",
"select": [
[
{
"params": [
"Value"
],
"type": "field"
},
{
"params": [],
"type": "last"
},
{
"params": [
"Get the number of controllers"
],
"type": "alias"
}
]
],
"tags": [],
"tz": ""
}
],
"thresholds": [],
"timeFrom": null,
"timeRegions": [],
"timeShift": null,
"title": "Kafka Number of controllers",
"tooltip": {
"shared": true,
"sort": 0,
"value_type": "individual"
},
"type": "graph",
"xaxis": {
"buckets": null,
"mode": "time",
"name": null,
"show": true,
"values": []
},
"yaxes": [
{
"$$hashKey": "object:4446",
"format": "short",
"label": null,
"logBase": 1,
"max": null,
"min": null,
"show": true
},
{
"$$hashKey": "object:4447",
"format": "short",
"label": null,
"logBase": 1,
"max": null,
"min": null,
"show": true
}
],
"yaxis": {
"align": false,
"alignLevel": null
}
},
{
"aliasColors": {},
"bars": false,
"dashLength": 10,
"dashes": false,
"datasource": "${DS_KAFKAMONITOR}",
"description": "monitor kafka.server:type=BrokerTopicMetrics,name=BytesOutPerSec index",
"fill": 1,
"fillGradient": 0,
"gridPos": {
"h": 9,
"w": 8,
"x": 0,
"y": 24
},
"hiddenSeries": false,
"id": 16,
"legend": {
"alignAsTable": true,
"avg": true,
"current": true,
"max": true,
"min": true,
"show": true,
"total": false,
"values": true
},
"lines": true,
"linewidth": 1,
"nullPointMode": "null",
"options": {
"dataLinks": []
},
"percentage": false,
"pointradius": 2,
"points": false,
"renderer": "flot",
"seriesOverrides": [],
"spaceLength": 10,
"stack": false,
"steppedLine": false,
"targets": [
{
"alias": "",
"groupBy": [
{
"params": [
"1m"
],
"type": "time"
},
{
"params": [
"hostname"
],
"type": "tag"
},
{
"params": [
"null"
],
"type": "fill"
}
],
"measurement": "kafkaServer",
"orderByTime": "ASC",
"policy": "default",
"refId": "A",
"resultFormat": "time_series",
"select": [
[
{
"params": [
"FiveMinuteRate"
],
"type": "field"
},
{
"params": [],
"type": "mean"
},
{
"params": [
"Bytes pulled per second"
],
"type": "alias"
}
]
],
"tags": [
{
"key": "typeName",
"operator": "=",
"value": "type=BrokerTopicMetrics,name=BytesOutPerSec"
}
]
}
],
"thresholds": [],
"timeFrom": null,
"timeRegions": [],
"timeShift": null,
"title": "Kafka Pull traffic per second",
"tooltip": {
"shared": true,
"sort": 0,
"value_type": "individual"
},
"type": "graph",
"xaxis": {
"buckets": null,
"mode": "time",
"name": null,
"show": true,
"values": []
},
"yaxes": [
{
"$$hashKey": "object:77",
"format": "decbytes",
"label": null,
"logBase": 1,
"max": null,
"min": null,
"show": true
},
{
"$$hashKey": "object:78",
"format": "short",
"label": null,
"logBase": 1,
"max": null,
"min": null,
"show": true
}
],
"yaxis": {
"align": false,
"alignLevel": null
}
},
{
"aliasColors": {},
"bars": false,
"dashLength": 10,
"dashes": false,
"datasource": "${DS_KAFKAMONITOR}",
"description": "monitor kafka.server:type=BrokerTopicMetrics,name=BytesInPerSec index",
"fill": 1,
"fillGradient": 0,
"gridPos": {
"h": 9,
"w": 8,
"x": 8,
"y": 24
},
"hiddenSeries": false,
"id": 14,
"legend": {
"alignAsTable": true,
"avg": true,
"current": true,
"max": true,
"min": true,
"show": true,
"total": false,
"values": true
},
"lines": true,
"linewidth": 1,
"nullPointMode": "null",
"options": {
"dataLinks": []
},
"percentage": false,
"pointradius": 2,
"points": false,
"renderer": "flot",
"seriesOverrides": [],
"spaceLength": 10,
"stack": false,
"steppedLine": false,
"targets": [
{
"alias": "",
"groupBy": [
{
"params": [
"1m"
],
"type": "time"
},
{
"params": [
"hostname"
],
"type": "tag"
},
{
"params": [
"null"
],
"type": "fill"
}
],
"measurement": "kafkaServer",
"orderByTime": "ASC",
"policy": "default",
"refId": "F",
"resultFormat": "time_series",
"select": [
[
{
"params": [
"OneMinuteRate"
],
"type": "field"
},
{
"params": [],
"type": "last"
},
{
"params": [
"Average number of bytes entered per second"
],
"type": "alias"
}
]
],
"tags": [
{
"key": "typeName",
"operator": "=",
"value": "type=BrokerTopicMetrics,name=BytesInPerSec"
}
]
}
],
"thresholds": [],
"timeFrom": null,
"timeRegions": [],
"timeShift": null,
"title": "Kafka Incoming traffic per second",
"tooltip": {
"shared": true,
"sort": 0,
"value_type": "individual"
},
"type": "graph",
"xaxis": {
"buckets": null,
"mode": "time",
"name": null,
"show": true,
"values": []
},
"yaxes": [
{
"$$hashKey": "object:77",
"format": "decbytes",
"label": null,
"logBase": 1,
"max": null,
"min": null,
"show": true
},
{
"$$hashKey": "object:78",
"format": "short",
"label": null,
"logBase": 1,
"max": null,
"min": null,
"show": true
}
],
"yaxis": {
"align": false,
"alignLevel": null
}
},
{
"aliasColors": {},
"bars": false,
"dashLength": 10,
"dashes": false,
"datasource": "${DS_KAFKAMONITOR}",
"description": "monitor kafka.server:type=BrokerTopicMetrics,name=TotalFetchRequestsPerSec and kafka.server:type=BrokerTopicMetrics,name=TotalProduceRequestsPerSec index",
"fill": 1,
"fillGradient": 0,
"gridPos": {
"h": 9,
"w": 8,
"x": 16,
"y": 24
},
"hiddenSeries": false,
"id": 20,
"legend": {
"alignAsTable": true,
"avg": true,
"current": true,
"max": true,
"min": true,
"show": true,
"total": false,
"values": true
},
"lines": true,
"linewidth": 1,
"nullPointMode": "null",
"options": {
"dataLinks": []
},
"percentage": false,
"pointradius": 2,
"points": false,
"renderer": "flot",
"seriesOverrides": [],
"spaceLength": 10,
"stack": false,
"steppedLine": false,
"targets": [
{
"alias": "",
"groupBy": [
{
"params": [
"1m"
],
"type": "time"
},
{
"params": [
"hostname"
],
"type": "tag"
},
{
"params": [
"null"
],
"type": "fill"
}
],
"measurement": "kafkaServer",
"orderByTime": "ASC",
"policy": "default",
"refId": "A",
"resultFormat": "time_series",
"select": [
[
{
"params": [
"OneMinuteRate"
],
"type": "field"
},
{
"params": [],
"type": "last"
},
{
"params": [
"Per second Fetch(obtain)Number of requests"
],
"type": "alias"
}
]
],
"tags": [
{
"key": "typeName",
"operator": "=",
"value": "type=BrokerTopicMetrics,name=TotalFetchRequestsPerSec"
}
]
},
{
"alias": "",
"groupBy": [
{
"params": [
"1m"
],
"type": "time"
},
{
"params": [
"hostname"
],
"type": "tag"
},
{
"params": [
"null"
],
"type": "fill"
}
],
"measurement": "kafkaServer",
"orderByTime": "ASC",
"policy": "default",
"refId": "D",
"resultFormat": "time_series",
"select": [
[
{
"params": [
"MeanRate"
],
"type": "field"
},
{
"params": [],
"type": "last"
},
{
"params": [
"Per second Producer Number of requests sent"
],
"type": "alias"
}
]
],
"tags": [
{
"key": "typeName",
"operator": "=",
"value": "type=BrokerTopicMetrics,name=TotalProduceRequestsPerSec"
}
]
}
],
"thresholds": [],
"timeFrom": null,
"timeRegions": [],
"timeShift": null,
"title": "Kafka Production and consumption requests per second",
"tooltip": {
"shared": true,
"sort": 0,
"value_type": "individual"
},
"type": "graph",
"xaxis": {
"buckets": null,
"mode": "time",
"name": null,
"show": true,
"values": []
},
"yaxes": [
{
"$$hashKey": "object:77",
"format": "short",
"label": null,
"logBase": 1,
"max": null,
"min": null,
"show": true
},
{
"$$hashKey": "object:78",
"format": "short",
"label": null,
"logBase": 1,
"max": null,
"min": null,
"show": true
}
],
"yaxis": {
"align": false,
"alignLevel": null
}
},
{
"aliasColors": {},
"bars": false,
"dashLength": 10,
"dashes": false,
"datasource": "${DS_KAFKAMONITOR}",
"description": "java.lang:type=Memory",
"fill": 1,
"fillGradient": 0,
"gridPos": {
"h": 13,
"w": 8,
"x": 0,
"y": 33
},
"hiddenSeries": false,
"id": 8,
"legend": {
"alignAsTable": true,
"avg": true,
"current": true,
"max": true,
"min": true,
"show": true,
"total": false,
"values": true
},
"lines": true,
"linewidth": 1,
"nullPointMode": "null",
"options": {
"dataLinks": []
},
"percentage": false,
"pointradius": 2,
"points": false,
"renderer": "flot",
"seriesOverrides": [],
"spaceLength": 10,
"stack": false,
"steppedLine": false,
"targets": [
{
"alias": "",
"groupBy": [
{
"params": [
"1m"
],
"type": "time"
},
{
"params": [
"hostname"
],
"type": "tag"
},
{
"params": [
"null"
],
"type": "fill"
}
],
"measurement": "jvmMemory",
"orderByTime": "ASC",
"policy": "default",
"refId": "E",
"resultFormat": "time_series",
"select": [
[
{
"params": [
"HeapMemoryUsage_used"
],
"type": "field"
},
{
"params": [],
"type": "last"
},
{
"params": [
"Heap memory usage"
],
"type": "alias"
}
]
],
"tags": []
}
],
"thresholds": [],
"timeFrom": null,
"timeRegions": [],
"timeShift": null,
"title": "Kafka Use heap memory",
"tooltip": {
"shared": true,
"sort": 0,
"value_type": "individual"
},
"type": "graph",
"xaxis": {
"buckets": null,
"mode": "time",
"name": null,
"show": true,
"values": []
},
"yaxes": [
{
"$$hashKey": "object:1850",
"format": "decbytes",
"label": null,
"logBase": 1,
"max": null,
"min": null,
"show": true
},
{
"$$hashKey": "object:1851",
"format": "short",
"label": null,
"logBase": 1,
"max": null,
"min": null,
"show": true
}
],
"yaxis": {
"align": false,
"alignLevel": null
}
},
{
"aliasColors": {},
"bars": false,
"dashLength": 10,
"dashes": false,
"datasource": "${DS_KAFKAMONITOR}",
"description": "java.lang:type=Memory",
"fill": 1,
"fillGradient": 0,
"gridPos": {
"h": 13,
"w": 8,
"x": 8,
"y": 33
},
"hiddenSeries": false,
"id": 30,
"legend": {
"alignAsTable": true,
"avg": true,
"current": true,
"max": true,
"min": true,
"show": true,
"total": false,
"values": true
},
"lines": true,
"linewidth": 1,
"nullPointMode": "null",
"options": {
"dataLinks": []
},
"percentage": false,
"pointradius": 2,
"points": false,
"renderer": "flot",
"seriesOverrides": [],
"spaceLength": 10,
"stack": false,
"steppedLine": false,
"targets": [
{
"alias": "",
"groupBy": [
{
"params": [
"1m"
],
"type": "time"
},
{
"params": [
"hostname"
],
"type": "tag"
},
{
"params": [
"null"
],
"type": "fill"
}
],
"measurement": "jvmMemory",
"orderByTime": "ASC",
"policy": "default",
"refId": "E",
"resultFormat": "time_series",
"select": [
[
{
"params": [
"NonHeapMemoryUsage_used"
],
"type": "field"
},
{
"params": [],
"type": "last"
},
{
"params": [
"External memory usage"
],
"type": "alias"
}
]
],
"tags": []
}
],
"thresholds": [],
"timeFrom": null,
"timeRegions": [],
"timeShift": null,
"title": "Kafka Using off heap memory",
"tooltip": {
"shared": true,
"sort": 0,
"value_type": "individual"
},
"type": "graph",
"xaxis": {
"buckets": null,
"mode": "time",
"name": null,
"show": true,
"values": []
},
"yaxes": [
{
"$$hashKey": "object:1850",
"format": "decbytes",
"label": null,
"logBase": 1,
"max": null,
"min": null,
"show": true
},
{
"$$hashKey": "object:1851",
"format": "short",
"label": null,
"logBase": 1,
"max": null,
"min": null,
"show": true
}
],
"yaxis": {
"align": false,
"alignLevel": null
}
},
{
"aliasColors": {},
"bars": false,
"dashLength": 10,
"dashes": false,
"datasource": "${DS_KAFKAMONITOR}",
"description": "kafka.server:type=ReplicaManager,name=UnderReplicatedPartitions\n If it is not 0, some copies cannot keep up leader",
"fill": 1,
"fillGradient": 0,
"gridPos": {
"h": 13,
"w": 8,
"x": 16,
"y": 33
},
"hiddenSeries": false,
"id": 24,
"legend": {
"alignAsTable": true,
"avg": false,
"current": true,
"max": true,
"min": true,
"show": true,
"total": false,
"values": true
},
"lines": true,
"linewidth": 1,
"nullPointMode": "null",
"options": {
"dataLinks": []
},
"percentage": false,
"pluginVersion": "6.7.3",
"pointradius": 2,
"points": false,
"renderer": "flot",
"seriesOverrides": [],
"spaceLength": 10,
"stack": false,
"steppedLine": false,
"targets": [
{
"alias": "",
"groupBy": [
{
"params": [
"1m"
],
"type": "time"
},
{
"params": [
"hostname"
],
"type": "tag"
},
{
"params": [
"null"
],
"type": "fill"
}
],
"measurement": "underReplicated",
"orderByTime": "ASC",
"policy": "default",
"refId": "A",
"resultFormat": "time_series",
"select": [
[
{
"params": [
"Value"
],
"type": "field"
},
{
"params": [],
"type": "last"
},
{
"params": [
"Number of partitions not fully backed up"
],
"type": "alias"
}
]
],
"tags": []
}
],
"thresholds": [],
"timeFrom": null,
"timeRegions": [],
"timeShift": null,
"title": "Number of partitions not fully backed up",
"tooltip": {
"shared": true,
"sort": 0,
"value_type": "individual"
},
"type": "graph",
"xaxis": {
"buckets": null,
"mode": "time",
"name": null,
"show": true,
"values": []
},
"yaxes": [
{
"$$hashKey": "object:11235",
"format": "short",
"label": null,
"logBase": 1,
"max": null,
"min": null,
"show": true
},
{
"$$hashKey": "object:11236",
"format": "short",
"label": null,
"logBase": 1,
"max": null,
"min": null,
"show": true
}
],
"yaxis": {
"align": false,
"alignLevel": null
}
},
{
"aliasColors": {},
"bars": false,
"cacheTimeout": null,
"dashLength": 10,
"dashes": false,
"datasource": "${DS_KAFKAMONITOR}",
"description": "",
"fill": 1,
"fillGradient": 0,
"gridPos": {
"h": 13,
"w": 8,
"x": 0,
"y": 46
},
"hiddenSeries": false,
"id": 12,
"legend": {
"alignAsTable": true,
"avg": false,
"current": true,
"max": true,
"min": true,
"show": true,
"total": false,
"values": true
},
"lines": true,
"linewidth": 1,
"links": [],
"nullPointMode": "null",
"options": {
"dataLinks": []
},
"percentage": false,
"pluginVersion": "6.7.3",
"pointradius": 2,
"points": false,
"renderer": "flot",
"seriesOverrides": [],
"spaceLength": 10,
"stack": false,
"steppedLine": false,
"targets": [
{
"alias": "",
"groupBy": [
{
"params": [
"5m"
],
"type": "time"
},
{
"params": [
"hostname"
],
"type": "tag"
},
{
"params": [
"null"
],
"type": "fill"
}
],
"measurement": "network",
"orderByTime": "ASC",
"policy": "default",
"refId": "A",
"resultFormat": "time_series",
"select": [
[
{
"params": [
"Value"
],
"type": "field"
},
{
"params": [],
"type": "mean"
},
{
"params": [
"Idle ratio of network thread pool"
],
"type": "alias"
}
]
],
"tags": []
}
],
"thresholds": [],
"timeFrom": null,
"timeRegions": [],
"timeShift": null,
"title": "Kafka Average idle ratio of network thread pool threads",
"tooltip": {
"shared": true,
"sort": 0,
"value_type": "individual"
},
"type": "graph",
"xaxis": {
"buckets": null,
"mode": "time",
"name": null,
"show": true,
"values": []
},
"yaxes": [
{
"$$hashKey": "object:13734",
"format": "percentunit",
"label": null,
"logBase": 1,
"max": null,
"min": null,
"show": true
},
{
"$$hashKey": "object:13735",
"format": "short",
"label": null,
"logBase": 1,
"max": null,
"min": null,
"show": true
}
],
"yaxis": {
"align": false,
"alignLevel": null
}
},
{
"aliasColors": {},
"bars": false,
"cacheTimeout": null,
"dashLength": 10,
"dashes": false,
"datasource": "${DS_KAFKAMONITOR}",
"description": "kafka.server:type=KafkaRequestHandlerPool,name=RequestHandlerAvgIdlePercent",
"fill": 1,
"fillGradient": 0,
"gridPos": {
"h": 13,
"w": 8,
"x": 8,
"y": 46
},
"hiddenSeries": false,
"id": 22,
"legend": {
"alignAsTable": true,
"avg": false,
"current": true,
"max": true,
"min": true,
"show": true,
"total": false,
"values": true
},
"lines": true,
"linewidth": 1,
"links": [],
"nullPointMode": "null",
"options": {
"dataLinks": []
},
"percentage": false,
"pluginVersion": "6.7.3",
"pointradius": 2,
"points": false,
"renderer": "flot",
"seriesOverrides": [],
"spaceLength": 10,
"stack": false,
"steppedLine": false,
"targets": [
{
"alias": "",
"groupBy": [
{
"params": [
"1m"
],
"type": "time"
},
{
"params": [
"hostname"
],
"type": "tag"
}
],
"measurement": "network",
"orderByTime": "ASC",
"policy": "default",
"refId": "A",
"resultFormat": "time_series",
"select": [
[
{
"params": [
"OneMinuteRate"
],
"type": "field"
},
{
"params": [],
"type": "last"
},
{
"params": [
"IO Idle ratio"
],
"type": "alias"
}
]
],
"tags": [
{
"key": "typeName",
"operator": "=",
"value": "type=KafkaRequestHandlerPool,name=RequestHandlerAvgIdlePercent"
}
]
}
],
"thresholds": [],
"timeFrom": null,
"timeRegions": [],
"timeShift": null,
"title": " I/O Average idle ratio of threads in thread pool",
"tooltip": {
"shared": true,
"sort": 0,
"value_type": "individual"
},
"type": "graph",
"xaxis": {
"buckets": null,
"mode": "time",
"name": null,
"show": true,
"values": []
},
"yaxes": [
{
"$$hashKey": "object:13517",
"format": "percentunit",
"label": null,
"logBase": 1,
"max": null,
"min": null,
"show": true
},
{
"$$hashKey": "object:13518",
"format": "short",
"label": null,
"logBase": 1,
"max": null,
"min": null,
"show": true
}
],
"yaxis": {
"align": false,
"alignLevel": null
}
},
{
"aliasColors": {},
"bars": false,
"dashLength": 10,
"dashes": false,
"datasource": "${DS_KAFKAMONITOR}",
"description": "monitor kafka.server:type=BrokerTopicMetrics,name=FailedFetchRequestsPerSec and kafka.server:type=BrokerTopicMetrics,name=TotalFetchRequestsPerSec index",
"fill": 1,
"fillGradient": 0,
"gridPos": {
"h": 13,
"w": 8,
"x": 16,
"y": 46
},
"hiddenSeries": false,
"id": 18,
"legend": {
"alignAsTable": true,
"avg": true,
"current": true,
"max": true,
"min": true,
"show": true,
"total": false,
"values": true
},
"lines": true,
"linewidth": 1,
"nullPointMode": "null",
"options": {
"dataLinks": []
},
"percentage": false,
"pointradius": 2,
"points": false,
"renderer": "flot",
"seriesOverrides": [],
"spaceLength": 10,
"stack": false,
"steppedLine": false,
"targets": [
{
"alias": "",
"groupBy": [
{
"params": [
"1m"
],
"type": "time"
},
{
"params": [
"hostname"
],
"type": "tag"
},
{
"params": [
"null"
],
"type": "fill"
}
],
"measurement": "kafkaServer",
"orderByTime": "ASC",
"policy": "default",
"refId": "H",
"resultFormat": "time_series",
"select": [
[
{
"params": [
"OneMinuteRate"
],
"type": "field"
},
{
"params": [],
"type": "last"
},
{
"params": [
"Per second Fetch(obtain)Abnormal request"
],
"type": "alias"
}
]
],
"tags": [
{
"key": "typeName",
"operator": "=",
"value": "type=BrokerTopicMetrics,name=FailedFetchRequestsPerSec"
}
]
},
{
"alias": "",
"groupBy": [
{
"params": [
"1m"
],
"type": "time"
},
{
"params": [
"hostname"
],
"type": "tag"
},
{
"params": [
"null"
],
"type": "fill"
}
],
"measurement": "kafkaServer",
"orderByTime": "ASC",
"policy": "default",
"refId": "J",
"resultFormat": "time_series",
"select": [
[
{
"params": [
"MeanRate"
],
"type": "field"
},
{
"params": [],
"type": "last"
},
{
"params": [
"Per second Producer Abnormal request"
],
"type": "alias"
}
]
],
"tags": [
{
"key": "typeName",
"operator": "=",
"value": "type=BrokerTopicMetrics,name=FailedProduceRequestsPerSec"
}
]
}
],
"thresholds": [],
"timeFrom": null,
"timeRegions": [],
"timeShift": null,
"title": "Kafka Number of failed production and consumption requests",
"tooltip": {
"shared": true,
"sort": 0,
"value_type": "individual"
},
"type": "graph",
"xaxis": {
"buckets": null,
"mode": "time",
"name": null,
"show": true,
"values": []
},
"yaxes": [
{
"$$hashKey": "object:77",
"format": "short",
"label": null,
"logBase": 1,
"max": null,
"min": null,
"show": true
},
{
"$$hashKey": "object:78",
"format": "short",
"label": null,
"logBase": 1,
"max": null,
"min": null,
"show": true
}
],
"yaxis": {
"align": false,
"alignLevel": null
}
}
],
"refresh": false,
"schemaVersion": 22,
"style": "dark",
"tags": [],
"templating": {
"list": []
},
"time": {
"from": "now-1h",
"to": "now"
},
"timepicker": {
"refresh_intervals": [
"5s",
"10s",
"30s",
"1m",
"5m",
"15m",
"30m",
"1h",
"2h",
"1d"
]
},
"timezone": "",
"title": "Kafka Cluster monitoring template",
"uid": "PkULDneZkALL",
"variables": {
"list": []
},
"version": 27
}5,docker-compose.yml file
Integrate the deployment of influxdb, jmxtrans and Grafana, deploy with docker compose, create the KafkaMonitor directory, and create the influxdb directory, jmxtrans directory and docker compose in the KafkaMonitor directory YML file, jmxtrans Put the JSON file in the jmxtrans directory.
docker-compose. The YML file is as follows:
version: '2'
services:
  # JMXTrans service
  jmxtrans:
    image: jmxtrans/jmxtrans
    container_name: jmxtrans
    volumes:
      - ./jmxtrans:/var/lib/jmxtrans
  # InfluxDB service
  influxdb:
    image: influxdb
    container_name: influxdb
    volumes:
      - ./influxdb/conf:/etc/influxdb
      - ./influxdb/data:/var/lib/influxdb/data
      - ./influxdb/meta:/var/lib/influxdb/meta
      - ./influxdb/wal:/var/lib/influxdb/wal
    ports:
      - "8086:8086" # External exposure port, providing Grafana access
    restart: always
  # Grafana services
  grafana:
    image: grafana/grafana:6.5.0  #There may be a bug in the later version
    container_name: grafana
    ports:
      - "3000:3000"  # External exposure port to provide web access
Start monitoring framework service:
docker-compose -f docker-compose.yml up -d
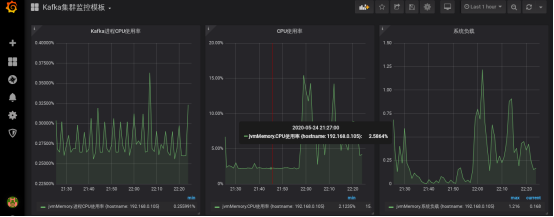
You need to log in to the Grafana service from the Web and configure the corresponding data source and template.
6. Monitor view