Thank you guys: https://www.cnblogs.com/huolongluo/p/5988644.html
Because the project needs to make a broken line map, according to the date to show the corresponding results, so this article.
XCL-chart is too laggy, but it's just for fixed charts and slides, because you know how to slide the cards too. (after all, the author hasn't updated and optimized for a long time) I'm kidding, I've been adding your group for half a year.
Secondly, we study the chart framework of achartenginee. One is not beautiful. The customizability of achartenginee is not very complimentary. The charts produced can not meet the demand at all.
Try again the best MPchart and hellochart for networking in the same year, but earlier than hellochaet. To be honest, it's also usable. It's customizable and easy to use simple tables.
BUT performance is general, we all know when using View, not fluent or have a sense of Carton, I just want to... smash things! (You know, I can't tolerate less than 60 fps.) But hellochart can give me more than 95 points for zooming and sliding while keeping its beauty. Especially when dealing with the smooth change of coordinate axes, I feel Hellochart can't be a cow anymore. Let me boast again. After all, it's in my heart.~~
Summary: If you need a lot of functionality, combinations, or displays, and you don't have much requirements for the interface, choose MPchart.
hellochart is strongly recommended if what you need is to be able to meet the basic charting functions, as well as aesthetics and fluency.
HelloCharts now supports the following chart types:
Line chart(cubic lines, filled lines, scattered points) (line chart)
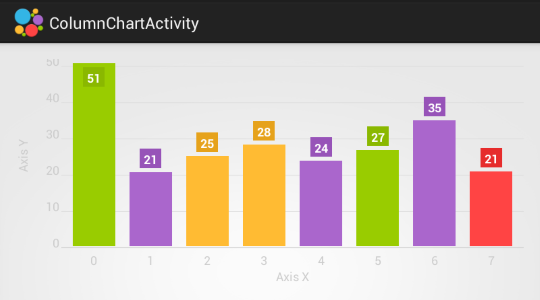
Column chart(grouped, stacked, negative values) (bar chart)
Pie chart
Bubble chart
Combo chart(columns/lines) (combination of histogram and line graph)
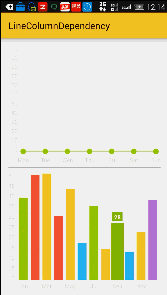
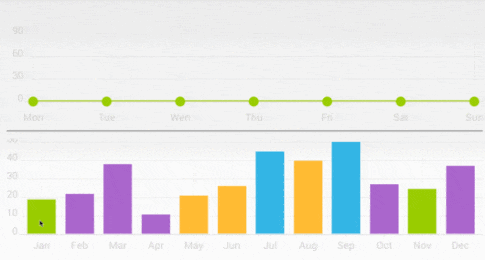
Preview charts (for column charts and line charts) (preview charts are the most powerful feature, but I'm not using them yet, see figure below)

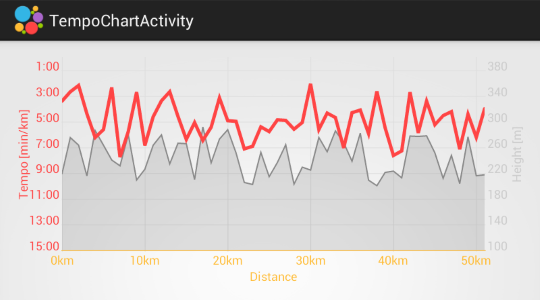
This effect and interface I can only say "God Axe Gong".
After the OK gossip, we should see how to use it.
First, libs adds:
hellocharts-library-1.5.8.jar (I prefer to use Baidu and other cloud disk storage, so I am saved in the cloud disk);
In addition, the download address is given: http://download.csdn.net/detail/u012534831/9531494
Next, add the layout to the XML.
<lecho.lib.hellocharts.view.LineChartView
           android:id="@+id/line_chart"
            android:layout_width="fill_parent"
           android:layout_height="300dp"/>
Then one is the abscissa and the other is the array of data points.
private LineChartView lineChart;

    String[] date = {"10-22","11-22","12-22","1-22","6-22","5-23","5-22","6-22","5-23","5-22"};//Marking of X-axis
    int[] score= {50,42,90,33,10,74,22,18,79,20};//Data Points of Charts
    private List<PointValue> mPointValues = new ArrayList<PointValue>();
    private List<AxisValue> mAxisXValues = new ArrayList<AxisValue>();
There are three methods in oncreate:
protected void onCreate(Bundle savedInstanceState) {
        super.onCreate(savedInstanceState);
        setContentView(R.layout.activity_main);
        lineChart = (LineChartView)findViewById(R.id.line_chart);
        getAxisXLables();//Get the label of the x-axis
        getAxisPoints();//Getting coordinate points
        initLineChart();//Initialization
    }
/**
     * Set up X-axis display
     */
    private void getAxisXLables() {
        for (int i = 0; i < date.length; i++) {
            mAxisXValues.add(new AxisValue(i).setLabel(date[i]));
        }
    }

    /**
     * Display of each point in the chart
     */
    private void getAxisPoints() {
        for (int i = 0; i < score.length; i++) {
            mPointValues.add(new PointValue(i, score[i]));
        }
    }
private void initLineChart() {
        Line line = new Line(mPointValues).setColor(Color.parseColor("#FFCD41"));  //The color of the broken line (orange)
        List<Line> lines = new ArrayList<Line>();
        line.setShape(ValueShape.CIRCLE);//The shape of each data point on a broken line chart is circular here (there are three kinds: ValueShape. SQUARE ValueShape. CIRCLE ValueShape. DIAMOND)
        line.setCubic(false);//Whether the curve is smooth, that is, whether it is a curve or a broken line
        line.setFilled(false);//Whether or not to fill the area of the curve
        line.setHasLabels(true);//Whether to add notes to the data coordinates of curves
//      Line. setHasLabels OnlyForSelected (true); // Click on the data coordinates to prompt the data (set this line.setHasLabels(true); invalid)
        line.setHasLines(true);//Whether to display with line or not. If it is false, there is no curve but point display
        line.setHasPoints(true);//Whether to display a dot if it is false, there is no origin but only a dot (each data point is a large dot)
        lines.add(line);
        LineChartData data = new LineChartData();
        data.setLines(lines);

        //Axis of coordinates
        Axis axisX = new Axis(); //X axis
        axisX.setHasTiltedLabels(true);  //Is the font on the X axis oblique or straight, and true oblique?
        axisX.setTextColor(Color.GRAY);  //Setting font color
        //axisX.setName("date"); // table name
        axisX.setTextSize(10);//Set font size
        axisX.setMaxLabelChars(8); //Up to a few X-axis coordinates, which means that your scaling allows the number of data on the X-axis to be 7<=x<=mAxisXValues.length.
        axisX.setValues(mAxisXValues);  //Fill in the coordinate name of the X-axis
        data.setAxisXBottom(axisX); //The x-axis is at the bottom.
        //Data. setAxisXTop (axisX); //x axis at top
        axisX.setHasLines(true); //x-axis dividing line

        // The Y-axis automatically sets the Y-axis limit according to the size of the data (below I will give a solution for fixing the number of Y-axis data)
        Axis axisY = new Axis();  //Y axis
        axisY.setName("");//y axis annotation
        axisY.setTextSize(10);//Set font size
        data.setAxisYLeft(axisY);  //The Y-axis is set on the left
        //Data. setAxisYRight (axisY); the // Y axis is set to the right


        //Setting behavioral properties to support zooming, sliding, and Translation
        lineChart.setInteractive(true);
        lineChart.setZoomType(ZoomType.HORIZONTAL);
        lineChart.setMaxZoom((float) 2);//Maximum method ratio
        lineChart.setContainerScrollEnabled(true, ContainerScrollType.HORIZONTAL);
        lineChart.setLineChartData(data);
        lineChart.setVisibility(View.VISIBLE);
        /**Note: The following 7, 10 just represent a number to analogize.
         * At that time, it was to solve the fixed number of X-axis data. See (http://forum.xda-developers.com/tools/programming/library-hellocharts-charting-library-t2904456/page2);
         */
        Viewport v = new Viewport(lineChart.getMaximumViewport());
        v.left = 0;
        v.right = 7;
        lineChart.setCurrentViewport(v);
    }
See the following picture: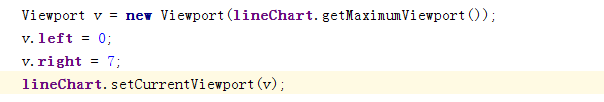
These four codes can set the number of X-axis data display (x-axis 0-7 data).
1 When the number of data points is less than (29), shrink to the extreme hellochart by default is all display.
When the number of data points is greater than (29).
2.1 If the sentence axisX.setMaxLabelChars(int count) is not set, the number of data that the X-axis can display will be automatically adapted to the most appropriate number.
2.2 If you set axisX. setMax LabelChars (int count), 33 data points will be tested.
2.2.1 If axisX.setMax LabelChars (10); the inside 10 is greater than v.right= 7; the inside 7, the X-axis displays seven data at the beginning, and then the number of X-axis is guaranteed to be greater than 7 and less than 10 when zooming in.
2.2.2 If it is less than v.right= 7; 7 in the middle, anyway, I feel that these two sentences seem to be invalid - - if v.right= 7 is not set here, then the chart will display all the data as far as possible at the beginning, and the interaction is too poor.
Let's look at a solution for fixing the number of Y-axes:
Example: Want to fix Y-axis data from 0-100
Axis axisY = new Axis().setHasLines(true);
axisY.setMaxLabelChars(6);//max label length, for example 60
List<AxisValue> values = new ArrayList<>();
for(int i = 0; i < 100; i+= 10){
    AxisValue value = new AxisValue(i);
    String label = "";
    value.setLabel(label);
    values.add(value);
}
axisY.setValues(values);
Obviously, as long as you divide the data proportionally.
Okay, that's basically it.
Source GitHub address: https://github.com/qht1003077897/hellocharts-line.git
CSDN download address: http://download.csdn.net/detail/u012534831/9531702
Supplement: Common charts