Recently, we encountered a very difficult problem. The monitoring system DPA found that a custom scalar function was invoked very frequently, which was beyond the scope of spectrum. Then when Troubleshooting is a problem, I do encounter some problems that make me very confused. Here is a little thought and try to solve the problem. If you have better ideas and solutions, please give me more advice.
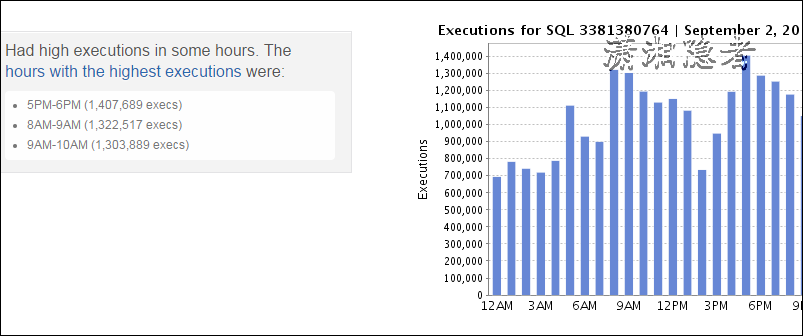
DPA can monitor the number of times the function is called per hour, as shown in the following screenshot:
So the first question comes. How does DPA monitor how many times an hour it takes this function to execute? In fact, this is very simple. In the sys.dm_exec_query_stats view, there is a field execution_count that counts the number of executions of SQL, but it records the number of executions planned since the last compilation. Then, the difference between the execution_count of the two results I execute on the dot is the number of executions in an hour.
execution_count Number of times that plan has been executed since it was last compiled. )
We can try this out, as shown below, in AdventureWorks 2014, we create a custom scalar function, and then we
USE AdventureWorks2014;GOCREATE FUNCTION Sales.FetchProductOrderNum(@ProuctID INT) RETURNS INTBEGINDECLARE @SaleOrderNum INT;SELECT @SaleOrderNum=COUNT(SalesOrderID) FROM Sales.SalesOrderDetailWHERE ProductID=@ProuctIDGROUP BY ProductID;RETURN @SaleOrderNum;ENDGODBCC FREEPROCCACHE; --Delete all elements in the plan cacheGODECLARE @ProductID INT;SET @ProductID=870SELECT DISTINCT ProductID, Sales.FetchProductOrderNum(ProductID) FROM Sales.SalesOrderDetailWHERE ProductID=@ProductID
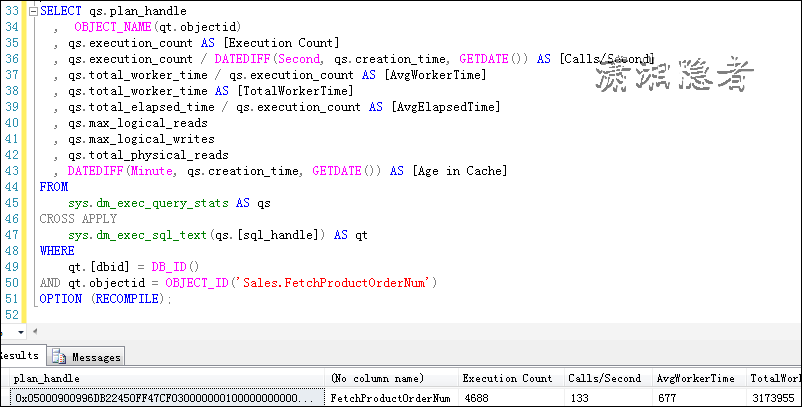
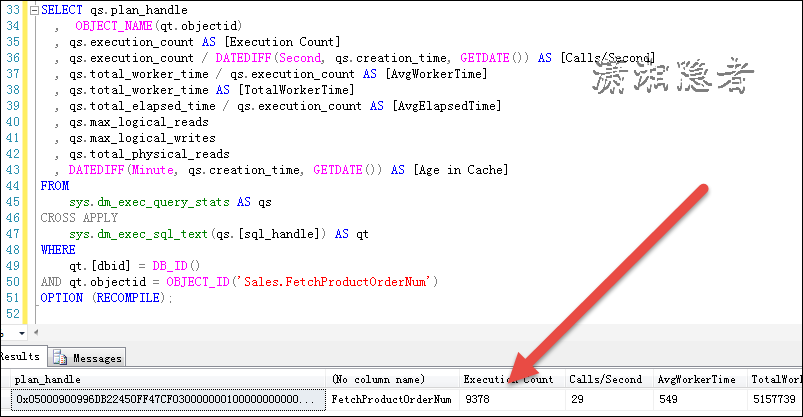
SELECT qs.plan_handle, OBJECT_NAME(qt.objectid), qs.execution_count AS [Execution Count], qs.execution_count / DATEDIFF(Second, qs.creation_time, GETDATE()) AS [Calls/Second], qs.total_worker_time / qs.execution_count AS [AvgWorkerTime], qs.total_worker_time AS [TotalWorkerTime], qs.total_elapsed_time / qs.execution_count AS [AvgElapsedTime], qs.max_logical_reads, qs.max_logical_writes, qs.total_physical_reads, DATEDIFF(Minute, qs.creation_time, GETDATE()) AS [Age in Cache]FROMsys.dm_exec_query_stats AS qsCROSS APPLYsys.dm_exec_sql_text(qs.[sql_handle]) AS qtWHEREqt.[dbid] = DB_ID()AND qt.objectid = OBJECT_ID('Sales.FetchProductOrderNum')OPTION (RECOMPILE);
DECLARE @ProductID INT;
SET @ProductID=897
SELECT DISTINCT ProductID, Sales.FetchProductOrderNum(ProductID) FROM Sales.SalesOrderDetail
WHERE ProductID=@ProductID
DECLARE @ProductID INT;
SET @ProductID=870
SELECT DISTINCT ProductID, Sales.FetchProductOrderNum(ProductID) FROM Sales.SalesOrderDetail
WHERE ProductID=@ProductID
As shown above, assuming that only the above two SQL s are executed in an hour, I know that this custom function has been called 9378 - 4688 = 4690 times. So based on this rule, we can find out the number of calls to custom functions in an hour, and other database objects can also be calculated in this way.
Then the next question is how many scripts in a database call this custom scalar function, but how can I distinguish and distinguish that SQL script calls the custom function most (or can find out TOP 10 SQL statement). This problem has been entangled for a long time, looking up a lot of information, and can not achieve this function.
Why is there such a demand? Because I can't locate the most number of SQL calls. I can't locate the root cause of the problem. In the case I encountered, I found that there are nearly 200 places to call this custom function. If we judge and analyze one by one, this is a exhausting manual work, and some SQL is very uncertain.
How many times will this function be called (for example, some on temporary tables, some on incoming variables, and so on).
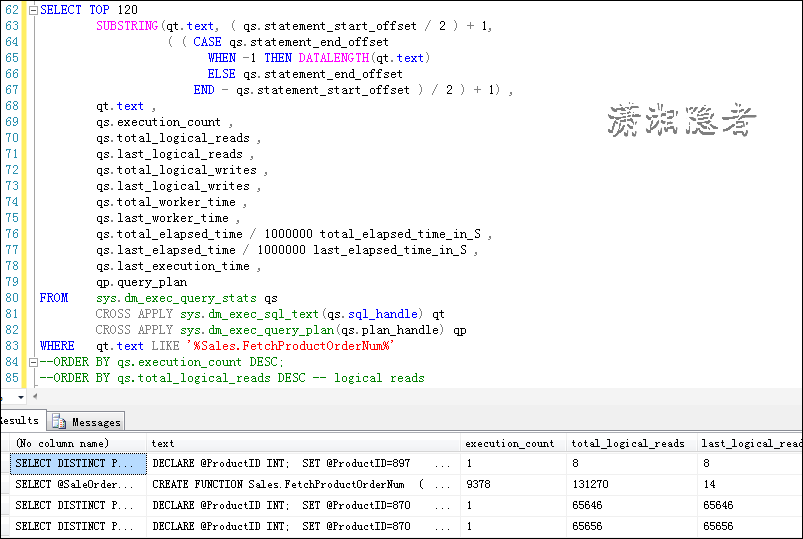
SELECT TOP 120SUBSTRING(qt.text, ( qs.statement_start_offset / 2 ) + 1,( ( CASE qs.statement_end_offsetWHEN -1 THEN DATALENGTH(qt.text)ELSE qs.statement_end_offsetEND - qs.statement_start_offset ) / 2 ) + 1) ,qt.text ,qs.execution_count ,qs.total_logical_reads ,qs.last_logical_reads ,qs.total_logical_writes ,qs.last_logical_writes ,qs.total_worker_time ,qs.last_worker_time ,qs.total_elapsed_time / 1000000 total_elapsed_time_in_S ,qs.last_elapsed_time / 1000000 last_elapsed_time_in_S ,qs.last_execution_time ,qp.query_planFROM sys.dm_exec_query_stats qsCROSS APPLY sys.dm_exec_sql_text(qs.sql_handle) qtCROSS APPLY sys.dm_exec_query_plan(qs.plan_handle) qpWHERE qt.text LIKE '%FunctionName%'ORDER BY qs.execution_count DESC;
If you use such a SQL statement, you can't find the SQL that calls custom functions the most times (the characteristics of custom scalar functions, not clear can see my blog Performance issues of scalar user defined function in SQL SERVER No details are given here. Later I found that if that SQL calls too many custom scalar functions, its logical reading is very high. Of course, this is not very precise, but also need to be screened within a certain range, but in this range of brush selection, has been very rare, in my case, I very quickly judged several SQL, screening, quickly found the number of calls to a lot of SQL. This is the best way I can find. If there are other better ways, please give me some advice.
SELECT TOP 120SUBSTRING(qt.text, ( qs.statement_start_offset / 2 ) + 1,( ( CASE qs.statement_end_offsetWHEN -1 THEN DATALENGTH(qt.text)ELSE qs.statement_end_offsetEND - qs.statement_start_offset ) / 2 ) + 1) ,qt.text ,qs.execution_count ,qs.total_logical_reads ,qs.last_logical_reads ,qs.total_logical_writes ,qs.last_logical_writes ,qs.total_worker_time ,qs.last_worker_time ,qs.total_elapsed_time / 1000000 total_elapsed_time_in_S ,qs.last_elapsed_time / 1000000 last_elapsed_time_in_S ,qs.last_execution_time ,qp.query_planFROM sys.dm_exec_query_stats qsCROSS APPLY sys.dm_exec_sql_text(qs.sql_handle) qtCROSS APPLY sys.dm_exec_query_plan(qs.plan_handle) qpWHERE qt.text LIKE '%FunctionName%'--ORDER BY qs.execution_count DESC;ORDER BY qs.total_logical_reads DESC--ORDER BY qs.last_logical_reads Sometimes press last_logical_reads skillful
Let's validate the case we tested above. As shown below, you can see that Sales.FetchProductOrderNum is the most frequently called custom scalar function. So if you count it by execution_count, it's totally impossible. For example, one of the SQL executions (Product ID = 870), Sales.FetchProductOrderNum scalar function will be called well. Thousands of times, and according to logical reads (total_logical_reads or last_logical_reads) to analyze, basically can be located to call scalar function number of times the most SQL. Of course, the actual environment is much more complex than this test case.


