An example of MongoDB slow query
01 problem background
I encountered a MongoDB problem online today. Here is a record.
Scenario:
1. The number of connections of a service for monitoring and alarm is very high. The details are as follows:
+-------------+---------+---+-------+-----------+-----------+--------+---------+
|HOST         |STATE    |LAG|VERSION|NODE_CONF  |CONNECTIONS|MEM_USED|DISK_USED|
+-------------+---------+---+-------+-----------+-----------+--------+---------+
|             |         |   |       |           |           |        |         |
|10.xx.xxx.xxx|PRIMARY  |0  |4.0.4  |P:1;D:0;H:0|1217/10000 |9.3GB   |54G      |
|10.xx.xxx.xxx|SECONDARY|0  |4.0.4  |P:1;D:0;H:0|53/10000   |9.3GB   |53G      |
|10.xx.xxx.xxx|SECONDARY|2  |4.0.4  |P:1;D:0;H:0|50/10000   |10.3GB  |54G      |
+-------------+---------+---+-------+-----------+-----------+--------+---------+
You can see that the number of connections of the Primary node is 1217, and the maximum number of connections is 10000
2. According to the business feedback, the writing of a node is very slow. Timeout serious.
02 troubleshooting process
1. Server level
Generally, the first problem to be checked is the server level problem. After the server level problem is eliminated, go to the database level problem.
Log in to the server where the MongoDB main database is located and check the server level monitoring. The following phenomena can be found:
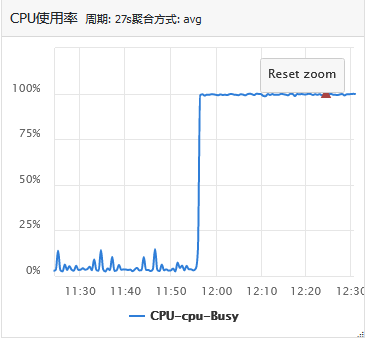
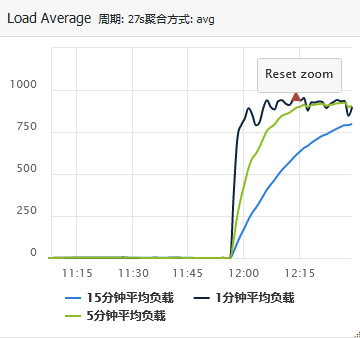
You can see that the CPU utilization of the server is abnormal, rising from less than 10% to 100%; At the same time, the server load is abnormal, rising from 1 to more than 900.
Here, the basic location of the problem is the problem of this server, which leads to the longer response time of the business. Then, due to the delay of the program, the reconnection is initiated, and the number of connections naturally increases.
2. Database level
Then, let's see which process on this server uses the most CPU.
Use the top -c command to view the current process and find that MongoDB currently occupies the most CPU.
Now, the problem turns to troubleshooting the ongoing operation of MongoDB to see what causes the high CPU consumption.
Let's take a look at the status of this MongoDB instance:
mongostat

insert query update delete getmore command dirty  used flushes vsize   res   qrw   arw net_in net_out conn           set repl                time
    *0    65     42     *0       8   316|0  4.4% 80.0%       0 14.7G 9.32G 0|808 2|128   518k    890k 1192 index  PRI Dec 20 14:31:41.276
    *0    26     15     *0       4   122|0  4.5% 80.0%       0 14.7G 9.32G 0|806 1|128   154k    268k 1208 index  PRI Dec 20 14:31:45.328
    *0    40     21     *0       7   159|0  4.5% 80.0%       0 14.7G 9.32G 0|790 1|128   228k    359k 1222 index  PRI Dec 20 14:31:47.988
    *0   134    132     *0      16   646|0  4.6% 80.0%       0 14.7G 9.32G 0|803 2|128   987k   1.32m 1213 index  PRI Dec 20 14:31:49.494
    *0    36     66     *0       4   150|0  4.7% 79.9%       0 14.7G 9.32G 0|814 3|127   218k    389k 1203 index  PRI Dec 20 14:31:54.656
    *0    46     90     *0       7   289|0  4.8% 80.0%       0 14.7G 9.32G 0|764 2|128   230k    336k 1239 index  PRI Dec 20 14:31:57.625
    *0    90    179     *0       8   379|0  4.8% 80.0%       0 14.8G 9.32G 0|791 2|127   490k    779k 1271 index  PRI Dec 20 14:31:59.123
It is found that there is no insert operation, and most of them are update operations.
Then, according to the update operation, check the MongoDB log, and you can see many update slow logs:
tail -f mongod.log | grep [0-9][0-9][0-9][0-9][0-9]ms
The results are as follows:
2021-12-20T14:34:10.052+0800 I WRITE    [conn1573045] update db.tbl
command: { q: { unique_id: "community:9394+315186" }, u: { unique_id: "community:9394+315186", object_id: "9394+315186",
from: "community", tags: [], tag_scores: [], quality_score: 0.001, online: "1",
update_time: new Date(1639981985000), create_time: new Date(1639981323000) },
 multi: false, upsert: true }
planSummary: COLLSCAN keysExamined:0 docsExamined:574333 nMatched:0 nModified:0 fastmodinsert:1
 upsert:1 keysInserted:3 numYields:4510 locks:{ Global: { acquireCount: { r: 4512, w: 4512 } },
Database: { acquireCount: { w: 4512 } }, Collection: { acquireCount: { w: 4512 } } }
32618 ms

2021-12-20T14:34:10.160+0800 I WRITE    [conn1573082] update db.tbl
command: { q: { unique_id: "community:9394+315187" },
u: { unique_id: "community:9394+315187", object_id: "9394+315187",
from: "community", tags: [], tag_scores: [], quality_score: 0.001, online: "1",
update_time: new Date(1639981986000), create_time: new Date(1639981377000) },
multi: false, upsert: true }
planSummary: COLLSCAN keysExamined:0 docsExamined:574379 nMatched:0 nModified:0 fastmodinsert:1
 upsert:1 keysInserted:3 numYields:4505 locks:{ Global: { acquireCount: { r: 4507, w: 4507 } },
Database: { acquireCount: { w: 4507 } }, Collection: { acquireCount: { w: 4507 } } }
30591 ms
It can be seen that many slow logs of MongoDB take more than 30s. The scanning method is full table scanning, and the number of rows scanned is about 57w.
Meanwhile, the update condition is unique_id=“community:9394+315187”
At this point, the problem can be located.
Unique in this collection_ The ID field has no index, but it is updated according to this field, so that all update matches will scan the whole table. The business side only launched a large number of update statements today, so it suddenly timed out.
03 solution
In fact, the solution to this problem is relatively simple, that is, add an index to the corresponding database set:
db.coll.createIndex({ "unique_id": 1 },{background:true});
Note that the background addition is used here in order not to block the business access of the foreground.
After the index is added, the business feedback response timeout problem is solved. Check the relevant monitoring. The monitoring is shown as follows:
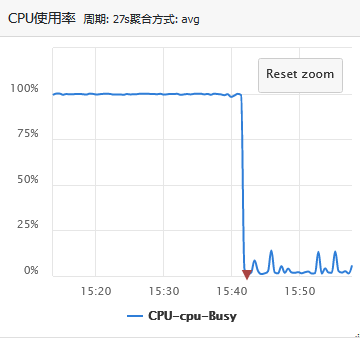
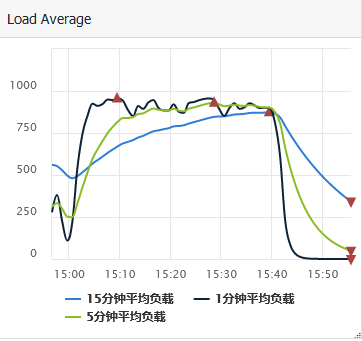
It can be seen that the CPU utilization has decreased from 100% to less than 10%, and the load has decreased from more than 800 to about 1.
Let's look at the number of connections:
+-------------+---------+---+-------+-----------+-----------+--------+---------+
|HOST         |STATE    |LAG|VERSION|NODE_CONF  |CONNECTIONS|MEM_USED|DISK_USED|
+-------------+---------+---+-------+-----------+-----------+--------+---------+
|             |         |   |       |           |           |        |         |
|10.xx.xxx.xxx|PRIMARY  |0  |4.0.4  |P:1;D:0;H:0|86/10000   |9.5GB   |54G      |
|10.xx.xxx.xxx|SECONDARY|0  |4.0.4  |P:1;D:0;H:0|58/10000   |9.5GB   |54G      |
|10.xx.xxx.xxx|SECONDARY|0  |4.0.4  |P:1;D:0;H:0|51/10000   |10.4GB  |54G      |
+-------------+---------+---+-------+-----------+-----------+--------+---------+
The number of connections also changed from 1217 to 86, returning to normal.
So far, the problem has been solved.
04 summary
The problem itself is relatively simple and the handling method is relatively simple. However, the process of troubleshooting and locating the problem is worth summarizing. In fact, this method can be used for troubleshooting any database problem, whether MySQL, MongoDB, Redis, MC or TiDB. Let's try to summarize:
1. Find out the background of the problem and the business phenomenon at this time;
2. Find out the architecture of the current problem database and confirm whether it is the master database problem or the slave database problem. If it is a distributed cluster, locate the node first;
3. Check the server where the current database is located, such as CPU, memory, disk, network card traffic, load, etc
4. If there is no problem with the server, further locate the database status on the server and first determine the current operation of the database. Here, you can use the monitoring information or some commands of the database itself.
5. Locate the specific database operation, contact the business party for solution, and usually give optimization suggestions.
In this problem, only a small index is not created, which will cause the CPU load to soar more than 800 times. In fact, it is very scary. When the amount of data is small, whether to add an index or not is not a big problem, but when the amount of data is large and access is frequent, no index will lead to disaster.
For the online environment, we can't let go of any hidden danger, more than.