Log is a very important means for developers to troubleshoot problems, sometimes even the only one. Therefore, how to print log reasonably and correctly has become the top priority in development.
Node. There are several ways to print logs in JS:
- 1. Active display
- 2. Passive recording
These two methods can be implemented by different modules. Let's see how to choose next.
Common active displays
Generally speaking, the initiative usually occurs during the development period. When the state is uncertain, we will print some messages, such as common ones.
console.log('hello world');This is the simplest example of active printing.
However, in most scenarios, we will not use console for printing. After all, there are no special advantages in performance and functions except built-in.
In addition to the console module known to the public, in node There is also a well-known debug module in the JS field.
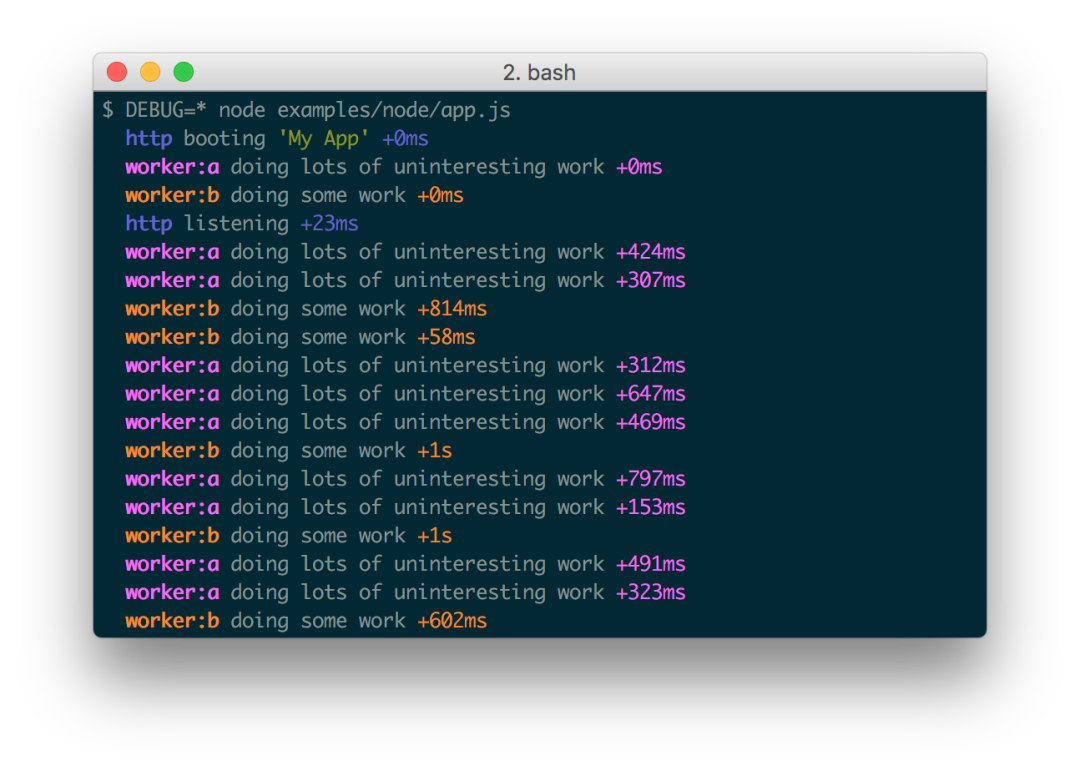
You can print output in different colors according to the namespace, but the most useful is its ability to control environment variables.
By default (excluding any environment variables), the console will not have any output. When the {DEBUG} environment variable is assigned, the output of the corresponding namespace will be printed to stdout.
$ DEBUG=* node app.js
Because the debug module is produced by TJ and put into use very early, it is still widely used by many modules.
Node.js officials have always wanted to have a built-in debug module. From v0 11.3 start, and finally add a util Debuglog method.
Its function is similar to the debug module, and it is also a built-in module, so some modules gradually begin to transition to it.
const util = require('util');const debuglog = util.debuglog('foo'); debuglog('hello from foo [%d]', 123);Its switch is similar, using {NODE_DEBUG , environment variable should be deliberately distinguished from the debug module.
$ NODE_DEBUG=foo node app.js
Passive recording mode
In addition to the console like methods mentioned above, we often use the logs recorded by default in various log libraries. Because these logs are usually recorded silently and do not pay too much attention, they are only checked when there are special needs (such as errors, positioning and calculation), so we classify them as "passive methods".
Most third-party libraries have similar functions, such as log4j, winston, pino and so on.
The core functions of these libraries are generally:
- 1. Output logs to different channels (such as console, text file)
- 2. Customization of log format (text or JSON)
- 3. Log output level (warn, debug, error)
- 4. Other capabilities, such as cutting and file rotation, compression and so on
These libraries are generally simple to use. You can get an instance and call the method output.
logger.info('hello world');Note that here we will observe some differences in the output.
2021-07-22 14:50:59,388 INFO 7739 [xxx] hello world
The whole log is output by installing the above standard structure, and the calculation is Error, which is also in the same similar format. What parts does this structure contain?
Log format
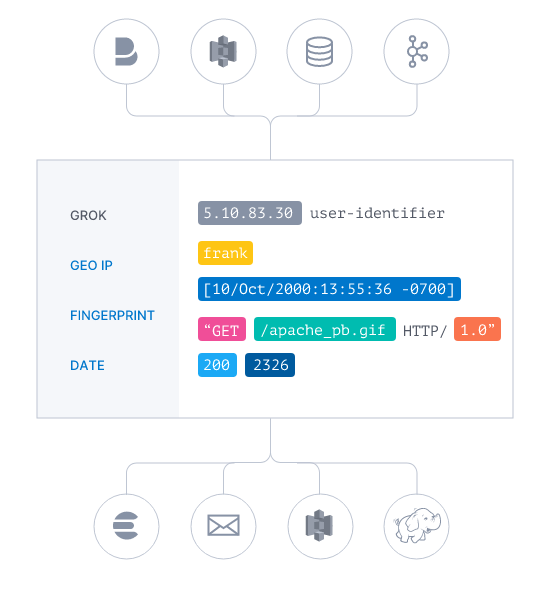
In fact, the whole log format can be traced back to a long time ago. Whether it is the default Simple Logger structure of JAVA or the logs of reverse proxy servers such as nginx, it will contain some fixed fields. These fixed fields have formed an output Convention for a long time. These fields are combined to form today's log format.
The current log format generally includes several parts.
- time stamp
- Log level
- Process id (node)
- label, from xxx class
- Message body (string or error stack)
In addition, there may be some customized content, such as execution time, user id, text length and so on.
In the output of the text structure, these fields will be separated by space s and end with newline characters (\ n), which is convenient for external log collection systems, such as Alibaba cloud SLS, etc.
Each company has its own log collection and output specifications, so common libraries generally support custom log formats, but no matter how they change, the basic fields (above) will still exist.
With the iteration of the system, the advanced method of using JSON format to record logs has gradually emerged, Front end training Some data (log) collection and analysis tools led by Logstash have gradually matured and support structured data well. Therefore, common libraries now support JSON format output synchronously.
Correct log
After understanding the basic log database and system, let's take a specific look at the real problem of logging.
For example, a simple call to a remote service:
async invokeRemoteAPI() { const result = await remoteService.got(); return { result };}Generally, we will consciously add error handling.
async invokeRemoteAPI() { try { const result = await remoteService.got(); } catch(err) { logger.error('got a error, err=', err); throw err; } return { result };}According to the above standard format, this logger also needs some additional information, such as:
async invokeRemoteAPI() { const pid = process.pid; const startTime = Date.now(); try { const result = await remoteService.got(); } catch(err) { const endTime = Date.now(); logger.error('pid=%s, rt=%s, got a error, err=', pid, Date.now() - startTime, err); throw err; } return { result };}If each code is written in this way, it will become extremely redundant. Therefore, we will define the output format of the log in advance, so that it can be simplified in the actual output, such as:
const logger = new CustomLogger({  format: '${timestamp} ${level} ' + process.pid + ${rt}'});
async invokeRemoteAPI() {  const startTime = Date.now();    try {    const result = await remoteService.got();  } catch(err) {    const endTime = Date.now();    logger.error('got a error, err=', err, {      rt: Date.now() - startTime    });    throw err;  }    return {    result  };}
Therefore, in a specific scenario, if there are fixed log fields, the fixed log format can be defined first when the log library allows customization.
Context log
In addition to the simplest general log output, there is also a relatively complex log, which we call the log bound to the context (request). This kind of log will output the data associated with the context, such as the response time in the previous example, the ip of the user's request, the route of the request, and even the unique ID of the link.
For example:
2021-07-22 14:50:59,388 INFO 7739 [-/127.0.0.1/-/0ms GET /] hello world
In this case, it is not appropriate to add parameters in the form of ordinary logs.
Of course, some students will say that we directly define a new one, such as:
class CustomCtxLogger extends CustomLogger { constructor(ctx, format) { this.ctx = ctx; this.format = format; } error(...args) { //xxx } info(...args) { //xxx }}In this way, the base class will be initialized every time, which will affect some performance. We use another way to reduce the performance impact of proxy traditional logging.
Let's take a look at the simplest implementation, taking koa as an example.
// Common log const logger = new CustomLogger();
class CtxLogger {  constructor(ctx, logger) {    this.ctx = ctx;    this.logger = logger;  }    format() {    return '${timestamp} ${level} ' + process.pid + '[${ctx.refer} ${ctx.rt}]'  }}
app.use(async (ctx, next) => {  // Agent original log const ctxlogger = new ctxlogger (CTX, logger); ctx. logger = ctxLogger;     await next();});
Similar to this method of proxy original log, it not only reduces the performance problem when initializing a new log each time, but also solves the problem of field transparent transmission on ctx.
This is also a common practice of context logging.