Perhaps this is the last article in the series. You can read the previous chapters of this series through the following articles
1. g + + tools for compiling C + + code in Linux and common operation instructions of g + +
2. C + + command line compilation example under Linux
3. Common instructions of GDB debugger under Linux
4. C + + command line debugging practice under Linux
5. Compilation process of cmake project
1. General
VSCode is one of the most popular ides at present. In this section, we will introduce how to debug C + + programs in VSCode. Before starting, you need to download the latest version of the corresponding operating system through the VSCode official website and install it on your own computer.
This article will not cover the basic operations of VSCode, such as creating a project, installing plug-ins, setting up, etc. If you are not familiar with VSCode, it is recommended to understand the basic usage of VSCode first. But if you don't use CSCode before but use other development tools, VSCode will be easy for you to get started.
2. Prepare source code
Using Src / 08_ The demo directory is used as the source directory, and the files shown in the figure below are added
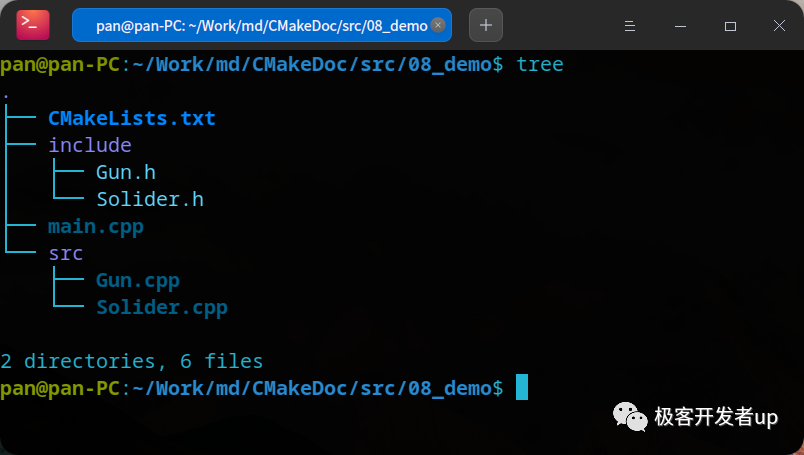
The program simulates a soldier loading bullets with a gun and shooting. The relevant source code content and cmake configuration file are as follows
2.1. include/Gun.h file
#pragma once
#include <string>

class Gun
{
private:
    int _bullet_count;
    std::string _type;

public:
    Gun(std::string type)
    {
        this->_bullet_count = 0;
        this->_type = type;
    }

    void addBullet(int bullet_num);
    bool shoot();
};
2.2. include/Solider.h file
#pragma once
#include <string>
#include "Gun.h"

class Solider
{
private:
    std::string _name;
    Gun *_ptr_gun;

public:
    Solider(std::string name);
    ~Solider();
    void addGun(Gun *ptr_gun);
    void addBullectToGun(int num);
    bool fire();
};
2.3. src/Gun.cpp file
#include "Gun.h"
#include "iostream"
using namespace std;

void Gun::addBullet(int bullet_num)
{
    this->_bullet_count += bullet_num;
}

bool Gun::shoot()
{
    if (this->_bullet_count <= 0)
    {
        cout << "There is no bullet!" << endl;
        return false;
    }

    this->_bullet_count -= 1;
    cout << "shoot success" << endl;
    return true;
}
2.4. src/Solider.cpp file
#include "Solider.h"

Solider::Solider(std::string name)
{
    this->_name = name;
    this->_ptr_gun = nullptr;
}

void Solider::addGun(Gun *ptr_gun)
{
    this->_ptr_gun = ptr_gun;
}

void Solider::addBullectToGun(int num)
{
    this->_ptr_gun->addBullet(num);
}

bool Solider::fire()
{
    return this->_ptr_gun->shoot();
}

Solider::~Solider()
{
    if (this->_ptr_gun == nullptr)
    {
        return;
    }
    delete this->_ptr_gun;
    this->_ptr_gun = nullptr;
}
2.5. main.cpp file
#include "Gun.h"
#include "Solider.h"

void test()
{
    Solider sanduo("xusanduo");
    sanduo.addGun(new Gun("AK47"));
    sanduo.addBullectToGun(20);
    sanduo.fire();
}

int main(int argc, char const *argv[])
{
    test();
    return 0;
}
2.6. CMakeLists.txt file
# Specify cmake version
cmake_minimum_required(VERSION 3.0)
# Set project name
project(SOLIDERFIRE)
# Add compilation parameters
set(CMAKE_CXX_FLAGS "${CMAKE_CXX_FLAGS} -g -O2 -Wall")
# Set the code build level to Debug mode
set(CMAKE_BUILD_TYPE Debug)
# Include directory
include_directories(${CMAKE_SOURCE_DIR}/include)
# compile
add_executable(a.out main.cpp src/Gun.cpp src/Solider.cpp)
3. Install VSCode plug-in
3.1. C/C + + plug-in
The plug-in supports prompt of C/C + + code, C + + program debugging and reading of C + + source code. It is the official plug-in of VSCode
Plug in address: https://marketplace.visualstudio.com/items?itemName=ms-vscode.cpptools
3.2. CMake plug-in
The plug-in supports highlighted code and syntax prompt of CMake configuration file
Plug in address: https://marketplace.visualstudio.com/items?itemName=twxs.cmake
3.3. CMake Tools plug-in
This plug-in is also the official plug-in of VSCode and provides support for CMake tool related functions
Plug in address: https://marketplace.visualstudio.com/items?itemName=ms-vscode.cmake-tools
4. Configuration and commissioning
4.1. Create debug profile
After preparing the source code and installing the plug-in, we can open the debug menu bar of VSCode, as shown in the following figure
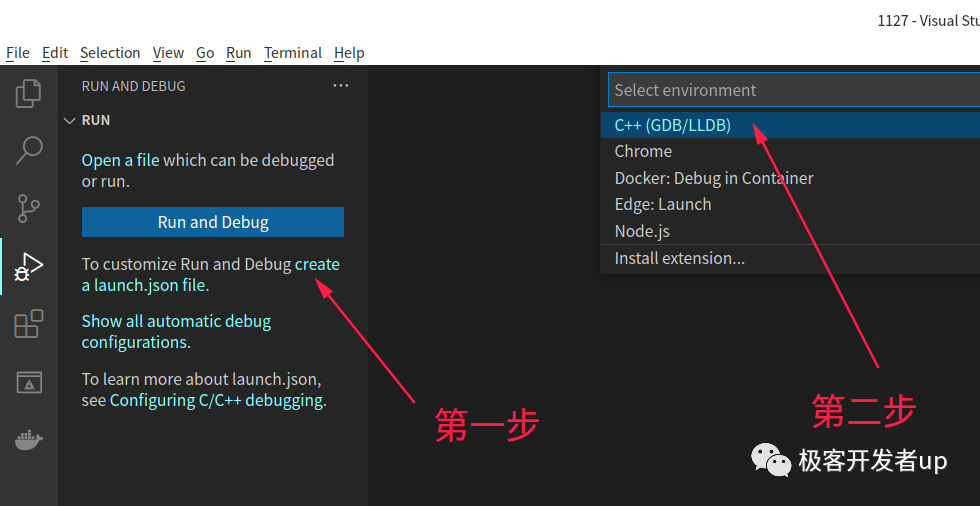
Click the menu in the figure to create the C + + debug configuration file of vscode Create a file named launch. In the vscode directory JSON configuration file. We will define debug related configurations based on this file. The default file contents are as follows
{
    // Use IntelliSense to learn about possible attributes.
    // Hover to view descriptions of existing attributes.
    // For more information, visit: https://go.microsoft.com/fwlink/?linkid=830387
    "version": "0.2.0",
    "configurations": [
        {
            "name": "(gdb) start-up",
            "type": "cppdbg",
            "request": "launch",
            "program": "Enter a program name, for example ${workspaceFolder}/a.out",
            "args": [],
            "stopAtEntry": false,
            "cwd": "${fileDirname}",
            "environment": [],
            "externalConsole": false,
            "MIMode": "gdb",
            "setupCommands": [
                {
                    "description": "by gdb Enable neat printing",
                    "text": "-enable-pretty-printing",
                    "ignoreFailures": true
                }
            ]
        }
    ]
}
4.2. Key parameters:
Program: the value of this configuration points to the binary program with debugging information. We finally put the compiled program in the build directory, so you can fill in ${workspaceFolder}/build/a.out here.
preLaunchTask: this parameter defines the execution task before the debugger starts. The default configuration file does not contain this parameter. We need to add it manually to automatically compile the changed C + + code.
4.3. Create task file
From the terminal - > configure default build task menu, select Create tasks The JSON file from template - > others option creates a task configuration file at vscode/tasks.json, the default configuration is as follows
{
    // See https://go.microsoft.com/fwlink/?LinkId=733558
    // for the documentation about the tasks.json format
    "version": "2.0.0",
    "tasks": [
        {
            "label": "echo",
            "type": "shell",
            "command": "echo Hello"
        }
    ]
}
We need to modify the task configuration file as follows
{
    // See https://go.microsoft.com/fwlink/?LinkId=733558
    // for the documentation about the tasks.json format
    "version": "2.0.0",
    "options": {
        "cwd": "${workspaceFolder}/build"
    },
    "tasks": [
        {
            "type": "shell",
            "label": "cmake",
            "command": "cmake",
            "args": [
                ".."
            ]
        },
        {
            "label": "make",
            "group": {
                "kind": "build",
                "isDefault": true
            },
            "command": "make",
            "args": []
        },
        {
            "label": "build",
            "dependsOrder": "sequence",
            "dependsOn": [
                "cmake",
                "make"
            ]
        }
    ],
}
In the above task configuration, we have defined three tasks. The first is to define the cmake precompile instruction, the second is to define the make compilation instruction, and then define the build task to include the two steps of precompile and compilation. Finally modify launch The JSON file is as follows
{
    // Use IntelliSense to learn about possible attributes.
    // Hover to view descriptions of existing attributes.
    // For more information, visit: https://go.microsoft.com/fwlink/?linkid=830387
    "version": "0.2.0",
    "configurations": [
        {
            "name": "(gdb) start-up",
            "type": "cppdbg",
            "request": "launch",
            "program": "${workspaceFolder}/build/a.out",
            "args": [],
            "stopAtEntry": false,
            "cwd": "${fileDirname}",
            "environment": [],
            "externalConsole": false,
            "MIMode": "gdb",
            "setupCommands": [
                {
                    "description": "by gdb Enable neat printing",
                    "text": "-enable-pretty-printing",
                    "ignoreFailures": true
                }
            ],
            "preLaunchTask": "build"
        }
    ]
}
At this time, the automatic debug of VSCode has been configured. Note that the path of the executable configured by the program should be the same as cmakelists Txt the binary executable output path defined in the configuration file is consistent. At the same time, the value of preLaunchTask configuration should be the same as taks The task ID configured in the JSON file is consistent.
5. Commissioning process
After we configured the automatic compilation in step 4, now we add the following line of code to the mian function executed by the program to verify the results
std::cout << "this is a test stating" << std::endl;
Because we use the C + + standard output function, we should also introduce iostream in the file header, as shown in the following code
#include "iostream"
At the same time, make a breakpoint on the next line of this line of code, and then press F5 on the keyboard. At this time, the debugging mode is automatically entered, as shown in the following figure
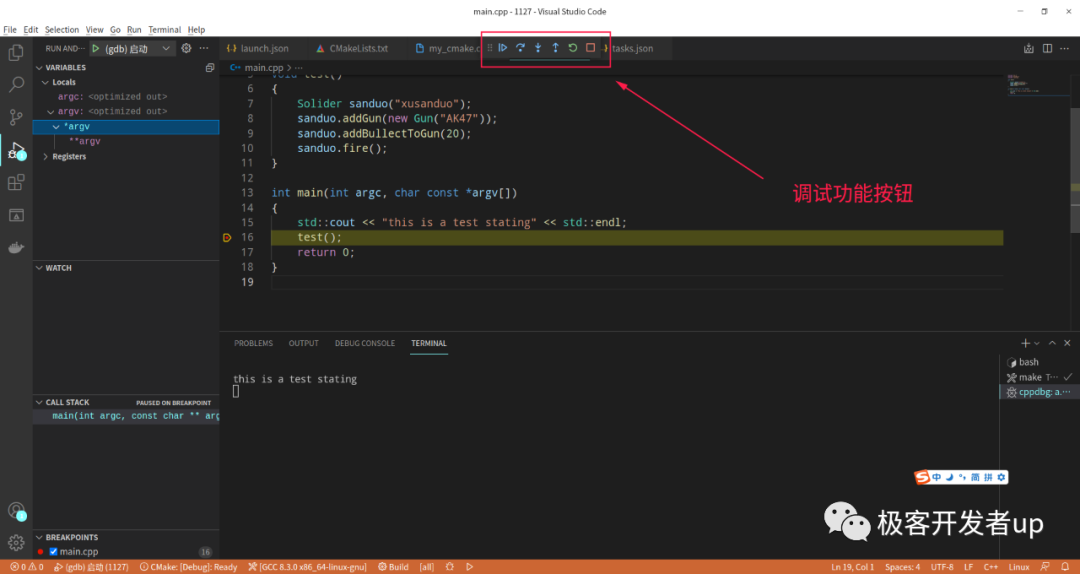
The debugging of VSCode includes the following function keys:
- Continue(F5): execution stops at the breakpoint
- Step Into(F11): enter the sub function and execute in one step
- Step Out(Shift + F11): crossing sub functions
- Step Over(F10): if a sub function has been entered, the sub function will be exceeded
- Restart(Ctrl + Shift + F5): restart debugging
- Sop(Shift + F5): stop debugging
6. Summary and thanks
Through a period of study, I have completed this series of articles, which are my own notes in the process of learning. The video of "station B", the following is the video link
https://www.bilibili.com/video/BV1fy4y1b7TC