How to make matplotlib display Chinese smoothly in Ubuntu 16.04
Recently, in order to help a friend deal with entrance examination data, we need to use matplotlib to draw, and the drawing legends need to be illustrated in Chinese. Therefore, we need to solve the problem that matplotlib can not display Chinese by default.
It should be emphasized that the environment tested in this article is Ubuntu 16.04.4 LTS, and the matplotlib library tested in this article is installed by conda command (how to use conda to manage python environment can refer to another blog of mine). Pure terminal commands start your Anaconda installation and Python environment management That is to say, the problem to be solved in this paper is: how to display Chinese correctly in matplotlib in conda-managed python environment under Ubuntu 16.04.
- The non-code resources used in this article are:
simhei font Baidu Cloud Link for Ubuntu 16.04
Extraction code: rxhd
1. Identify the matplotlib you are using
Use the following code in python to get the font settings file location of the matplotlib you are using
import matplotlib
matplotlib.matplotlib_fname()
The following is the value returned by my python:
'/home/lab-chen.yirong/anaconda2/envs/py36/lib/python3.6/site-packages/matplotlib/mpl-data/matplotlibrc'
Then, the font storage location is: / home / lab-chen. Yirong / anaconda2 / envs / py36 / lib / Python 3.6 / site-packages / Matplotlib / mpl-data / fonts / ttf
The font settings file to be modified is: / home/lab-chen.yirong/anaconda2/envs/py36/lib/python 3.6/site-packages/matplotlib/mpl-data/matplotlibrc.
2. Download simhei font for Ubuntu 16.04
simhei font Baidu Cloud Link for Ubuntu 16.04
Extraction code: rxhd
Move the font file to.../matplotlib/mpl-data/fonts/ttf. The following figure shows how I use Windows to send the file from Windows to the server: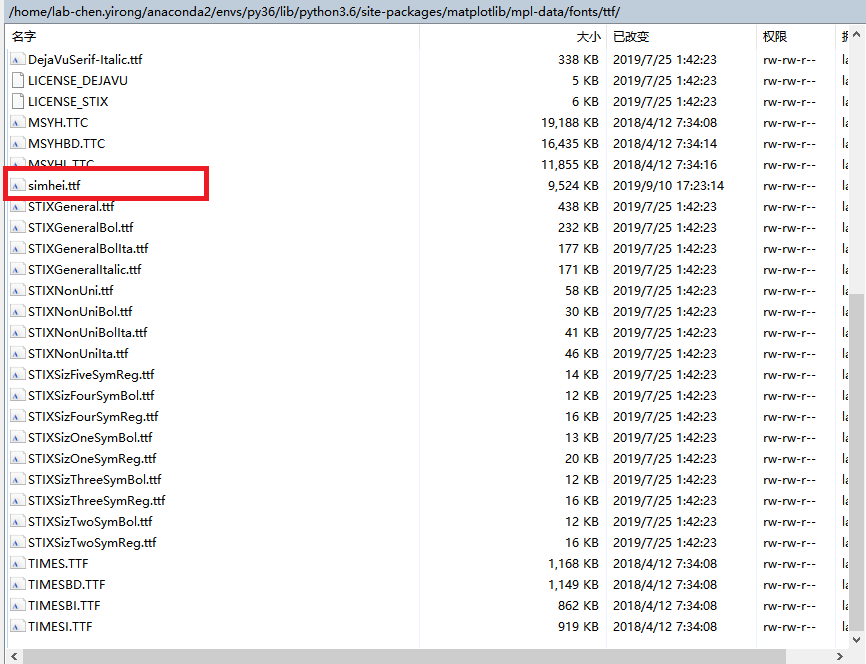
3. Modify the matplotlibrc file
When you open the matplotlibrc file file, you can see that each line uses # comment to remove the code, so we need to find the corresponding code and remove the comment, modify the code:
- In line 162 or so of the file, FONT appears, which reminds us that font settings will follow.
I put lines 198 to 213 below, and you can see that each line is gray (that is, it's commented out):
#font.family         : sans-serif
#font.style          : normal
#font.variant        : normal
#font.weight         : normal
#font.stretch        : normal
## note that font.size controls default text sizes.  To configure
## special text sizes tick labels, axes, labels, title, etc, see the rc
## settings for axes and ticks. Special text sizes can be defined
## relative to font.size, using the following values: xx-small, x-small,
## small, medium, large, x-large, xx-large, larger, or smaller
#font.size           : 10.0
#font.serif          : DejaVu Serif, Bitstream Vera Serif, Computer Modern Roman, New Century Schoolbook, Century Schoolbook L, Utopia, ITC Bookman, Bookman, Nimbus Roman No9 L, Times New Roman, Times, Palatino, Charter, serif
#font.sans-serif     : DejaVu Sans, Bitstream Vera Sans, Computer Modern Sans Serif, Lucida Grande, Verdana, Geneva, Lucid, Arial, Helvetica, Avant Garde, sans-serif
#font.cursive        : Apple Chancery, Textile, Zapf Chancery, Sand, Script MT, Felipa, cursive
#font.fantasy        : Comic Sans MS, Chicago, Charcoal, ImpactWestern, Humor Sans, xkcd, fantasy
#font.monospace      : DejaVu Sans Mono, Bitstream Vera Sans Mono, Computer Modern Typewriter, Andale Mono, Nimbus Mono L, Courier New, Courier, Fixed, Terminal, monospace
- Among them, we need to modify font.family and font.sans-serif. One is to remove comments, the other is to add SimHei font. The modified code is as follows:
font.family         : sans-serif
#font.style          : normal
#font.variant        : normal
#font.weight         : normal
#font.stretch        : normal
## note that font.size controls default text sizes.  To configure
## special text sizes tick labels, axes, labels, title, etc, see the rc
## settings for axes and ticks. Special text sizes can be defined
## relative to font.size, using the following values: xx-small, x-small,
## small, medium, large, x-large, xx-large, larger, or smaller
#font.size           : 10.0
#font.serif          : DejaVu Serif, Bitstream Vera Serif, Computer Modern Roman, New Century Schoolbook, Century Schoolbook L, Utopia, ITC Bookman, Bookman, Nimbus Roman No9 L, Times New Roman, Times, Palatino, Charter, serif
font.sans-serif     : SimHei, DejaVu Sans, Bitstream Vera Sans, Computer Modern Sans Serif, Lucida Grande, Verdana, Geneva, Lucid, Arial, Helvetica, Avant Garde, sans-serif
#font.cursive        : Apple Chancery, Textile, Zapf Chancery, Sand, Script MT, Felipa, cursive
#font.fantasy        : Comic Sans MS, Chicago, Charcoal, ImpactWestern, Humor Sans, xkcd, fantasy
#font.monospace      : DejaVu Sans Mono, Bitstream Vera Sans Mono, Computer Modern Typewriter, Andale Mono, Nimbus Mono L, Courier New, Courier, Fixed, Terminal, monospace
Exit after saving!
4. Delete ~/.cache/matplotlib/
- Enter ~/. cache at the terminal
cd ~/.cache/
- Delete the folder matplotlib with the rm command/
rm -rf matplotlib/
5. Close the python kernel, reopen and run the code
It should be noted that before running the test code, it is recommended to close the python kernel, that is, if Pycharm is being turned on, turn it off; if jupyter notebook is being turned on, turn it off first. Then re-enter the compilation environment.
Run the following code to see if Chinese can be displayed properly:
# Applicant Number Options in Statistical Institute's Secondary Schools
import matplotlib
import matplotlib.pyplot as plt
import numpy as np


labels = ['nothing', '10 Below and below', '11 people-20 people', '21 people-30 people', '31 People and above']

men_means = [20, 34, 30, 35, 27]
women_means = [25, 32, 34, 20, 25]

x = np.arange(len(labels))  # the label locations
width = 0.15  # the width of the bars

fig, ax = plt.subplots()
rects1 = ax.bar(x - width/2, men_means, width, label='male')
rects2 = ax.bar(x + width/2, women_means, width, label='female')

# Add some text for labels, title and custom x-axis tick labels, etc.
ax.set_ylabel('Scores')
ax.set_title('Scores by group and gender')
ax.set_xticks(x)
ax.set_xticklabels(labels)
ax.legend()

for l in ax.yaxis.get_ticklabels():
        l.set_family('SimHei')

def autolabel(rects):
    """Attach a text label above each bar in *rects*, displaying its height."""
    for rect in rects:
        height = rect.get_height()
        ax.annotate('{}'.format(height),
                    xy=(rect.get_x() + rect.get_width() / 2, height),
                    xytext=(0, 3),  # 3 points vertical offset
                    textcoords="offset points",
                    ha='center', va='bottom')

autolabel(rects1)
autolabel(rects2)

fig.tight_layout()
plt.show()
The results of my running on jupyter notebook are as follows: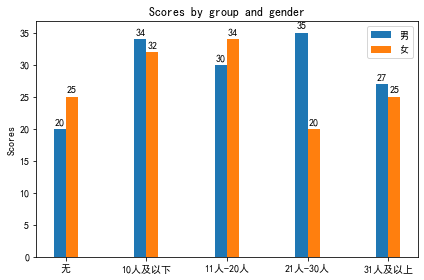
[Author's Introduction] Chen Yi Rong Male, at present Guangdong Human Data Science and Engineering Research Center, School of Electronics and Information, South China University of Technology Studying for a doctor's degree. He has won two scholarships of South China University of Technology, Sanhao students, Excellent Communist Youth League members of South China University of Technology, New Made First Class Scholarship (3000 yuan, No. 3 of the comprehensive survey), Huawei Scholarship (5000 yuan, No. 3 of the comprehensive survey), Huiding Special Scholarship of Science and Technology (15000 yuan, No. 1 of the comprehensive survey), twice the first prize of the Mathematical Modeling Competition of American College Students (MCM), and 2. The second prize of the National College Students Mathematical Modeling Competition (Guangdong Competition Area) in 2016, the first prize of the National College Students Mathematical Modeling Competition (Guangdong Competition Area) in 2017, and the first prize of the Guangdong College Students Electronic Design Competition in 2018 were awarded. They presided over a national innovation training project for college students from 2017 to 2019 and won excellent finals and participated in two competitions. A special fund for the cultivation of scientific and technological innovation of Guangdong University students, a national innovation training project for university students from 2018 to 2019, and four "100-step climbing plan" projects of South China University of Technology have been well finalized. Three SCI papers have been published, five patents for utility models have been authorized, and 17 patents have been accepted (including 13 invention patents and 11 patents have entered the essence). Review stage).
My Github
My CSDN Blog
My Linkedin