Author: Ling ran
In the actual business scenario, pressure testing is an essential part. Whether it is the evaluation of performance bottlenecks such as servers, databases and networks, the business continuity guarantee of important traffic nodes such as browsing, ordering and payment, or the estimation of the overall business stability of the cloud on the move, performance pressure testing is needed to help you establish a complete understanding of the system and business. According to Google's statistics, if the website is opened slowly, the number of user visits will drop by 20% every 500 milliseconds. According to Amazon's statistics, the transaction volume decreases by 1% every 100 milliseconds. These events and statistical data have sounded the alarm for everyone and objectively explained the importance of performance pressure measurement for enterprise applications.
Pressure measurement is to initiate a request to the business system by simulating user behavior, calculate the carrying capacity of the system, and conduct a comprehensive physical examination of the system. After pressure measurement, the system bottleneck can be optimized according to the pressure measurement performance to prevent online failure.
Common pressure measurement software JMeter and PTS in the industry
At present, JMeter is the most widely used open source software in the field of performance pressure measurement.
When the scenario is simple and the test concurrency is not high, JMeter local test can meet the requirements. However, with the increase of Internet users, the demand for greater system load and concurrency is increasing, and the pressure capacity of a single JMeter pressure machine has a certain upper limit, so multiple pressure machines need to be used to improve the pressure capacity of JMeter, which requires the use of JMeter's distributed pressure function.
However, JMeter has many pre preparations for distributed pressure measurement, and the following points need to be paid attention to:
- The firewall of the pressure machine has been closed or the correct port has been opened. SSL is set or disabled for RMI.
- All pressure machines are on the same subnet. If 192 XXX or 10 XXX IP address, the server is located in the same subnet.
- The same version of JMeter and Java is used on all machines.
- All pressure machines have copied the segmented CSV data files and dependent jar packages.
- The collection of monitoring data has been configured.
It can be seen that JMeter's distributed pressure measurement needs to coordinate various resources, and the pre preparation is troublesome. For the personnel implementing pressure measurement, the pressure measurement efficiency is low.
PTS is a performance testing tool developed by Alibaba cloud. It was originally designed to simulate the double 11 traffic peak. Now it has gone through ten years. It has relatively perfect capabilities in scene arrangement, pressure test execution, pressure test monitoring and analysis, report summary and other aspects. It can provide millions of concurrent and tens of millions of TPS traffic initiation capabilities, and is fully compatible with JMeter, It can naturally make up for the disadvantage of JMeter in performance pressure measurement. It is a good choice for users who cannot bypass cluster problems with JMerer.
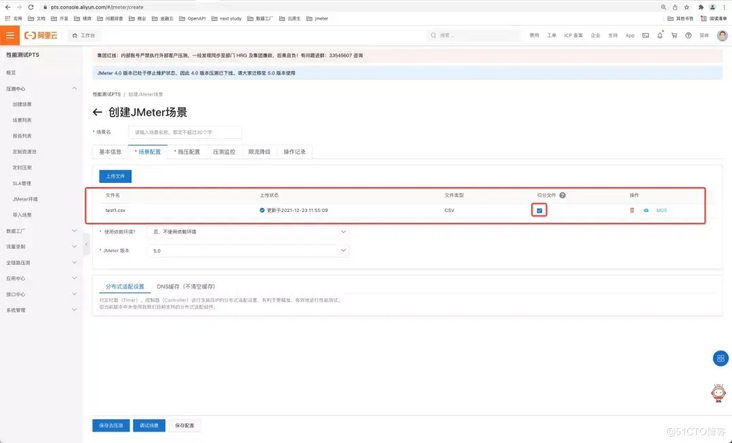
The JMeter pressure measurement of PTS greatly simplifies the JMeter distributed pressure measurement process, and also reduces the maintenance cost of the pressure machine in the pressure measurement process. Using JMeter pressure measurement of PTS, users only need to configure the number of machines to be used on the console, and users do not need to prepare multiple pressure machines with the same Java and JMeter versions installed in advance. At the same time, there is no need for users to segment CSV parameter files according to the number of pressure machines; After the pressure test, PTS will summarize the monitoring data to generate a detailed pressure test report for users to consult.
Compared with executing JMeter script directly on the command line, PTS is more convenient to use, can provide massive pressure capacity on demand, and can provide simple and intuitive monitoring and reporting.


How to initiate JMeter pressure measurement of PTS #
Like all the core steps of pressure measurement, JMeter pressure measurement using PTS mainly focuses on three steps: creating scene, pressure measurement scene and viewing report.
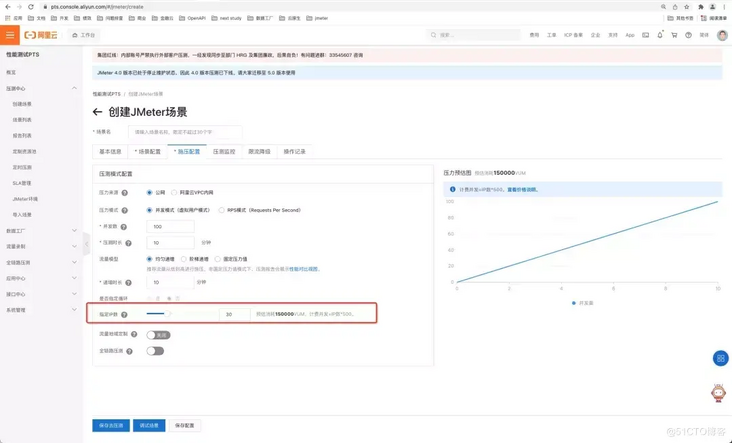
1. Create scenario: the JMeter pressure measurement of PTS takes the scenario as the core, and the pressure measurement object is a scenario. The scenario includes JMeter (native) script, JMeter dependency (a series of dependent jar packages and a series of properties configuration), and some pressure measurement configurations (PTS pressure measurement configuration, such as public network / VPC pressure measurement, concurrency measurement, number of engines, pressure measurement duration, etc.).
2. Pressure test scenario: the operation of the scene is divided into two aspects: one is the addition, deletion, modification and query of the scene configuration, and the other is the pressure test and debugging of the scene.
3. Generate report: each scene pressure test will generate a pressure test task and a report, including key indicators of pressure test, such as TPS, RT, success rate, etc., which can assist users in troubleshooting system performance bottlenecks. In addition, PTS saves the report for 30 days by default, you can view the historical report at any time, and provides the report in PDF format.
In the field of pressure measurement, with the increasing diversification of pressure measurement requirements, more users want to inherit the pressure measurement capability on the cloud to their own systems, or arrange custom pressure measurement platforms according to their own business systems, so as to realize automatic and customized pressure measurement requirements.
Therefore, in order to facilitate the user's ability to conveniently schedule millions of concurrent PTS, PTS has opened JMeter's OpenAPI, which provides the following core functions of pressure measurement: editing scene, debugging scene, pressure measurement scene, viewing runtime data and viewing report.

By integrating OpenAPI, customers can more easily realize the PTS # million level concurrent pressure measurement capability in their own business scenarios, realize various operations such as adding, deleting, modifying and querying scenarios, start the pressure measurement with one click, and stop the pressure measurement at any time during the pressure measurement process. In the pressure test report generated at the same time, in addition to JMeter's native log, there are also aggregated data of PTS for the success rate, TPS and RT indicators of a sampler. In addition, you can also view the report list, JMeter native log and PTS aggregate data of JMeter sampler pressure measurement indicators.
So what are you waiting for? Come on, try to use JMeter's OpenAPI in PTS to write a pressure measurement platform with your million level concurrent pressure measurement capability!
Appendix:
The specific steps are as follows
Introducing pom dependency
<!--establish PTS The entity class required by the scene, if only JMeter Pressure measurement does not need to be introduced-->
<dependency>
  <groupId>com.aliyun</groupId>
  <artifactId>pts-api-entity</artifactId>
  <version>1.0.1</version>
</dependency>
<!--PTS Java SDK Dependence.-->
<dependency>
  <groupId>com.aliyun</groupId>
  <artifactId>pts20201020</artifactId>
  <version>1.8.10</version>
</dependency>
<!--Alibaba cloud core library.-->
<dependency>
  <groupId>com.aliyun</groupId>
  <artifactId>aliyun-java-sdk-core</artifactId>
  <version>4.5.2</version>
</dependency>
\
Copy the following code
import com.aliyun.pts20201020.Client;
import com.aliyun.pts20201020.models.*;
import com.aliyun.teaopenapi.models.Config;

import java.util.ArrayList;
import java.util.List;
import java.util.Map;


public class StartingDemo {

    public static void main(String[] args) throws Exception {
        Client client = getClient();
        // Create scene
        String sceneId = createScene(client);
        // Start scenario
        String reportId = startTesting(client, sceneId);
        // Maximum waiting times
        int count = 0;
        // Query whether a report has been generated
        while (!hasReport(client, reportId) && count++ < 20) {
            // If the report has not been generated, wait (30s) for a period of time before querying
            // Wait as appropriate according to the pressure measurement time
            Thread.sleep(30 * 1000);
        }
        // View report
        getJMeterReport(client, reportId);
    }

    private static boolean hasReport(Client client, String reportId) throws Exception {
        ListJMeterReportsRequest request = new ListJMeterReportsRequest();
        // Paging settings
        request.setPageNumber(1);
        request.setPageSize(1);
        // Query criteria settings
        request.setReportId(reportId);
        ListJMeterReportsResponse response = client.listJMeterReports(request);
        return response.getBody().getReports().size() > 0;
    }

    private static void getJMeterReport(Client client, String reportId) throws Exception {
        // View machine log
        GetJMeterLogsResponse getJMeterLogsResponse = getJMeterLogs(client, reportId);
        List<Map<String, ?>> logs = getJMeterLogsResponse.getBody().getLogs();
        // View sampler aggregate data
        GetJMeterSampleMetricsResponse getJMeterSampleMetrics = getJMeterSampleMetrics(client, reportId);
        List<String> sampleMetricList = getJMeterSampleMetrics.getBody().getSampleMetricList();
        // View sampling log
        GetJMeterSamplingLogsResponse getJMeterSamplingLogs = getJMeterSamplingLogs(client, reportId);
        List<String> sampleResults = getJMeterSamplingLogs.getBody().getSampleResults();
    }

    private static GetJMeterSamplingLogsResponse getJMeterSamplingLogs(Client client, String reportId) throws Exception {
        GetJMeterSamplingLogsRequest request = new GetJMeterSamplingLogsRequest();
        // Paging settings
        request.setPageNumber(1);
        request.setPageSize(10);
        // Condition setting
        request.setReportId(reportId);
        GetJMeterSamplingLogsResponse response = client.getJMeterSamplingLogs(request);
        return response;
    }

    private static GetJMeterSampleMetricsResponse getJMeterSampleMetrics(Client client, String reportId) throws Exception {
        GetJMeterSampleMetricsRequest request = new GetJMeterSampleMetricsRequest();
        // Set report id
        request.setReportId(reportId);
        GetJMeterSampleMetricsResponse response = client.getJMeterSampleMetrics(request);
        return response;
    }

    private static GetJMeterLogsResponse getJMeterLogs(Client client, String reportId) throws Exception {
        GetJMeterLogsRequest request = new GetJMeterLogsRequest();
        // Paging settings
        request.setPageNumber(1);
        request.setPageSize(10);
        // Pressure test engine index of query
        request.setReportId(reportId);
        GetJMeterLogsResponse response = client.getJMeterLogs(request);
        return response;
    }

    private static String startTesting(Client client, String sceneId) throws Exception {
        StartTestingJMeterSceneResponse startTestingSceneResponse = startTestingScene(client, sceneId);
        String reportId = startTestingSceneResponse.getBody().getReportId();
        return reportId;
    }

    private static StartTestingJMeterSceneResponse startTestingScene(Client client, String sceneId) throws Exception {
        StartTestingJMeterSceneRequest request = new StartTestingJMeterSceneRequest();
        request.setSceneId(sceneId);
        StartTestingJMeterSceneResponse response = client.startTestingJMeterScene(request);
        return response;
    }

    private static String createScene(Client client) throws Exception {
        SaveOpenJMeterSceneRequest request = new SaveOpenJMeterSceneRequest();
        // Define scene
        SaveOpenJMeterSceneRequest.SaveOpenJMeterSceneRequestOpenJMeterScene scene = new SaveOpenJMeterSceneRequest.SaveOpenJMeterSceneRequestOpenJMeterScene();
        // Set scene name
        scene.setSceneName("test");
        // Set the file list, including JMeter script, JMeter pressure test dependent jar package, configuration quota data file, etc
        List<SaveOpenJMeterSceneRequest.SaveOpenJMeterSceneRequestOpenJMeterSceneFileList> fileList = new ArrayList<SaveOpenJMeterSceneRequest.SaveOpenJMeterSceneRequestOpenJMeterSceneFileList>();
        // To set the properties of a file, you need to set the name of the file and the oss address accessible to the public network of the file
        SaveOpenJMeterSceneRequest.SaveOpenJMeterSceneRequestOpenJMeterSceneFileList testFile = new SaveOpenJMeterSceneRequest.SaveOpenJMeterSceneRequestOpenJMeterSceneFileList();
        testFile.setFileName("baidu.jmx");
        testFile.setFileOssAddress("https://pts-openapi-test.oss-cn-shanghai.aliyuncs.com/baidu.jmx");
        fileList.add(testFile);
        scene.setFileList(fileList);
        // Set the scene concurrency, which can be set to 1 million
        scene.setConcurrency(1000000);
        // Description of setting the number of engines: an engine can send up to 500 concurrent messages and at least 1 concurrent message, so the number of engines that can be set here is [21000]. In addition, the more the number of engines, the faster the consumption of vum
        scene.setAgentCount(2000);
        // Set the pressure measurement duration for 60s
        scene.setDuration(60);
        // Set the name of the test file, which should be included in the file list
        scene.setTestFile("baidu.jmx");
        request.setOpenJMeterScene(scene);
        SaveOpenJMeterSceneResponse response = client.saveOpenJMeterScene(request);
        return response.getBody().getSceneId();
    }

    private static Client getClient() throws Exception {
        // Fill in your own AK/SK
        String accessKeyId = "ak";
        String accessKeySecret = "sk";
        Config config = new Config();
        config.setAccessKeyId(accessKeyId);
        config.setAccessKeySecret(accessKeySecret);
        Client client = new Client(config);
        return client;
    }
}
Fill in your own ak/sk
Fill in the correct ak/sk in the getClient of the above code
Click start
Click the main method to start
Click Here , go to PTS official website for more details!