How to select the appropriate number of partitions
How to select the appropriate number of partitions? This is a problem that many Kafka users often face, but there seems to be no very authoritative answer to this problem. Moreover, there is obviously no fixed answer to this question. We can only make specific analysis from some angles. Finally, we should make specific considerations according to the actual business scenario, software conditions, hardware conditions, load conditions, etc. This section mainly introduces some important decision-making factors related to this problem, so that readers can have reference basis when encountering similar problems.
Performance test tool
In Kafka, there is an inevitable relationship between performance and the number of partitions. Generally, performance factors should also be considered when setting the number of partitions. For different hardware, the corresponding performance will be different. In the actual production environment, we need to understand the performance indicators corresponding to a set of hardware before we can allocate its appropriate applications and loads, so performance testing tools are essential.
The performance testing tools to be discussed in this section are kafka-producer- perf-test.sh for producer performance testing and kafka-consumer-perf-test.sh for consumer performance testing provided by Kafka itself.
First, let's take a look at the use of the kafka-producer-perf-test.sh script through an example. We send 1 million messages to a topic topic-1 with only one partition and one copy, and the size of each message is 1024B, and the ACK parameter corresponding to the producer is 1. Refer to the following for details:
[root@node1 kafka_2.11-2.0.0]# bin/kafka-producer-perf-test.sh --topic topic-1 --num-records 1000000 --record-size 1024 --throughput -1 --producer-props bootstrap. servers=localhost:9092 acks=1
273616 records sent, 54723.2 records/sec (53.44 MB/sec), 468.6 ms avg latency, 544.0 max latency.
337410 records sent, 67482.0 records/sec (65.90 MB/sec), 454.4 ms avg latency, 521.0 max latency.
341910 records sent, 68382.0 records/sec (66.78 MB/sec), 449.4 ms avg latency, 478.0 max latency.
1000000 records sent, 63690.210815 records/sec (62.20 MB/sec), 456.17 ms avg latency, 544.00 ms max latency, 458 ms 50th, 517 ms 95th, 525 ms 99th, 543 ms 99.9th.
In the example, when using the kafka-producer-perf-test.sh script, one more parameter is used, where topic is used to specify the target topic of the message sent by the producer; Num records is used to specify the total number of messages sent; Record size is used to set the number of bytes of each message; The producer props parameter is used to specify the producer's configuration. Multiple groups of configurations can be specified at the same time. Each group of configurations is separated by spaces. There is also a producer.config parameter corresponding to the producer props parameter, which is used to specify the producer's configuration file; Throughput is used for current limiting control. When the set value is less than 0, there is no current limiting. When the set value is greater than 0, when the transmission throughput is greater than this value, it will be blocked for a period of time. In the following example, the value of throughout is set to 100 bytes. Let's take a look at the actual effect:
[root@node1 kafka_2.11-2.0.0]# bin/kafka-producer-perf-test.sh --topic topic-1 --num-records 1000000 --record-size 1024 --throughput 100 --producer-props bootstrap. servers=localhost:9092 acks=1
502 records sent, 100.3 records/sec (0.10 MB/sec), 2.5 ms avg latency, 266.0 max latency.
501 records sent, 100.0 records/sec (0.10 MB/sec), 0.9 ms avg latency, 11.0 max latency.
500 records sent, 99.9 records/sec (0.10 MB/sec), 0.8 ms avg latency, 3.0 max latency.
501 records sent, 100.2 records/sec (0.10 MB/sec), 0.7 ms avg latency, 3.0 max latency.
500 records sent, 100.0 records/sec (0.10 MB/sec), 0.7 ms avg latency, 5.0 max latency.
(...Omit several)
kafka-producer-perf-test.sh script also has an interesting parameter print metrics. When this parameter is specified, a lot of indicator information will be printed after the test is completed, which has certain reference value for many test tasks. Example references are as follows:
[root@node1 kafka_2.11-2.0.0]# bin/kafka-producer-perf-test.sh --topic topic-1 --num-records 1000000 --record-size 1024 --throughput -1 --print-metrics --producer-props bootstrap.servers=localhost:9092 acks=1
272926 records sent, 54585.2 records/sec (53.31 MB/sec), 469.6 ms avg latency, 638.0 max latency.
331020 records sent, 66204.0 records/sec (64.65 MB/sec), 463.8 ms avg latency, 507.0 max latency.
345960 records sent, 69192.0 records/sec (67.57 MB/sec), 443.8 ms avg latency, 477.0 max latency.
1000000 records sent, 63552.589768 records/sec (62.06 MB/sec), 457.73 ms avg latency, 638.00 ms max latency, 457 ms 50th, 532 ms 95th, 592 ms 99th, 633 ms 99.9th.

Metric Name                                                         Value
app-info:commit-id:{client-id=producer-1}					: 3402a8361b734732
app-info:version:{client-id=producer-1}					: 2.0.0
kafka-metrics-count:count:{client-id=producer-1}			: 94.000
producer-metrics:batch-size-avg:{client-id=producer-1}	: 15555.923
producer-metrics:batch-size-max:{client-id=producer-1}	: 15556.000
producer-metrics:batch-split-rate:{client-id=producer-1}	: 0.000
producer-metrics:batch-split-total:{client-id=producer-1}	: 0.000
producer-metrics:buffer-available-bytes:{client-id=producer-1}  	  : 33554432.000
producer-metrics:buffer-exhausted-rate:{client-id=producer-1}	  : 0.000
producer-metrics:buffer-exhausted-total:{client-id=producer-1}  : 0.000
producer-metrics:buffer-total-bytes:{client-id=producer-1}	  : 33554432.000
producer-metrics:bufferpool-wait-ratio:{client-id=producer-1}	  : 0.278
producer-metrics:bufferpool-wait-time-total:{client-id=producer-1}	  : 12481086207.000
(...Omit several)
There are other parameters in the kafka-producer-perf-test.sh script, such as payload delimiter and transactional ID. readers can explore more details of this script by themselves.
Let's focus on the output information of kafka-producer-perf-test.sh script. Take the following line as an example:
1000000 records sent, 63690.210815 records/sec (62.20 MB/sec), 456.17 ms avg latency, 544.00 ms max latency, 458 ms 50th, 517 ms 95th, 525 ms 99th, 543 ms 99.9th.
records sent indicates the total number of messages sent during the test; records/sec means to count the throughput based on the number of messages sent per second, and MB/sec in parentheses means to count the throughput based on the size of messages sent per second. Note the dimensions of these two; avg latency represents the average time-consuming of message processing; max latency indicates the maximum time-consuming of message processing; The 50th, 95th, 99th and 99.9th represent 50%, 95%, 99% and 99.9% of the message processing time, respectively. The kafka-consumer-perf-test.sh script is also easy to use. The following example simply demonstrates its use:
[root@node1 kafka_2.11-2.0.0]# bin/kafka-consumer-perf-test.sh --topic topic-1 --messages 1000000 --broker-list localhost:9092
start.time, end.time, data.consumed.in.MB, MB.sec, data.consumed.in.nMsg, nMsg.sec, rebalance.time.ms, fetch.time.ms, fetch.MB.sec, fetch.nMsg.sec
2018-09-22 12:27:49:827, 2018-09-22 12:27:57:068, 976.5625, 134.8657, 1000000, 138102.4720, 105, 7136, 136.8501, 140134.5291
The example simply consumes 1 million messages in topic-1. The script also contains many other parameters, such as from latest, group, print metrics, threads, etc. the length is limited. Readers can understand the details of these parameters by themselves.
The output result contains a number of information, corresponding to the start running time (start. Time), the end running time (end. Time), the total number of messages consumed (data.consumed.in.MB, unit: MB), the consumption throughput calculated by byte size (MB.sec, unit: MB/s), the total number of messages consumed (data.consumed.in.nMsg), and the throughput calculated by the number of messages (nMsg.sec), rebalance time (rebalance.time.ms, unit: ms), duration of pulling messages (fetch.time.ms, unit: ms), byte size of pulling messages per second (fetch.MB.sec, unit: MB/s), number of pulling messages per second (fetch.nMsg.sec). Where fetch.time.ms = end.time – start.time – rebalance.time.ms.
Here is just a brief understanding of the basic usage of the two scripts. Readers can also adjust the test scenario by setting different parameters to obtain a relatively perfect test report for the current hardware resources.
Does the higher the number of partitions, the higher the throughput
Partition is the smallest parallel operation unit in Kafka. For producers, the data writing of each partition can be parallelized completely; for consumers, Kafka only allows the messages in a single partition to be consumed by a consumer thread, and the consumption parallelism of a consumer group completely depends on the number of partitions consumed. In this way, if the number of partitions in a subject is more In theory, the larger the throughput can be achieved, is it really as expected?
Let's use the performance testing tools described above to actually test. First, create topics with partition numbers of 1, 20, 50, 100, 200, 500 and 1000 respectively. The corresponding topic names are topic-1, topic-20, topic-50, topic-100, topic-200, topic-500 and topic-1000 respectively. The copy factor of all topics is set to 1.
The performance of message oriented middleware generally refers to throughput (broadly speaking, it also includes latency). Regardless of the impact of hardware resources, the throughput of message writing will also be affected by message size, message compression mode, message sending mode (synchronous / asynchronous) and message acknowledgement type (acks) The throughput of message consumption is also affected by the processing speed of application logic due to the influence of parameters such as, replica factor, etc. in this case, the influence of these factors will not be considered temporarily. All tests maintain the same factors except the number of partitions of the subject.
The test environment used in this case is a 3-node Kafka cluster composed of 3 ordinary virtual machines. The memory size of each virtual machine is 8GB, the disk size is 40GB, and the dominant frequency of 4-core CPU is 2600MHz. The JVM version is 1.8.0_ 112. The Linux system version is 2.6.32-504.23.4.el6.x86_64. Use the kafka-producer-perf-test.sh script to send 1 million messages with a message body size of 1KB to these topics respectively. The corresponding test commands are as follows:
bin/kafka-producer-perf-test.sh --topic topic-xxx --num-records 1000000 --record-size 1024 --throughput -1 --producer-props bootstrap.servers=localhost: 9092 acks=1
The corresponding producer performance test results are shown in the figure below. The test results of different hardware environments and even different batches of tests will not be exactly the same, but the overall trend will remain the same as in the figure below.
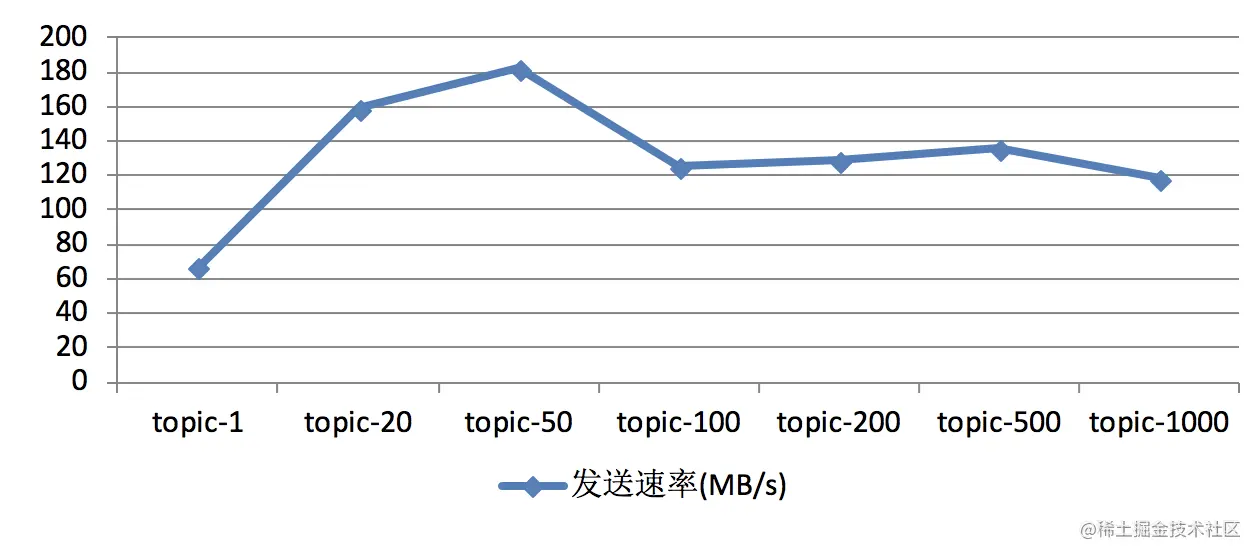
In the figure above, we can see that when the number of partitions is 1, the throughput is the lowest. With the increase of the number of partitions, the corresponding throughput also increases. Once the number of partitions exceeds a certain threshold, the overall throughput does not increase but decreases. In other words, the more partitions, the greater the throughput. The critical threshold of partition number here will also show different results for different test environments. In practical application, a reasonable critical value interval can be found through similar test cases (such as copying production traffic for test playback).
The above tests are aimed at message producers. For message consumers, there are also throughput considerations. Use the kafka-consumer-perf-test.sh script to consume 1 million messages in these topics respectively. The corresponding test commands are as follows:
bin/kafka-consumer-perf-test.sh --topic topic-xxx --messages 1000000 --broker-list localhost:9092
The results of the consumer performance test are shown in the figure below. The same as the producer performance test, the test results obtained in different test environments or different test batches are also different, but the overall trend will remain the same as that in the figure below.
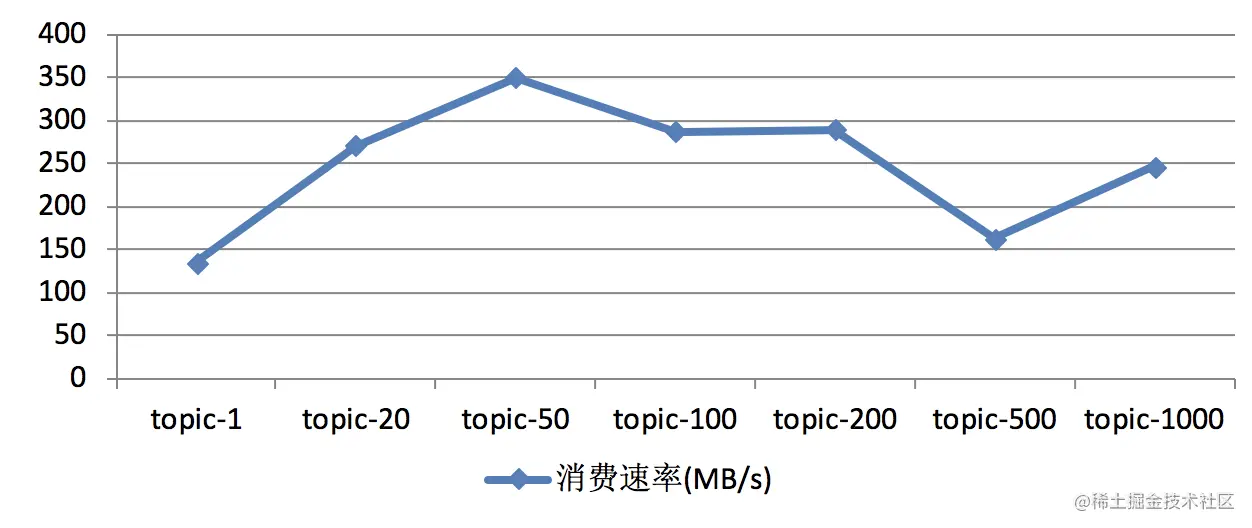
In the figure above, as the number of partitions increases, the corresponding throughput will also increase. Once the number of partitions exceeds a certain threshold, the overall throughput does not increase but decreases. It also shows that the more the number of partitions will not increase the throughput all the time.
In the same set of environment, we can also test the performance of sending messages to two topics with 200 partitions at the same time. Assuming that the throughput corresponding to the two topics in the test result is A and B respectively, and then test the performance of sending messages to only one topic with 200 partitions. Assuming that the throughput obtained in the test result is C, we will find that A < C, B < C and A + b > C. It can be found that due to the factors of sharing system resources, A and B will affect each other. From the result of A + b > C, it can be seen that the point of topic-200 in the first figure does not touch the bottleneck of system resources, and the decrease of throughput is not caused by the bottleneck of system resources.
In this section, we counter prove the proposition that the more partitions, the higher throughput. In fact, to prove that a point of view is wrong, we only need to give a counter example, and so is the content of this section. However, this section does not specify the view that the higher the number of partitions, the lower the throughput, and the specific value and trend of throughput will be related to disk, file system and I/O scheduling policy. The more partitions, the higher the throughput? Many data on the Internet agree with this view, but in fact, many things will have a critical value. When this critical value is exceeded, many originally consistent with the established logic will become different. Readers need to have a clear understanding of this, know how to eliminate the false and seek the truth, and field test and verification can be regarded as a bridge to true knowledge.