Troubleshoot SQL with SAP HANA Database Explorer
The debugger can be used to help find problems in procedures, functions, or anonymous blocks. The following steps demonstrate how to use the debugger to debug the process.
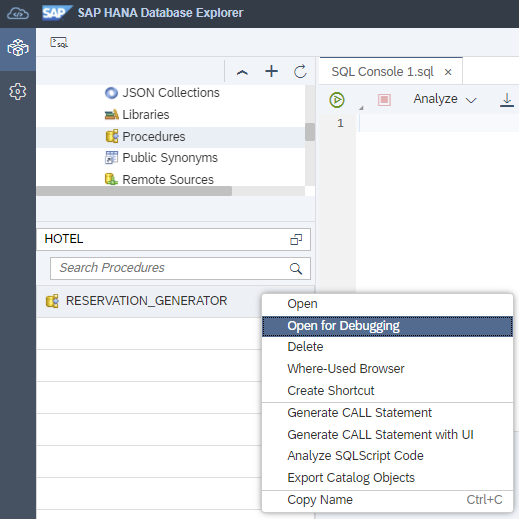
Select a stored procedure, right-click it, and select Open for debugging:
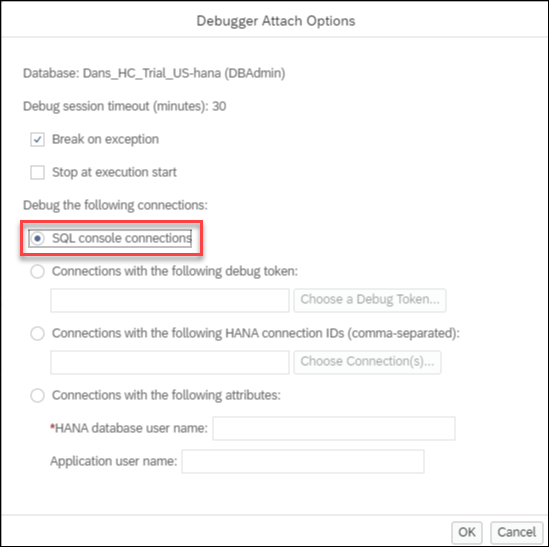
From the debugger attach Options dialog box, ensure that the SQL console connection is selected.
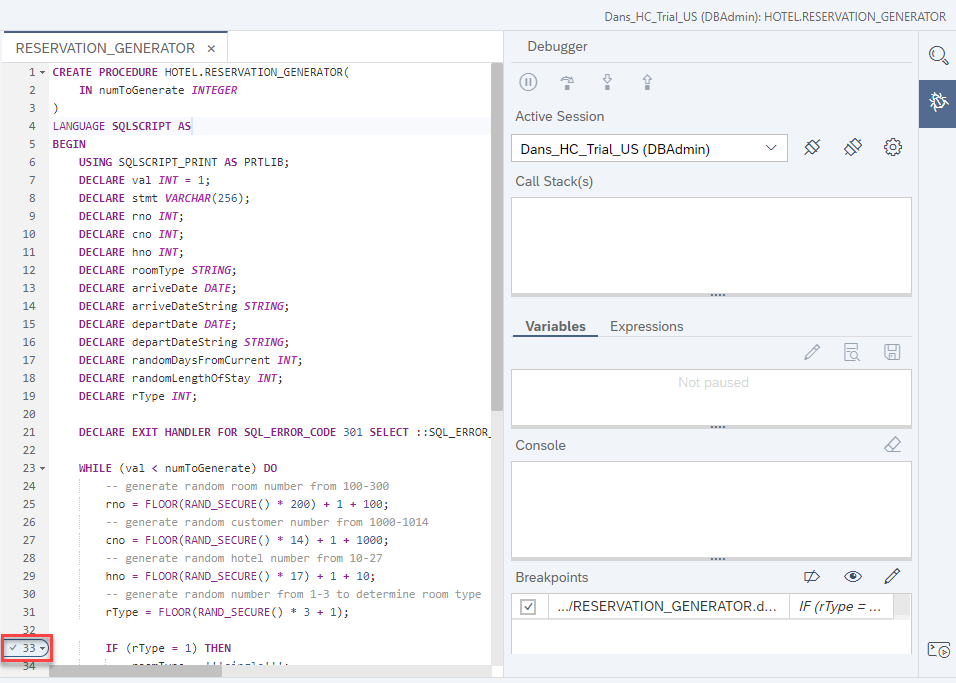
Set a breakpoint in the process by clicking next to the line number. A check mark appears next to the line number to indicate that a breakpoint has been set.
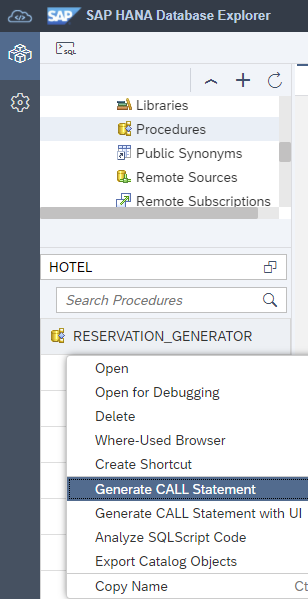
Right click the stored procedure you want to debug in the database browser and select Generate Call Statement or Generate Call Statement with UI.
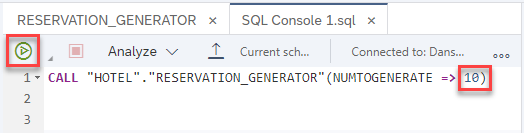
The calling statement of the procedure will open in the new SQL console. Provide an input parameter value, such as 10, and then run the statement.
When the break point is triggered, execution is suspended.
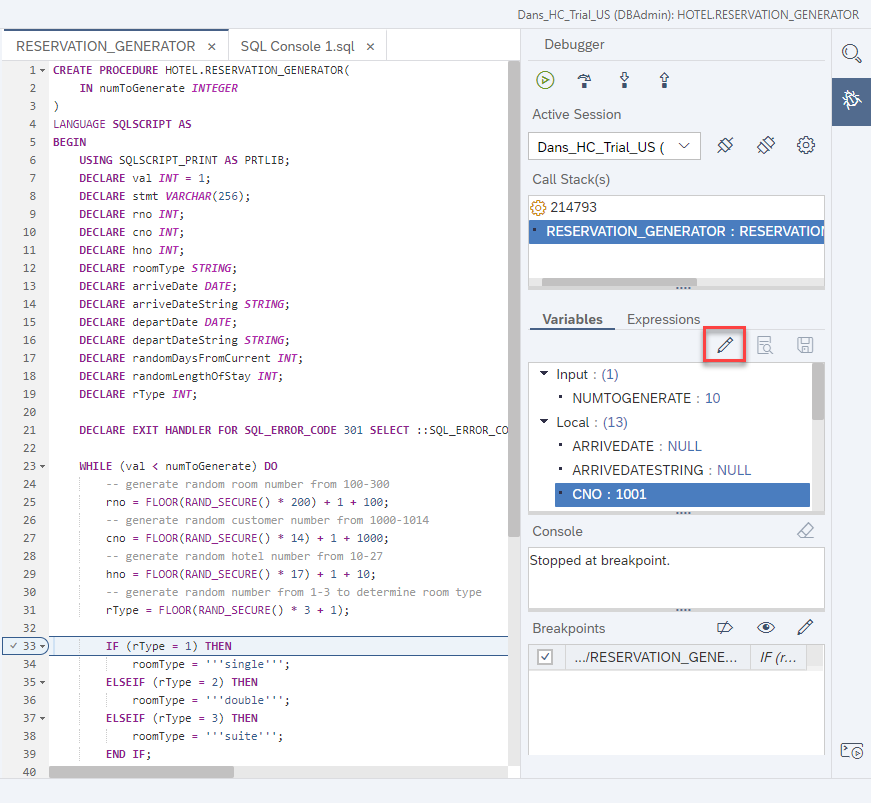
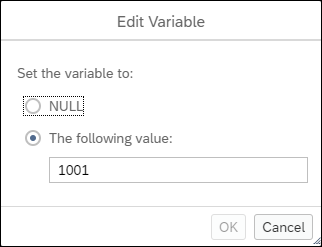
You can check the current value of any variable you use. You can modify the values of some local and global variable types by clicking the Edit button highlighted above.
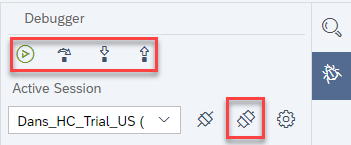
You can continue execution using the navigation icon at the top of the debugger. You can use the detach icon to stop a debug session.
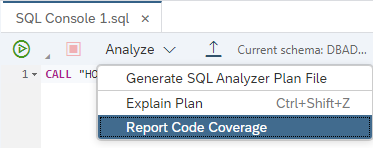
In the right-click menu, you can also use Report Code Coverage to view the code execution coverage:
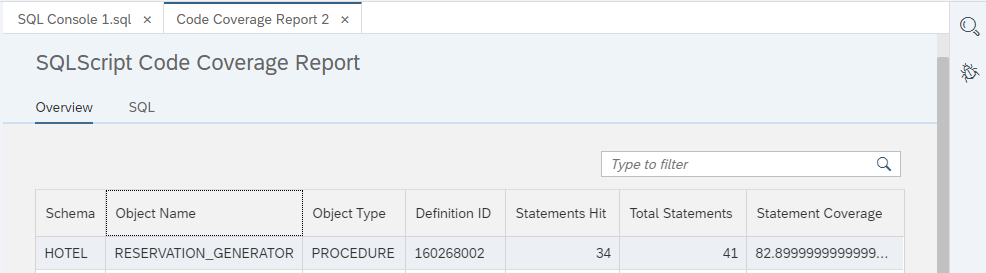
The code coverage report shows the number of statements hit.
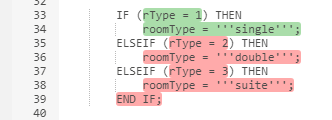
The report also visually shows hit and missed statements.
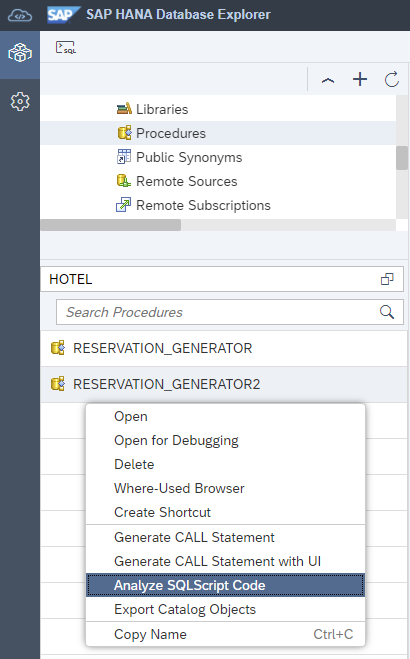
SQLScript analysis
SQLScript code analyzer can be used to identify patterns that indicate code quality, security, or performance problems.
The effects are as follows:
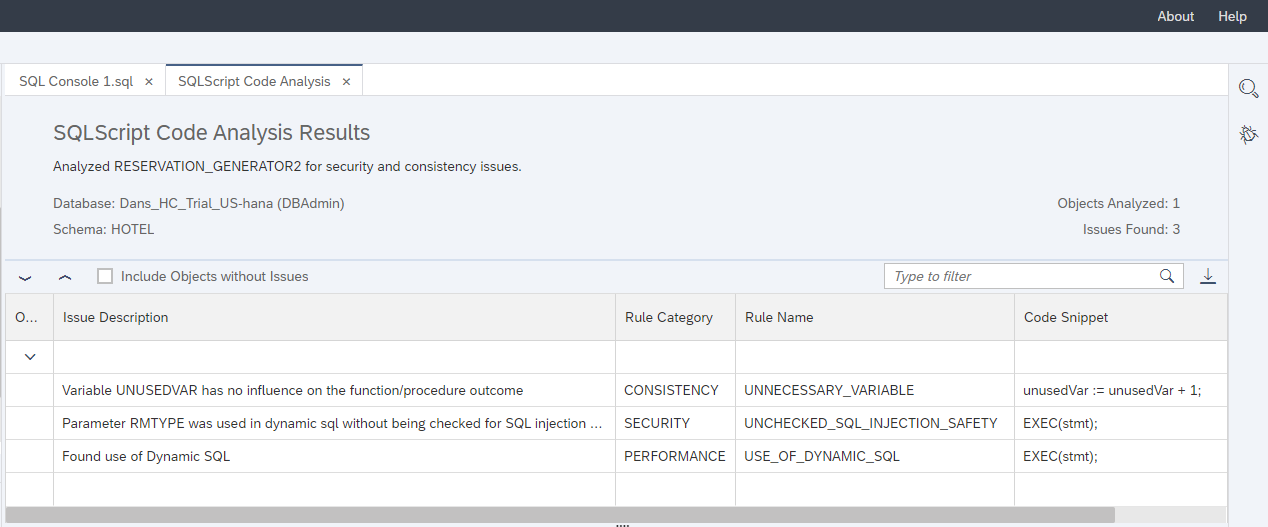
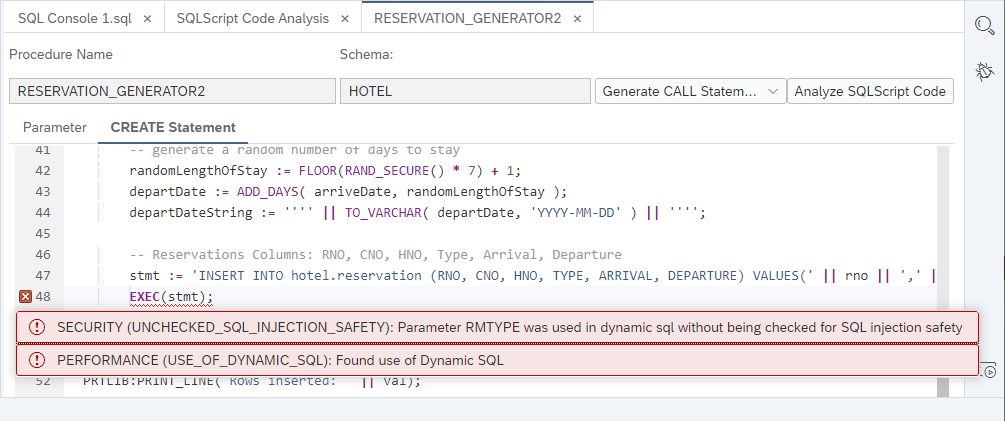
Double clicking an issue will open another tab containing the SQL of the procedure, and the issue will be highlighted.
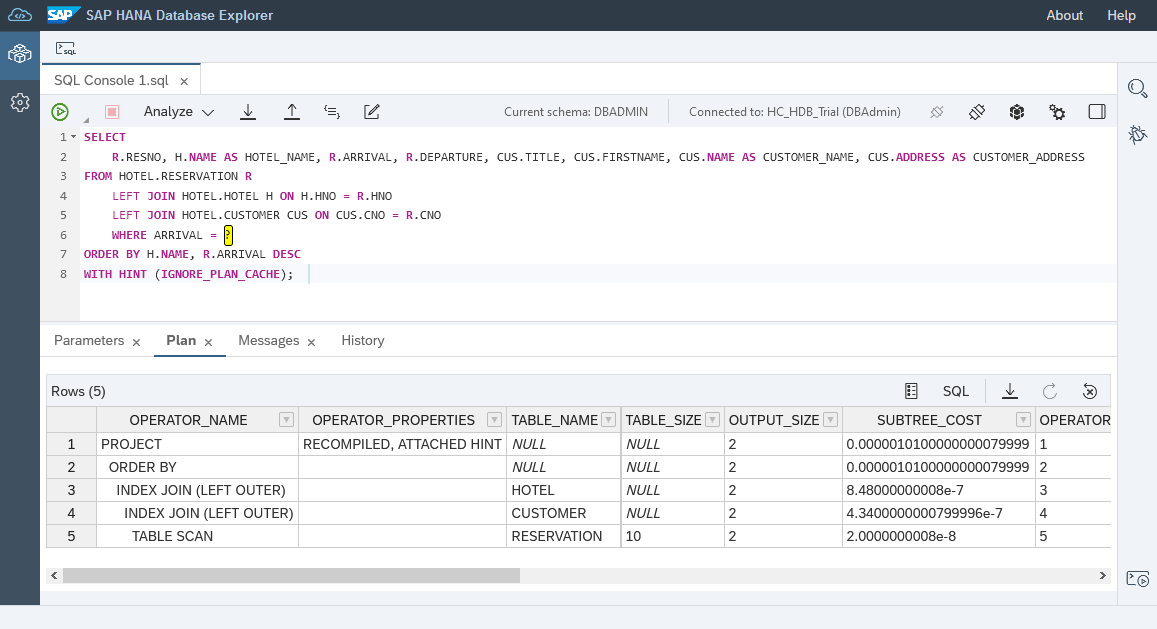
Explain plan
Explain plan provides the compiled plan in tabular form without executing it. This is useful when it is difficult to reproduce a problem without causing a problem.
The effects are as follows:
SQL Analyzer
The SQL Analyzer provides a graphical view of how the analyzed SQL statements are executed, which can provide more insight into query execution. The latest version can be used as an extension to Visual Studio Code or as an additional extension in SAP Business Application Studio (SAP Performance Tools). You can generate one in the SAP HANA database browser plv file, which can then be opened in SQL Analyzer. Previous versions of SQL Analyzer are also included in the on premises SAP HANA database browser, on premises SAP HANA cockpit and SAP HANA studio.
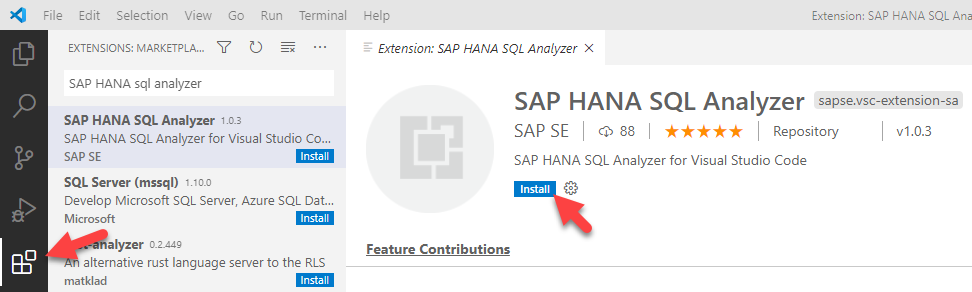
You can install the corresponding plug-in in Visual Studio Code to view the analysis file:
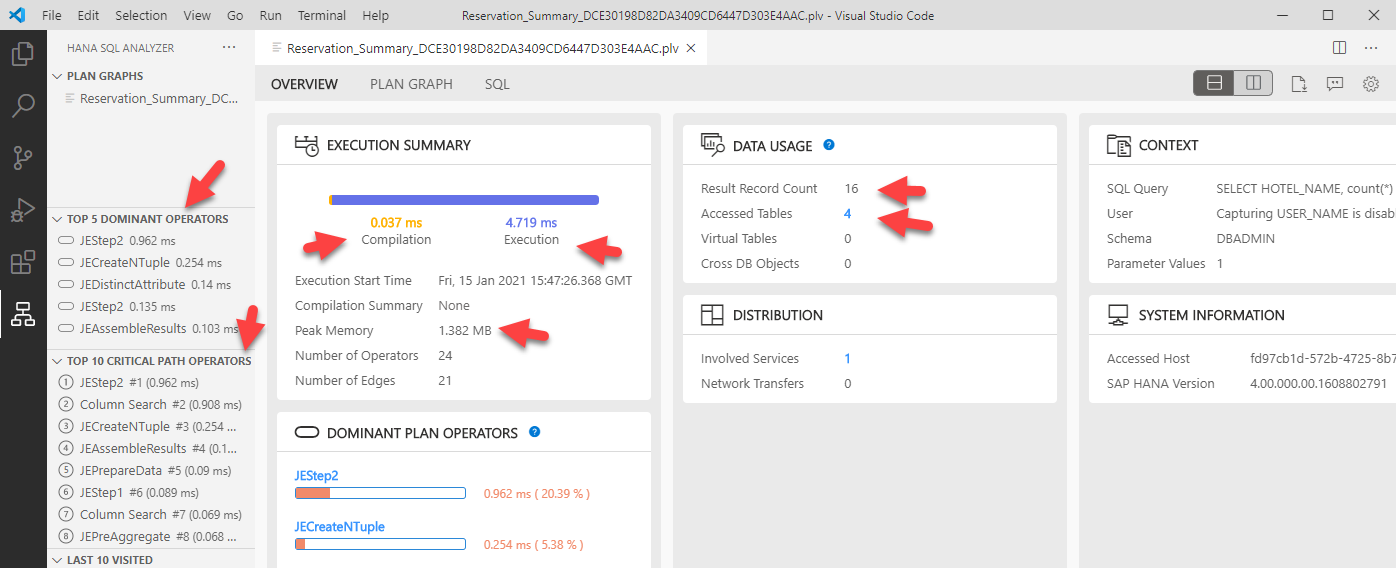
Displays the first 5 main operators, the first 10 critical path operators, the time spent compiling and executing SQL statements, the peak memory, the number of result records, and the information of the access table.
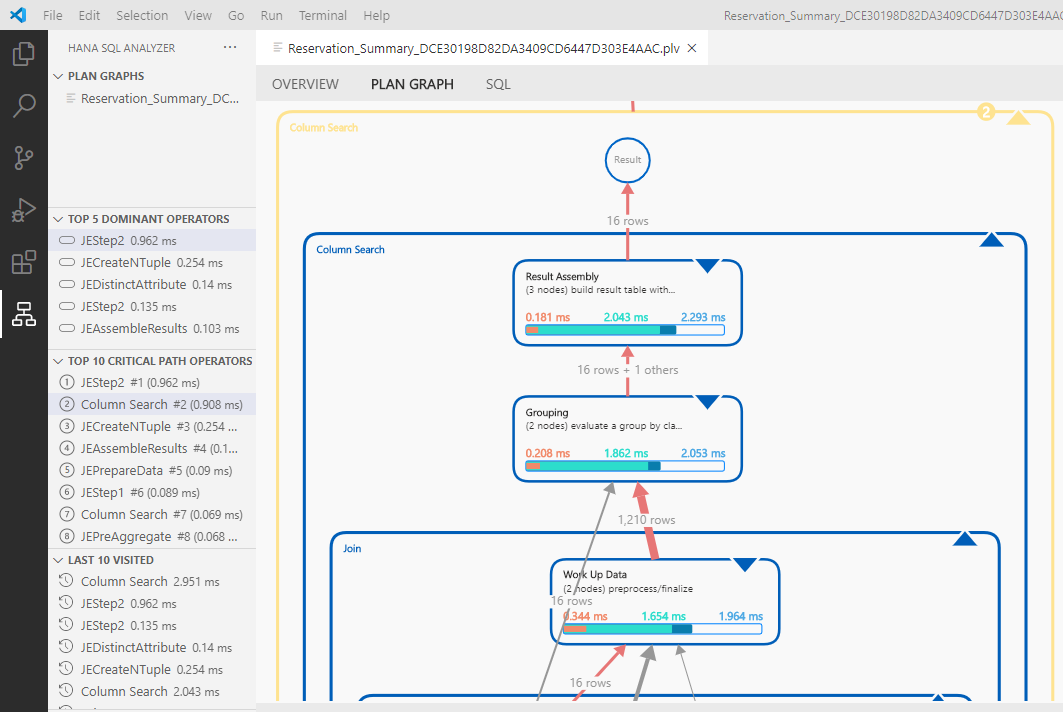
Switch to the PLAN GRAPH tab to visually view the details of query execution.
SQL trace
SQL tracing can be helpful when debugging problems or identifying SQL statements being used by a particular application. The following steps demonstrate an example of enabling SQL tracing and then using SAP HANA Database Explorer to view the generated trace file.
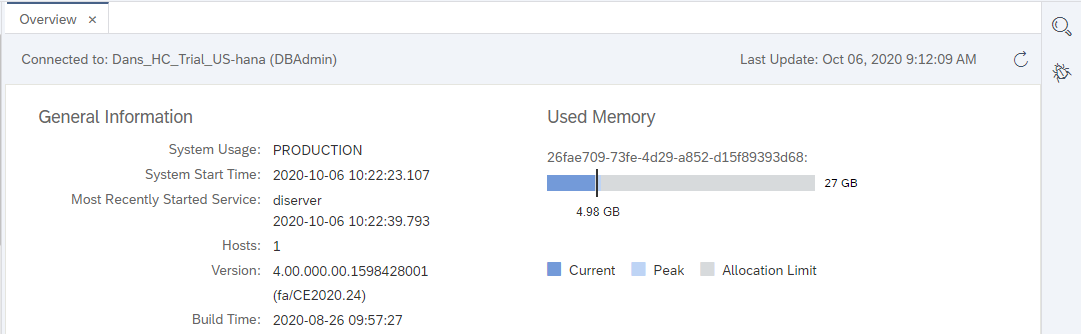
Query through Show overview in the right-click menu:
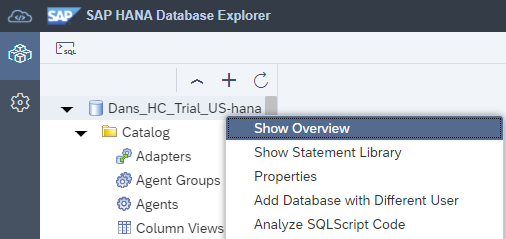
Displays different information and statistics for the selected database.
To determine the SQL requests performed to populate the various fields of the overview, such as the memory used, enable SQL tracing by running the following SQL statement in the SQL console.
ALTER SYSTEM ALTER CONFIGURATION ('indexserver.ini', 'SYSTEM') SET ('sqltrace', 'trace') = 'on', ('sqltrace', 'application') = 'sap_xsac_hrtt', ('sqltrace', 'user') = 'DBAdmin' WITH RECONFIGURE;
You can view the name of the profile, their contents, and change history by selecting the following monitoring Views:
- M_INIFILES
- M_INIFILE_CONTENTS
- M_INIFILE_CONTENT_HISTORY
- CONFIGURATION_PARAMETER_PROPERTIES
- M_CONFIGURATION_PARAMETER_VALUES
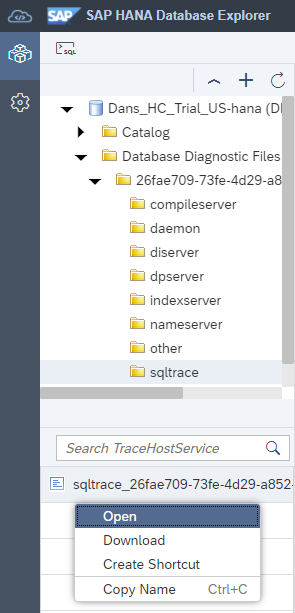
Location of trace file:
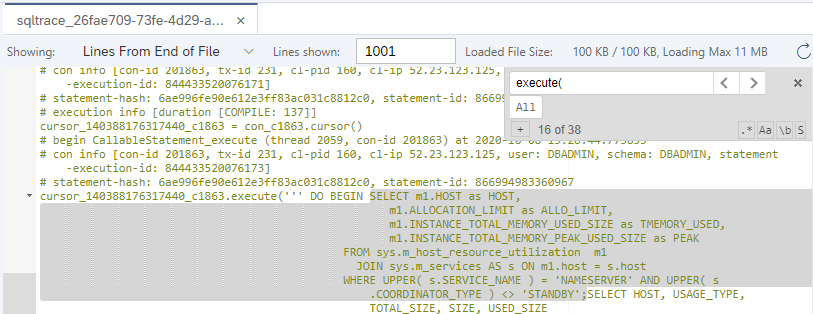
You can view SQL queries in a file that return information about the memory being used by HANA instances. For example, the highlighted query is such an SQL request.
Expensive statements trace
It may be important to examine SQL statements that consume a lot of time, CPU, or memory. The following steps demonstrate how to enable expensive statement tracing.
The following SQL will enable the tracking of expensive statements, set the threshold, run some statements that will exceed the threshold, and then disable the tracking of expensive statements.
ALTER SYSTEM ALTER CONFIGURATION ('global.ini', 'DATABASE') SET ('expensive_statement', 'enable') = 'on' WITH RECONFIGURE;
ALTER SYSTEM ALTER CONFIGURATION ('global.ini', 'DATABASE') SET ('expensive_statement', 'threshold_memory') = '41943040' WITH RECONFIGURE;   -- 40 MB
ALTER SYSTEM ALTER CONFIGURATION ('global.ini', 'DATABASE') SET ('expensive_statement', 'threshold_duration') = '3000000' WITH RECONFIGURE;  -- 3 sec

CALL HOTEL.RESERVATION_GENERATOR(1000);  --consumes more than 40 MB of memory

DO BEGIN
  -- Wait for a few seconds
  USING SQLSCRIPT_SYNC AS SYNCLIB;
  CALL SYNCLIB:SLEEP_SECONDS( 3 );  --runs for longer than 3 seconds
  -- Now execute a query
  SELECT * FROM M_TABLES;
END;

ALTER SYSTEM ALTER CONFIGURATION ('global.ini', 'DATABASE') SET ('expensive_statement', 'enable') = 'off' WITH RECONFIGURE;
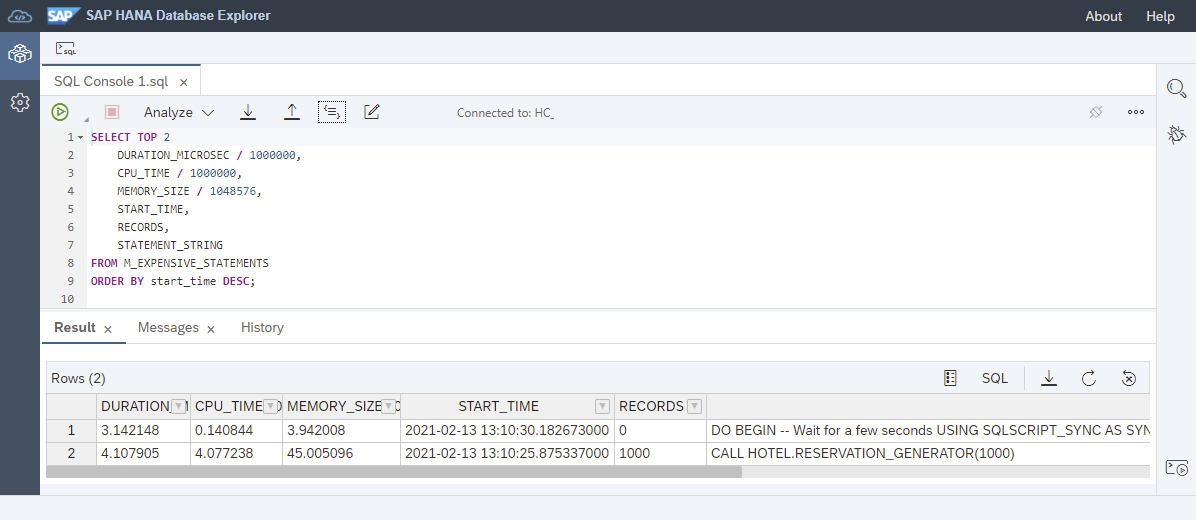
You can find a list of statements that exceed the expensive statement threshold in the view: M_EXPENSIVE_STATEMENTS
select TOP 2 DURATION_MICROSEC/1000000, CPU_TIME/1000000, MEMORY_SIZE/1048576, START_TIME, RECORDS, STATEMENT_STRING from M_EXPENSIVE_STATEMENTS order by start_time desc;
Viewing trace files with SQL
The SAP HANA database provides a set of monitoring views that allow access to trace files. An example is M_MERGED_TRACES system view, which contains the contents of multiple trace files and allows queries to be executed across trace files within a specific time period. The following instructions provide some examples of accessing views.
You can query information about available trace files and content from individual trace files.
SELECT * FROM M_TRACEFILES;
SELECT * FROM M_TRACEFILE_CONTENTS  WHERE HOST = 'XXXXXXXX' AND FILE_NAME='XXXXXXXX.XXX';
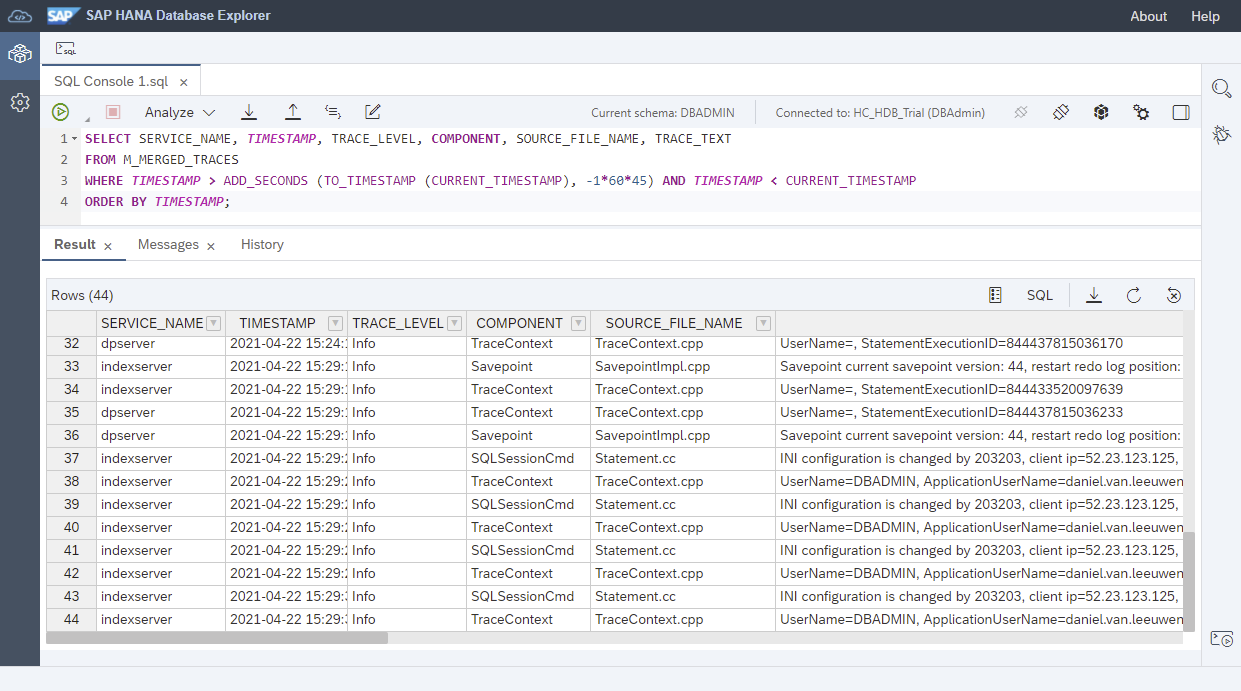
Execute the following SQL query to view the entries in the past 45 minutes.
SELECT SERVICE_NAME, TIMESTAMP, TRACE_LEVEL, COMPONENT, SOURCE_FILE_NAME, TRACE_TEXT
FROM M_MERGED_TRACES
WHERE TIMESTAMP > ADD_SECONDS (TO_TIMESTAMP (CURRENT_TIMESTAMP), -1*60*45) AND TIMESTAMP < CURRENT_TIMESTAMP
ORDER BY TIMESTAMP;
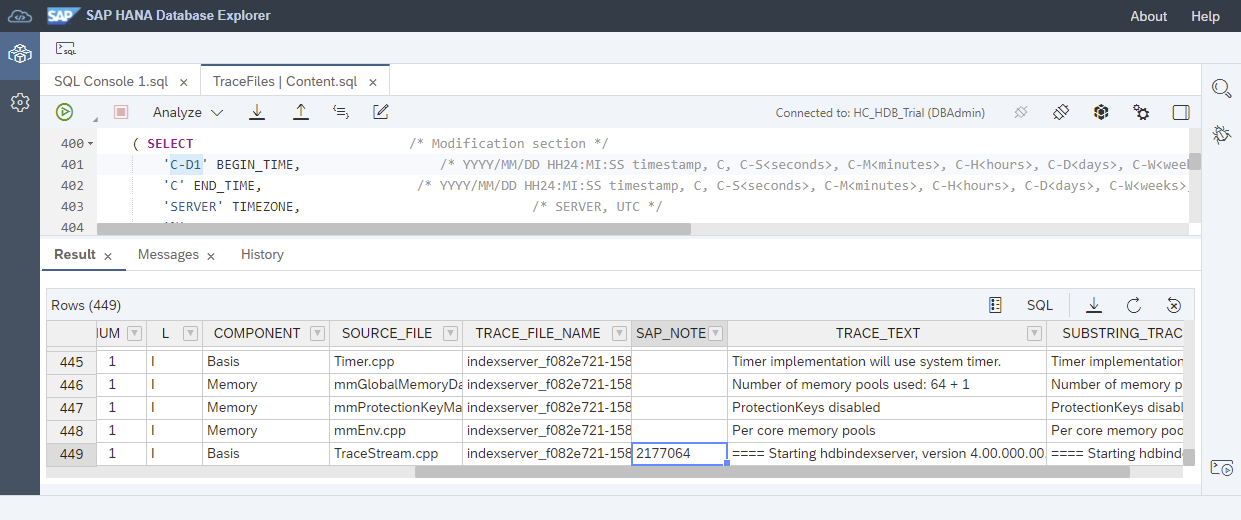
The SAP Note SQL statement collection for SAP HANA contains a SQL statement named HANA_TraceFiles_Content, which also includes relevant SAP comments that match some strings in the trace file.
More Jerry's original articles are: "Wang Zixi":