Preface
Prometheus is an open source system for monitoring and alerting. Originally developed by Soundcloud, it moved to CNCF in 2016 and became one of the most popular projects since it was called Kubernetes. It can monitor from the whole Linux server to stand alone web server, database service or a single process. In Prometheus terminology, what it monitors is called a target. Each target unit is called a metric. It grabs targets through http at set intervals to collect metrics and place data in its Time Series Database. You can use the PromQL query language to query the relevant target indicators.

In this article, we'll show you step by step how to:
-
Install Prometheus (using Prometheus operator helm chart) to monitor / alarm based on custom events
-
Create and configure custom alarm rules, which will issue alarms when conditions are met
-
Integrate Alertmanager to handle alerts sent by client applications (Prometheus server in this case)
-
Integrate Alertmanager with email accounts that send alert notifications.
Understanding Prometheus and its abstract concepts
From the figure below, we will see all the components that make up the Prometheus ecosystem:
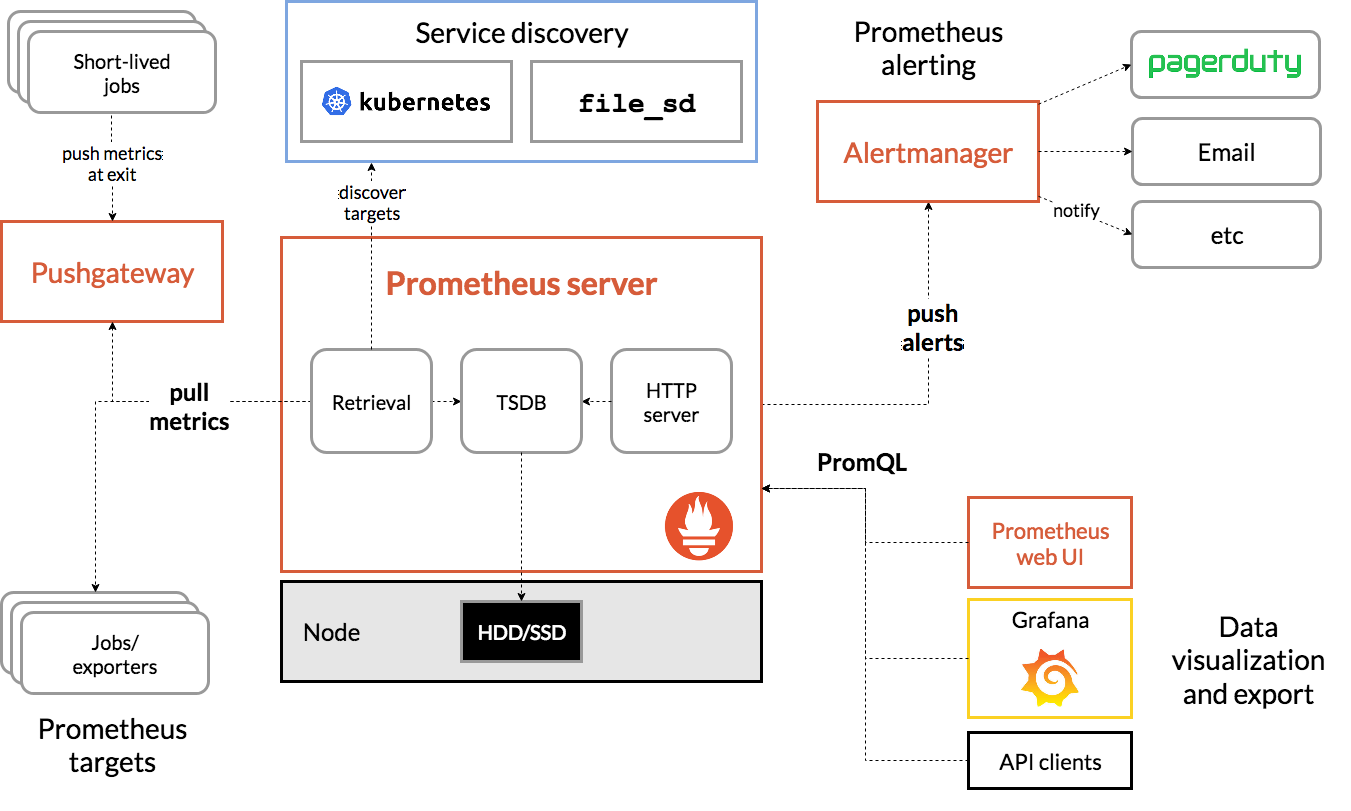
The following are terms related to this article, you can quickly understand:
-
Prometheus Server: the main component of capturing and storing indicators in temporal database
Grab: a pull method to obtain an indicator. It usually grabs at 10-60 second intervals.
Target: server client to retrieve data
-
Service discovery: enable Prometheus to identify applications it needs to monitor and pull metrics in a dynamic environment
-
Alert Manager: the component responsible for handling alerts (including silencing, initiation, aggregation of alert information, and sending alert notifications by email, PagerDuty, Slack, etc.).
-
Data visualization: the captured data is stored in local storage and queried directly with PromQL, or viewed through the Grafana dashboard.
Understanding Prometheus Operator
According to CoreOS, the project owner of Prometheus Operator, Prometheus Operator can configure native Kubernetes and manage and operate Prometheus and Alertmanager clusters.
This Operator introduces the following Kubernetes custom resource definitions (CRDs): Prometheus, ServiceMonitor, PrometheusRule, and Alertmanager. If you want to learn more, visit the link:
https://github.com/coreos/prometheus-operator/blob/master/Documentation/design.md
In our demonstration, we will use PrometheusRule to define custom rules.
First, we need to use the stable / Prometheus Operator helm chart to install Prometheus Operator. Download the link:
https://github.com/helm/charts/tree/master/stable/prometheus-operator
The default installer will deploy the following components: Prometheus operator, Prometheus, alertmanager, node exporter, Kube state metrics, and grafana. By default, Prometheus will grab the main components of Kubernetes: Kube apiserver, Kube controller manager, and etcd.
Install Prometheus software
preparation in advance
To successfully execute this demo, you need to prepare the following:
-
A Google Cloud Platform account (free package). Any other cloud can
-
Rancher v2.3.5 (latest version at the time of article release)
-
Kubernetes cluster running on GKE (version 1.15.9-gke.12.) (it can also be used with EKS or AKS)
-
Install Helm binary on your computer
Start a Rancher instance
Just follow this always on Guide:
https://rancher.com/quick-start
Using Rancher to deploy a GKE cluster
Use Rancher to set up and configure your Kubernetes cluster:
https://rancher.com/docs/rancher/v2.x/en/cluster-provisioning/hosted-kubernetes-clusters/gke/
Once the deployment is complete and the proper credential and endpoint information is configured for the kubeconfig file, kubectl can be used to point to the specific cluster.
Deploy Prometheus software
First, check out the version of Helm we're running
$ helm version
version.BuildInfo{Version:"v3.1.2", GitCommit:"d878d4d45863e42fd5cff6743294a11d28a9abce", GitTreeState:"clean", GoVersion:"go1.13.8"}
When we use Helm 3, we need to add a stable image warehouse, because the warehouse will not be set by default.
$ helm repo add stable https://kubernetes-charts.storage.googleapis.com
"stable" has been added to your repositories
$ helm repo update
Hang tight while we grab the latest from your chart repositories...
...Successfully got an update from the "stable" chart repository
Update Complete. ⎈ Happy Helming!⎈
$ helm repo list
NAME    URL
stable  https://kubernetes-charts.storage.googleapis.com
After the Helm configuration is complete, we can start to install the Prometheus operator
$ kubectl create namespace monitoring
namespace/monitoring created
$ helm install --namespace monitoring demo stable/prometheus-operator
manifest_sorter.go:192: info: skipping unknown hook: "crd-install"
manifest_sorter.go:192: info: skipping unknown hook: "crd-install"
manifest_sorter.go:192: info: skipping unknown hook: "crd-install"
manifest_sorter.go:192: info: skipping unknown hook: "crd-install"
manifest_sorter.go:192: info: skipping unknown hook: "crd-install"
manifest_sorter.go:192: info: skipping unknown hook: "crd-install"
NAME: demo
LAST DEPLOYED: Sat Mar 14 09:40:35 2020
NAMESPACE: monitoring
STATUS: deployed
REVISION: 1
NOTES:
The Prometheus Operator has been installed. Check its status by running:
  kubectl --namespace monitoring get pods -l "release=demo"

Visit https://github.com/coreos/prometheus-operator for instructions on how
to create & configure Alertmanager and Prometheus instances using the Operator.
Rules
In addition to monitoring, Prometheus lets us create rules that trigger alarms. These rules are based on Prometheus' expression language. As long as the conditions are met, an alarm is triggered and sent to the Alertmanager. After that, we will see the specific form of the rules.
Let's go back to demo. After Helm completes the deployment, we can check what pod s have been created:
$ kubectl -n monitoring get pods
NAME                                                   READY   STATUS    RESTARTS   AGE
alertmanager-demo-prometheus-operator-alertmanager-0   2/2     Running   0          61s
demo-grafana-5576fbf669-9l57b                          3/3     Running   0          72s
demo-kube-state-metrics-67bf64b7f4-4786k               1/1     Running   0          72s
demo-prometheus-node-exporter-ll8zx                    1/1     Running   0          72s
demo-prometheus-node-exporter-nqnr6                    1/1     Running   0          72s
demo-prometheus-node-exporter-sdndf                    1/1     Running   0          72s
demo-prometheus-operator-operator-b9c9b5457-db9dj      2/2     Running   0          72s
prometheus-demo-prometheus-operator-prometheus-0       3/3     Running   1          50s
To access Prometheus and Alertmanager from a web browser, we need to use port forwarding.
Because the GCP instance is used in this example, and all kubectl commands are run from this instance, we use the external IP address of the instance to access resources.
$ kubectl port-forward --address 0.0.0.0 -n monitoring prometheus-demo-prometheus-operator-prometheus-0 9090 >/dev/null 2>&1 &
$ kubectl port-forward --address 0.0.0.0 -n monitoring alertmanager-demo-prometheus-operator-alertmanager-0 9093 >/dev/null 2>&1 &
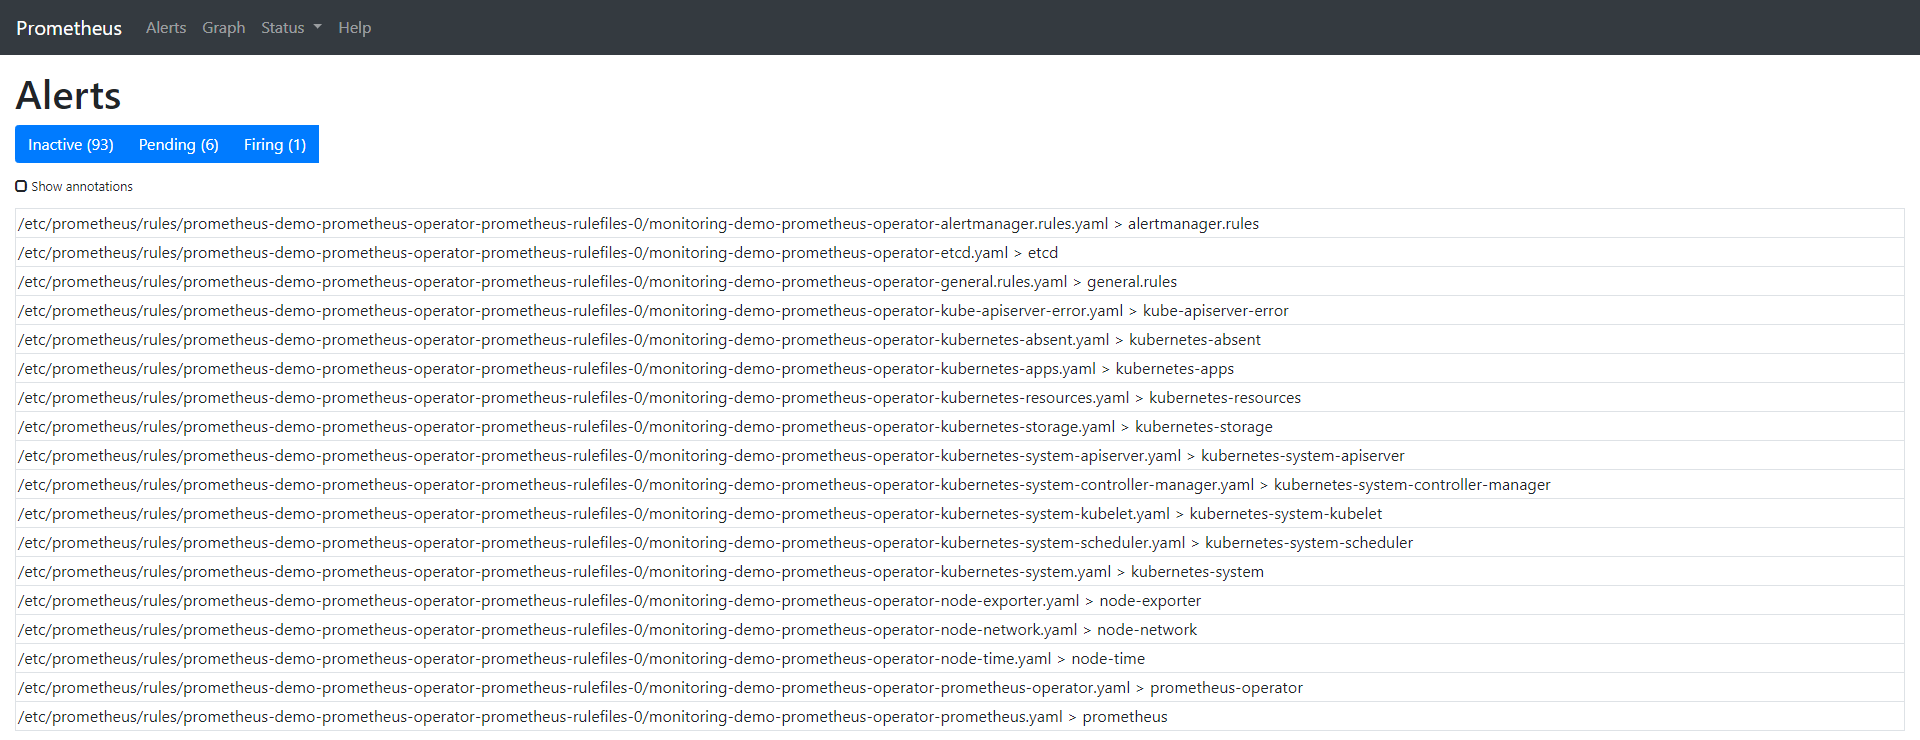
The Alert tab shows us all the alarms that are currently running / configured. You can also check from the CLI by querying the CRD named prometheusrules:
$ kubectl -n monitoring get prometheusrules
NAME                                                            AGE
demo-prometheus-operator-alertmanager.rules                     3m21s
demo-prometheus-operator-etcd                                   3m21s
demo-prometheus-operator-general.rules                          3m21s
demo-prometheus-operator-k8s.rules                              3m21s
demo-prometheus-operator-kube-apiserver-error                   3m21s
demo-prometheus-operator-kube-apiserver.rules                   3m21s
demo-prometheus-operator-kube-prometheus-node-recording.rules   3m21s
demo-prometheus-operator-kube-scheduler.rules                   3m21s
demo-prometheus-operator-kubernetes-absent                      3m21s
demo-prometheus-operator-kubernetes-apps                        3m21s
demo-prometheus-operator-kubernetes-resources                   3m21s
demo-prometheus-operator-kubernetes-storage                     3m21s
demo-prometheus-operator-kubernetes-system                      3m21s
demo-prometheus-operator-kubernetes-system-apiserver            3m21s
demo-prometheus-operator-kubernetes-system-controller-manager   3m21s
demo-prometheus-operator-kubernetes-system-kubelet              3m21s
demo-prometheus-operator-kubernetes-system-scheduler            3m21s
demo-prometheus-operator-node-exporter                          3m21s
demo-prometheus-operator-node-exporter.rules                    3m21s
demo-prometheus-operator-node-network                           3m21s
demo-prometheus-operator-node-time                              3m21s
demo-prometheus-operator-node.rules                             3m21s
demo-prometheus-operator-prometheus                             3m21s
demo-prometheus-operator-prometheus-operator                    3m21s
We can also check the physical files located in the prometheus operator pod in the prometheus container.
$ kubectl -n monitoring exec -it prometheus-demo-prometheus-operator-prometheus-0 -- /bin/sh
Defaulting container name to prometheus.
Use 'kubectl describe pod/prometheus-demo-prometheus-operator-prometheus-0 -n monitoring' to see all of the containers in this pod.
In the container, we can check the storage path of the rule:
/prometheus $ ls /etc/prometheus/rules/prometheus-demo-prometheus-operator-prometheus-rulefiles-0/
monitoring-demo-prometheus-operator-alertmanager.rules.yaml                    monitoring-demo-prometheus-operator-kubernetes-system-apiserver.yaml
monitoring-demo-prometheus-operator-etcd.yaml                                  monitoring-demo-prometheus-operator-kubernetes-system-controller-manager.yaml
monitoring-demo-prometheus-operator-general.rules.yaml                         monitoring-demo-prometheus-operator-kubernetes-system-kubelet.yaml
monitoring-demo-prometheus-operator-k8s.rules.yaml                             monitoring-demo-prometheus-operator-kubernetes-system-scheduler.yaml
monitoring-demo-prometheus-operator-kube-apiserver-error.yaml                  monitoring-demo-prometheus-operator-kubernetes-system.yaml
monitoring-demo-prometheus-operator-kube-apiserver.rules.yaml                  monitoring-demo-prometheus-operator-node-exporter.rules.yaml
monitoring-demo-prometheus-operator-kube-prometheus-node-recording.rules.yaml  monitoring-demo-prometheus-operator-node-exporter.yaml
monitoring-demo-prometheus-operator-kube-scheduler.rules.yaml                  monitoring-demo-prometheus-operator-node-network.yaml
monitoring-demo-prometheus-operator-kubernetes-absent.yaml                     monitoring-demo-prometheus-operator-node-time.yaml
monitoring-demo-prometheus-operator-kubernetes-apps.yaml                       monitoring-demo-prometheus-operator-node.rules.yaml
monitoring-demo-prometheus-operator-kubernetes-resources.yaml                  monitoring-demo-prometheus-operator-prometheus-operator.yaml
monitoring-demo-prometheus-operator-kubernetes-storage.yaml                    monitoring-demo-prometheus-operator-prometheus.yaml
To learn more about how to load these rules into Prometheus, check the details of the Pod. We can see that the configuration file for the Prometheus container is etc/prometheus/config_out/prometheus.env.yaml. This configuration file shows us the location of the file or rechecks the frequency setting of yaml.
$ kubectl -n monitoring describe pod prometheus-demo-prometheus-operator-prometheus-0
The complete command output is as follows:
Name:           prometheus-demo-prometheus-operator-prometheus-0
Namespace:      monitoring
Priority:       0
Node:           gke-c-7dkls-default-0-c6ca178a-gmcq/10.132.0.15
Start Time:     Wed, 11 Mar 2020 18:06:47 +0000
Labels:         app=prometheus
                controller-revision-hash=prometheus-demo-prometheus-operator-prometheus-5ccbbd8578
                prometheus=demo-prometheus-operator-prometheus
                statefulset.kubernetes.io/pod-name=prometheus-demo-prometheus-operator-prometheus-0
Annotations:    <none>
Status:         Running
IP:             10.40.0.7
IPs:            <none>
Controlled By:  StatefulSet/prometheus-demo-prometheus-operator-prometheus
Containers:
  prometheus:
    Container ID:  docker://360db8a9f1cce8d72edd81fcdf8c03fe75992e6c2c59198b89807aa0ce03454c
    Image:         quay.io/prometheus/prometheus:v2.15.2
    Image ID:      docker-pullable://quay.io/prometheus/prometheus@sha256:914525123cf76a15a6aaeac069fcb445ce8fb125113d1bc5b15854bc1e8b6353
    Port:          9090/TCP
    Host Port:     0/TCP
    Args:
      --web.console.templates=/etc/prometheus/consoles
      --web.console.libraries=/etc/prometheus/console_libraries
      --config.file=/etc/prometheus/config_out/prometheus.env.yaml
      --storage.tsdb.path=/prometheus
      --storage.tsdb.retention.time=10d
      --web.enable-lifecycle
      --storage.tsdb.no-lockfile
      --web.external-url=http://demo-prometheus-operator-prometheus.monitoring:9090
      --web.route-prefix=/
    State:       Running
      Started:   Wed, 11 Mar 2020 18:07:07 +0000
    Last State:  Terminated
      Reason:    Error
      Message:    caller=main.go:648 msg="Starting TSDB ..."
level=info ts=2020-03-11T18:07:02.185Z caller=web.go:506 component=web msg="Start listening for connections" address=0.0.0.0:9090
level=info ts=2020-03-11T18:07:02.192Z caller=head.go:584 component=tsdb msg="replaying WAL, this may take awhile"
level=info ts=2020-03-11T18:07:02.192Z caller=head.go:632 component=tsdb msg="WAL segment loaded" segment=0 maxSegment=0
level=info ts=2020-03-11T18:07:02.194Z caller=main.go:663 fs_type=EXT4_SUPER_MAGIC
level=info ts=2020-03-11T18:07:02.194Z caller=main.go:664 msg="TSDB started"
level=info ts=2020-03-11T18:07:02.194Z caller=main.go:734 msg="Loading configuration file" filename=/etc/prometheus/config_out/prometheus.env.yaml
level=info ts=2020-03-11T18:07:02.194Z caller=main.go:517 msg="Stopping scrape discovery manager..."
level=info ts=2020-03-11T18:07:02.194Z caller=main.go:531 msg="Stopping notify discovery manager..."
level=info ts=2020-03-11T18:07:02.194Z caller=main.go:553 msg="Stopping scrape manager..."
level=info ts=2020-03-11T18:07:02.194Z caller=manager.go:814 component="rule manager" msg="Stopping rule manager..."
level=info ts=2020-03-11T18:07:02.194Z caller=manager.go:820 component="rule manager" msg="Rule manager stopped"
level=info ts=2020-03-11T18:07:02.194Z caller=main.go:513 msg="Scrape discovery manager stopped"
level=info ts=2020-03-11T18:07:02.194Z caller=main.go:527 msg="Notify discovery manager stopped"
level=info ts=2020-03-11T18:07:02.194Z caller=main.go:547 msg="Scrape manager stopped"
level=info ts=2020-03-11T18:07:02.197Z caller=notifier.go:598 component=notifier msg="Stopping notification manager..."
level=info ts=2020-03-11T18:07:02.197Z caller=main.go:718 msg="Notifier manager stopped"
level=error ts=2020-03-11T18:07:02.197Z caller=main.go:727 err="error loading config from \"/etc/prometheus/config_out/prometheus.env.yaml\": couldn't load configuration (--config.file=\"/etc/prometheus/config_out/prometheus.env.yaml\"): open /etc/prometheus/config_out/prometheus.env.yaml: no such file or directory"

      Exit Code:    1
      Started:      Wed, 11 Mar 2020 18:07:02 +0000
      Finished:     Wed, 11 Mar 2020 18:07:02 +0000
    Ready:          True
    Restart Count:  1
    Liveness:       http-get http://:web/-/healthy delay=0s timeout=3s period=5s #success=1 #failure=6
    Readiness:      http-get http://:web/-/ready delay=0s timeout=3s period=5s #success=1 #failure=120
    Environment:    <none>
    Mounts:
      /etc/prometheus/certs from tls-assets (ro)
      /etc/prometheus/config_out from config-out (ro)
      /etc/prometheus/rules/prometheus-demo-prometheus-operator-prometheus-rulefiles-0 from prometheus-demo-prometheus-operator-prometheus-rulefiles-0 (rw)
      /prometheus from prometheus-demo-prometheus-operator-prometheus-db (rw)
      /var/run/secrets/kubernetes.io/serviceaccount from demo-prometheus-operator-prometheus-token-jvbrr (ro)
  prometheus-config-reloader:
    Container ID:  docker://de27cdad7067ebd5154c61b918401b2544299c161850daf3e317311d2d17af3d
    Image:         quay.io/coreos/prometheus-config-reloader:v0.37.0
    Image ID:      docker-pullable://quay.io/coreos/prometheus-config-reloader@sha256:5e870e7a99d55a5ccf086063efd3263445a63732bc4c04b05cf8b664f4d0246e
    Port:          <none>
    Host Port:     <none>
    Command:
      /bin/prometheus-config-reloader
    Args:
      --log-format=logfmt
      --reload-url=http://127.0.0.1:9090/-/reload
      --config-file=/etc/prometheus/config/prometheus.yaml.gz
      --config-envsubst-file=/etc/prometheus/config_out/prometheus.env.yaml
    State:          Running
      Started:      Wed, 11 Mar 2020 18:07:04 +0000
    Ready:          True
    Restart Count:  0
    Limits:
      cpu:     100m
      memory:  25Mi
    Requests:
      cpu:     100m
      memory:  25Mi
    Environment:
      POD_NAME:  prometheus-demo-prometheus-operator-prometheus-0 (v1:metadata.name)
    Mounts:
      /etc/prometheus/config from config (rw)
      /etc/prometheus/config_out from config-out (rw)
      /var/run/secrets/kubernetes.io/serviceaccount from demo-prometheus-operator-prometheus-token-jvbrr (ro)
  rules-configmap-reloader:
    Container ID:  docker://5804e45380ed1b5374a4c2c9ee4c9c4e365bee93b9ccd8b5a21f50886ea81a91
    Image:         quay.io/coreos/configmap-reload:v0.0.1
    Image ID:      docker-pullable://quay.io/coreos/configmap-reload@sha256:e2fd60ff0ae4500a75b80ebaa30e0e7deba9ad107833e8ca53f0047c42c5a057
    Port:          <none>
    Host Port:     <none>
    Args:
      --webhook-url=http://127.0.0.1:9090/-/reload
      --volume-dir=/etc/prometheus/rules/prometheus-demo-prometheus-operator-prometheus-rulefiles-0
    State:          Running
      Started:      Wed, 11 Mar 2020 18:07:06 +0000
    Ready:          True
    Restart Count:  0
    Limits:
      cpu:     100m
      memory:  25Mi
    Requests:
      cpu:        100m
      memory:     25Mi
    Environment:  <none>
    Mounts:
      /etc/prometheus/rules/prometheus-demo-prometheus-operator-prometheus-rulefiles-0 from prometheus-demo-prometheus-operator-prometheus-rulefiles-0 (rw)
      /var/run/secrets/kubernetes.io/serviceaccount from demo-prometheus-operator-prometheus-token-jvbrr (ro)
Conditions:
  Type              Status
  Initialized       True
  Ready             True
  ContainersReady   True
  PodScheduled      True
Volumes:
  config:
    Type:        Secret (a volume populated by a Secret)
    SecretName:  prometheus-demo-prometheus-operator-prometheus
    Optional:    false
  tls-assets:
    Type:        Secret (a volume populated by a Secret)
    SecretName:  prometheus-demo-prometheus-operator-prometheus-tls-assets
    Optional:    false
  config-out:
    Type:       EmptyDir (a temporary directory that shares a pod's lifetime)
    Medium:
    SizeLimit:  <unset>
  prometheus-demo-prometheus-operator-prometheus-rulefiles-0:
    Type:      ConfigMap (a volume populated by a ConfigMap)
    Name:      prometheus-demo-prometheus-operator-prometheus-rulefiles-0
    Optional:  false
  prometheus-demo-prometheus-operator-prometheus-db:
    Type:       EmptyDir (a temporary directory that shares a pod's lifetime)
    Medium:
    SizeLimit:  <unset>
  demo-prometheus-operator-prometheus-token-jvbrr:
    Type:        Secret (a volume populated by a Secret)
    SecretName:  demo-prometheus-operator-prometheus-token-jvbrr
    Optional:    false
QoS Class:       Burstable
Node-Selectors:  <none>
Tolerations:     node.kubernetes.io/not-ready:NoExecute for 300s
                 node.kubernetes.io/unreachable:NoExecute for 300s
Events:
  Type    Reason     Age                    From                                          Message
  ----    ------     ----                   ----                                          -------
  Normal  Scheduled  4m51s                  default-scheduler                             Successfully assigned monitoring/prometheus-demo-prometheus-operator-prometheus-0 to gke-c-7dkls-default-0-c6ca178a-gmcq
  Normal  Pulling    4m45s                  kubelet, gke-c-7dkls-default-0-c6ca178a-gmcq  Pulling image "quay.io/prometheus/prometheus:v2.15.2"
  Normal  Pulled     4m39s                  kubelet, gke-c-7dkls-default-0-c6ca178a-gmcq  Successfully pulled image "quay.io/prometheus/prometheus:v2.15.2"
  Normal  Pulling    4m36s                  kubelet, gke-c-7dkls-default-0-c6ca178a-gmcq  Pulling image "quay.io/coreos/prometheus-config-reloader:v0.37.0"
  Normal  Pulled     4m35s                  kubelet, gke-c-7dkls-default-0-c6ca178a-gmcq  Successfully pulled image "quay.io/coreos/prometheus-config-reloader:v0.37.0"
  Normal  Pulling    4m34s                  kubelet, gke-c-7dkls-default-0-c6ca178a-gmcq  Pulling image "quay.io/coreos/configmap-reload:v0.0.1"
  Normal  Started    4m34s                  kubelet, gke-c-7dkls-default-0-c6ca178a-gmcq  Started container prometheus-config-reloader
  Normal  Created    4m34s                  kubelet, gke-c-7dkls-default-0-c6ca178a-gmcq  Created container prometheus-config-reloader
  Normal  Pulled     4m33s                  kubelet, gke-c-7dkls-default-0-c6ca178a-gmcq  Successfully pulled image "quay.io/coreos/configmap-reload:v0.0.1"
  Normal  Created    4m32s (x2 over 4m36s)  kubelet, gke-c-7dkls-default-0-c6ca178a-gmcq  Created container prometheus
  Normal  Created    4m32s                  kubelet, gke-c-7dkls-default-0-c6ca178a-gmcq  Created container rules-configmap-reloader
  Normal  Started    4m32s                  kubelet, gke-c-7dkls-default-0-c6ca178a-gmcq  Started container rules-configmap-reloader
  Normal  Pulled     4m32s                  kubelet, gke-c-7dkls-default-0-c6ca178a-gmcq  Container image "quay.io/prometheus/prometheus:v2.15.2" already present on machine
  Normal  Started    4m31s (x2 over 4m36s)  kubelet, gke-c-7dkls-default-0-c6ca178a-gmcq  Started container prometheus
Let's clean up the default rules so we can have a better look at the one we are going to create. The following command deletes all rules, but leaves monitoring-demo-prometheus-operator-alertmanager.rules.
$ kubectl -n monitoring delete prometheusrules $(kubectl -n monitoring get prometheusrules | grep -v alert)
$ kubectl -n monitoring get prometheusrules
NAME                                          AGE
demo-prometheus-operator-alertmanager.rules   8m53s
Note that we only keep one rule to make the demo easier. But there's a rule that you can't delete. It's in monitoring-demo-prometheus-operator-general.rules.yaml, called watchdog. The alarm is always in the trigger state, the purpose of which is to ensure the normal operation of the whole alarm pipeline.
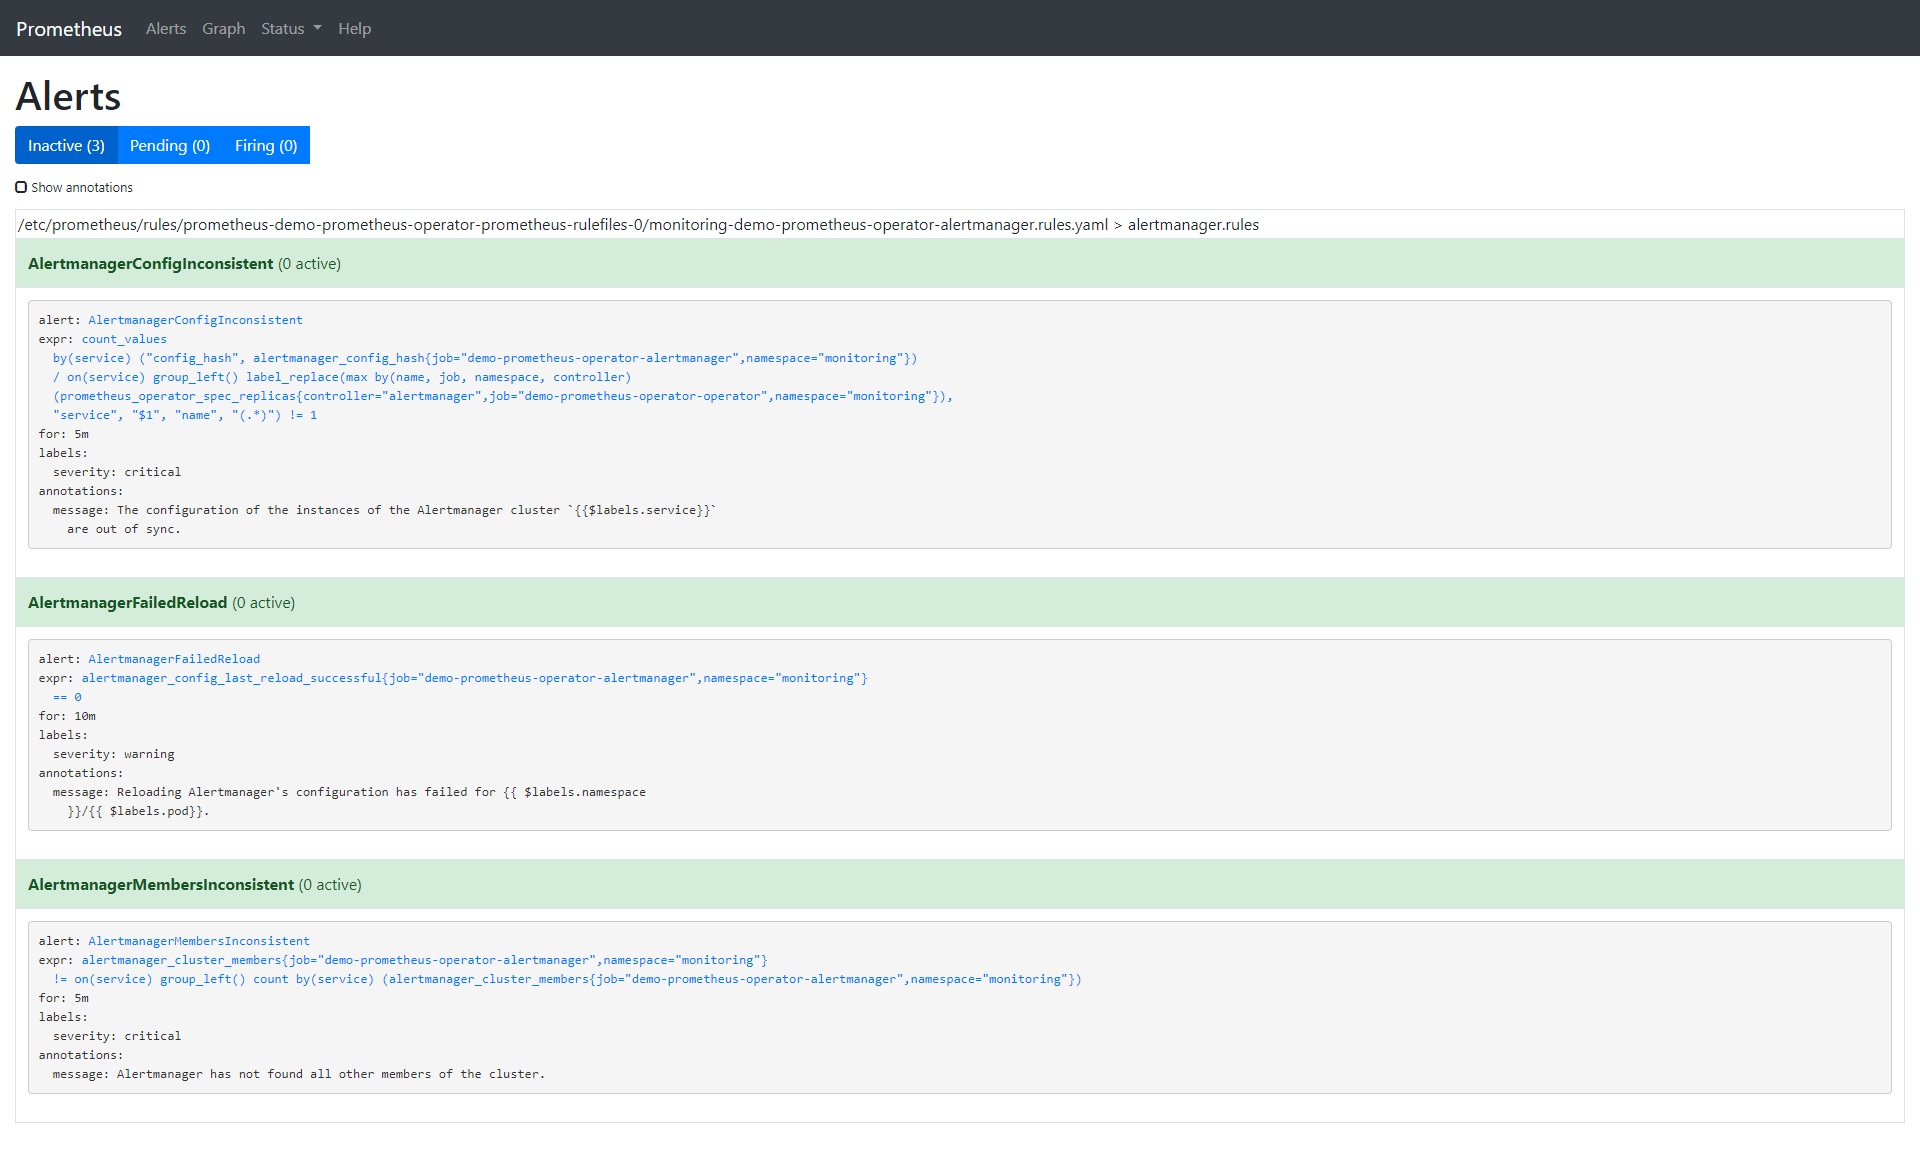
Let's examine the rules we left behind from the CLI and compare them with what we'll see in the browser.
$ kubectl -n monitoring describe prometheusrule demo-prometheus-operator-alertmanager.rules
Name:         demo-prometheus-operator-alertmanager.rules
Namespace:    monitoring
Labels:       app=prometheus-operator
              chart=prometheus-operator-8.12.1
              heritage=Tiller
              release=demo
Annotations:  prometheus-operator-validated: true
API Version:  monitoring.coreos.com/v1
Kind:         PrometheusRule
Metadata:
  Creation Timestamp:  2020-03-11T18:06:25Z
  Generation:          1
  Resource Version:    4871
  Self Link:           /apis/monitoring.coreos.com/v1/namespaces/monitoring/prometheusrules/demo-prometheus-operator-alertmanager.rules
  UID:                 6a84dbb0-feba-4f17-b3dc-4b6486818bc0
Spec:
  Groups:
    Name:  alertmanager.rules
    Rules:
      Alert:  AlertmanagerConfigInconsistent
      Annotations:
        Message:  The configuration of the instances of the Alertmanager cluster `{{$labels.service}}` are out of sync.
      Expr:       count_values("config_hash", alertmanager_config_hash{job="demo-prometheus-operator-alertmanager",namespace="monitoring"}) BY (service) / ON(service) GROUP_LEFT() label_replace(max(prometheus_operator_spec_replicas{job="demo-prometheus-operator-operator",namespace="monitoring",controller="alertmanager"}) by (name, job, namespace, controller), "service", "$1", "name", "(.*)") != 1
      For:        5m
      Labels:
        Severity:  critical
      Alert:       AlertmanagerFailedReload
      Annotations:
        Message:  Reloading Alertmanager's configuration has failed for {{ $labels.namespace }}/{{ $labels.pod}}.
      Expr:       alertmanager_config_last_reload_successful{job="demo-prometheus-operator-alertmanager",namespace="monitoring"} == 0
      For:        10m
      Labels:
        Severity:  warning
      Alert:       AlertmanagerMembersInconsistent
      Annotations:
        Message:  Alertmanager has not found all other members of the cluster.
      Expr:       alertmanager_cluster_members{job="demo-prometheus-operator-alertmanager",namespace="monitoring"}
  != on (service) GROUP_LEFT()
count by (service) (alertmanager_cluster_members{job="demo-prometheus-operator-alertmanager",namespace="monitoring"})
      For:  5m
      Labels:
        Severity:  critical
Events:            <none>
Let's remove all default alarms and create one of our own:
$ kubectl -n monitoring edit prometheusrules demo-prometheus-operator-alertmanager.rules
prometheusrule.monitoring.coreos.com/demo-prometheus-operator-alertmanager.rules edited
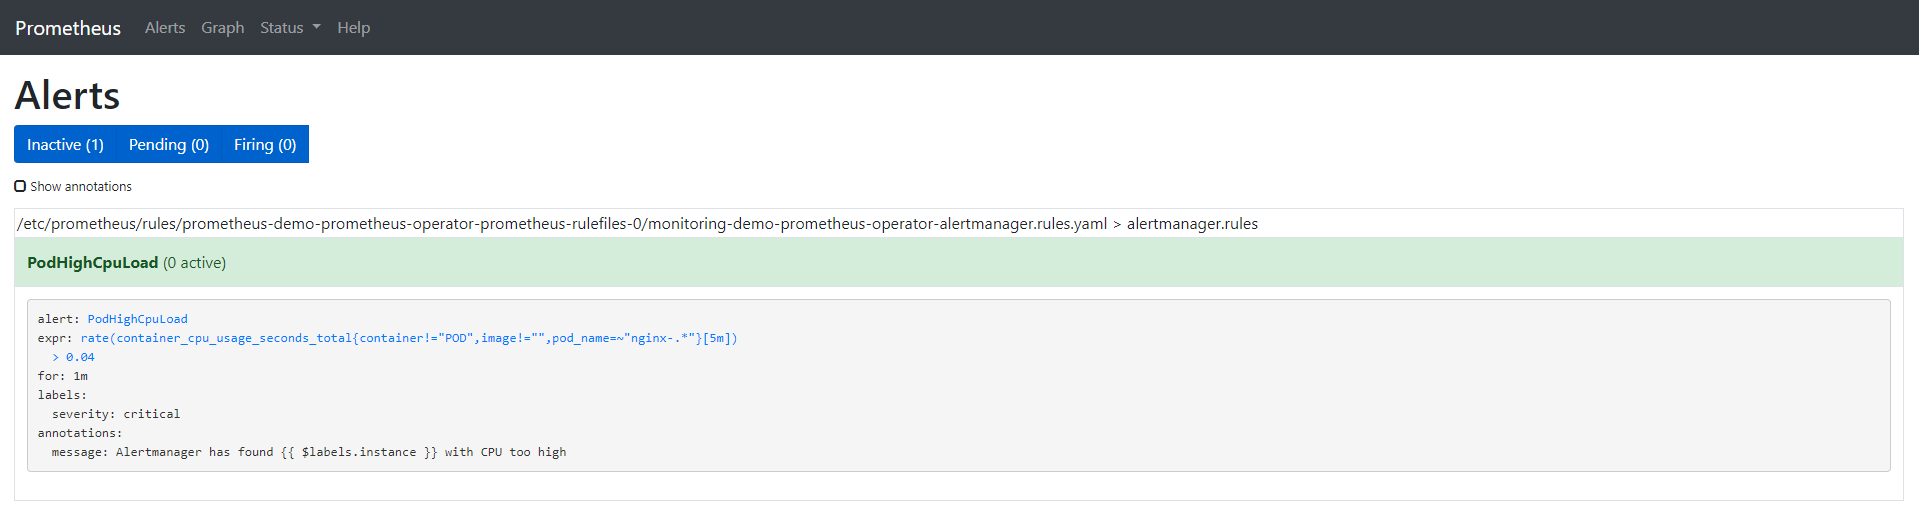
Our custom alarms are as follows:
$ kubectl -n monitoring describe prometheusrule demo-prometheus-operator-alertmanager.rules
Name:         demo-prometheus-operator-alertmanager.rules
Namespace:    monitoring
Labels:       app=prometheus-operator
              chart=prometheus-operator-8.12.1
              heritage=Tiller
              release=demo
Annotations:  prometheus-operator-validated: true
API Version:  monitoring.coreos.com/v1
Kind:         PrometheusRule
Metadata:
  Creation Timestamp:  2020-03-11T18:06:25Z
  Generation:          3
  Resource Version:    18180
  Self Link:           /apis/monitoring.coreos.com/v1/namespaces/monitoring/prometheusrules/demo-prometheus-operator-alertmanager.rules
  UID:                 6a84dbb0-feba-4f17-b3dc-4b6486818bc0
Spec:
  Groups:
    Name:  alertmanager.rules
    Rules:
      Alert:  PodHighCpuLoad
      Annotations:
        Message:  Alertmanager has found {{ $labels.instance }} with CPU too high
      Expr:       rate (container_cpu_usage_seconds_total{pod_name=~"nginx-.*", image!="", container!="POD"}[5m])  > 0.04
      For:        1m
      Labels:
        Severity:  critical
Events:            <none>
Here are the options for the alarms we created:
-
annotation: a set of information labels describing alarms.
-
expr: expression written by PromQL
-
for: optional parameter. After setting, it will tell Prometheus whether the alarm is active in the defined time period. The alarm will only be triggered after this defined time.
-
Label: additional label that can be attached to the alarm. If you want to learn more about alarms, visit: https://prometheus.io/docs/prometheus/latest/configuration/alerting_rules/
Now that we have finished setting up Prometheus alarm, let's configure Alertmanager so that we can get alarm notification by email. The configuration of Alertmanager is in the Kubernetes secret object.
$ kubectl get secrets -n monitoring
NAME                                                        TYPE                                  DATA   AGE
alertmanager-demo-prometheus-operator-alertmanager          Opaque                                1      32m
default-token-x4rgq                                         kubernetes.io/service-account-token   3      37m
demo-grafana                                                Opaque                                3      32m
demo-grafana-test-token-p6qnk                               kubernetes.io/service-account-token   3      32m
demo-grafana-token-ff6nl                                    kubernetes.io/service-account-token   3      32m
demo-kube-state-metrics-token-vmvbr                         kubernetes.io/service-account-token   3      32m
demo-prometheus-node-exporter-token-wlnk9                   kubernetes.io/service-account-token   3      32m
demo-prometheus-operator-admission                          Opaque                                3      32m
demo-prometheus-operator-alertmanager-token-rrx4k           kubernetes.io/service-account-token   3      32m
demo-prometheus-operator-operator-token-q9744               kubernetes.io/service-account-token   3      32m
demo-prometheus-operator-prometheus-token-jvbrr             kubernetes.io/service-account-token   3      32m
prometheus-demo-prometheus-operator-prometheus              Opaque                                1      31m
prometheus-demo-prometheus-operator-prometheus-tls-assets   Opaque                                0      31m
We are only interested in alertmanager demo Prometheus operator alertmanager. Let's look at:
kubectl -n monitoring get secret alertmanager-demo-prometheus-operator-alertmanager -o yaml
apiVersion: v1
data:
  alertmanager.yaml: Z2xvYmFsOgogIHJlc29sdmVfdGltZW91dDogNW0KcmVjZWl2ZXJzOgotIG5hbWU6ICJudWxsIgpyb3V0ZToKICBncm91cF9ieToKICAtIGpvYgogIGdyb3VwX2ludGVydmFsOiA1bQogIGdyb3VwX3dhaXQ6IDMwcwogIHJlY2VpdmVyOiAibnVsbCIKICByZXBlYXRfaW50ZXJ2YWw6IDEyaAogIHJvdXRlczoKICAtIG1hdGNoOgogICAgICBhbGVydG5hbWU6IFdhdGNoZG9nCiAgICByZWNlaXZlcjogIm51bGwiCg==
kind: Secret
metadata:
  creationTimestamp: "2020-03-11T18:06:24Z"
  labels:
    app: prometheus-operator-alertmanager
    chart: prometheus-operator-8.12.1
    heritage: Tiller
    release: demo
  name: alertmanager-demo-prometheus-operator-alertmanager
  namespace: monitoring
  resourceVersion: "3018"
  selfLink: /api/v1/namespaces/monitoring/secrets/alertmanager-demo-prometheus-operator-alertmanager
  uid: 6baf6883-f690-47a1-bb49-491935956c22
type: Opaque
The alertmanager.yaml field is encoded by base64. Let's look at:
$ echo 'Z2xvYmFsOgogIHJlc29sdmVfdGltZW91dDogNW0KcmVjZWl2ZXJzOgotIG5hbWU6ICJudWxsIgpyb3V0ZToKICBncm91cF9ieToKICAtIGpvYgogIGdyb3VwX2ludGVydmFsOiA1bQogIGdyb3VwX3dhaXQ6IDMwcwogIHJlY2VpdmVyOiAibnVsbCIKICByZXBlYXRfaW50ZXJ2YWw6IDEyaAogIHJvdXRlczoKICAtIG1hdGNoOgogICAgICBhbGVydG5hbWU6IFdhdGNoZG9nCiAgICByZWNlaXZlcjogIm51bGwiCg==' | base64 --decode
global:
  resolve_timeout: 5m
receivers:
- name: "null"
route:
  group_by:
  - job
  group_interval: 5m
  group_wait: 30s
  receiver: "null"
  repeat_interval: 12h
  routes:
  - match:
      alertname: Watchdog
    receiver: "null"
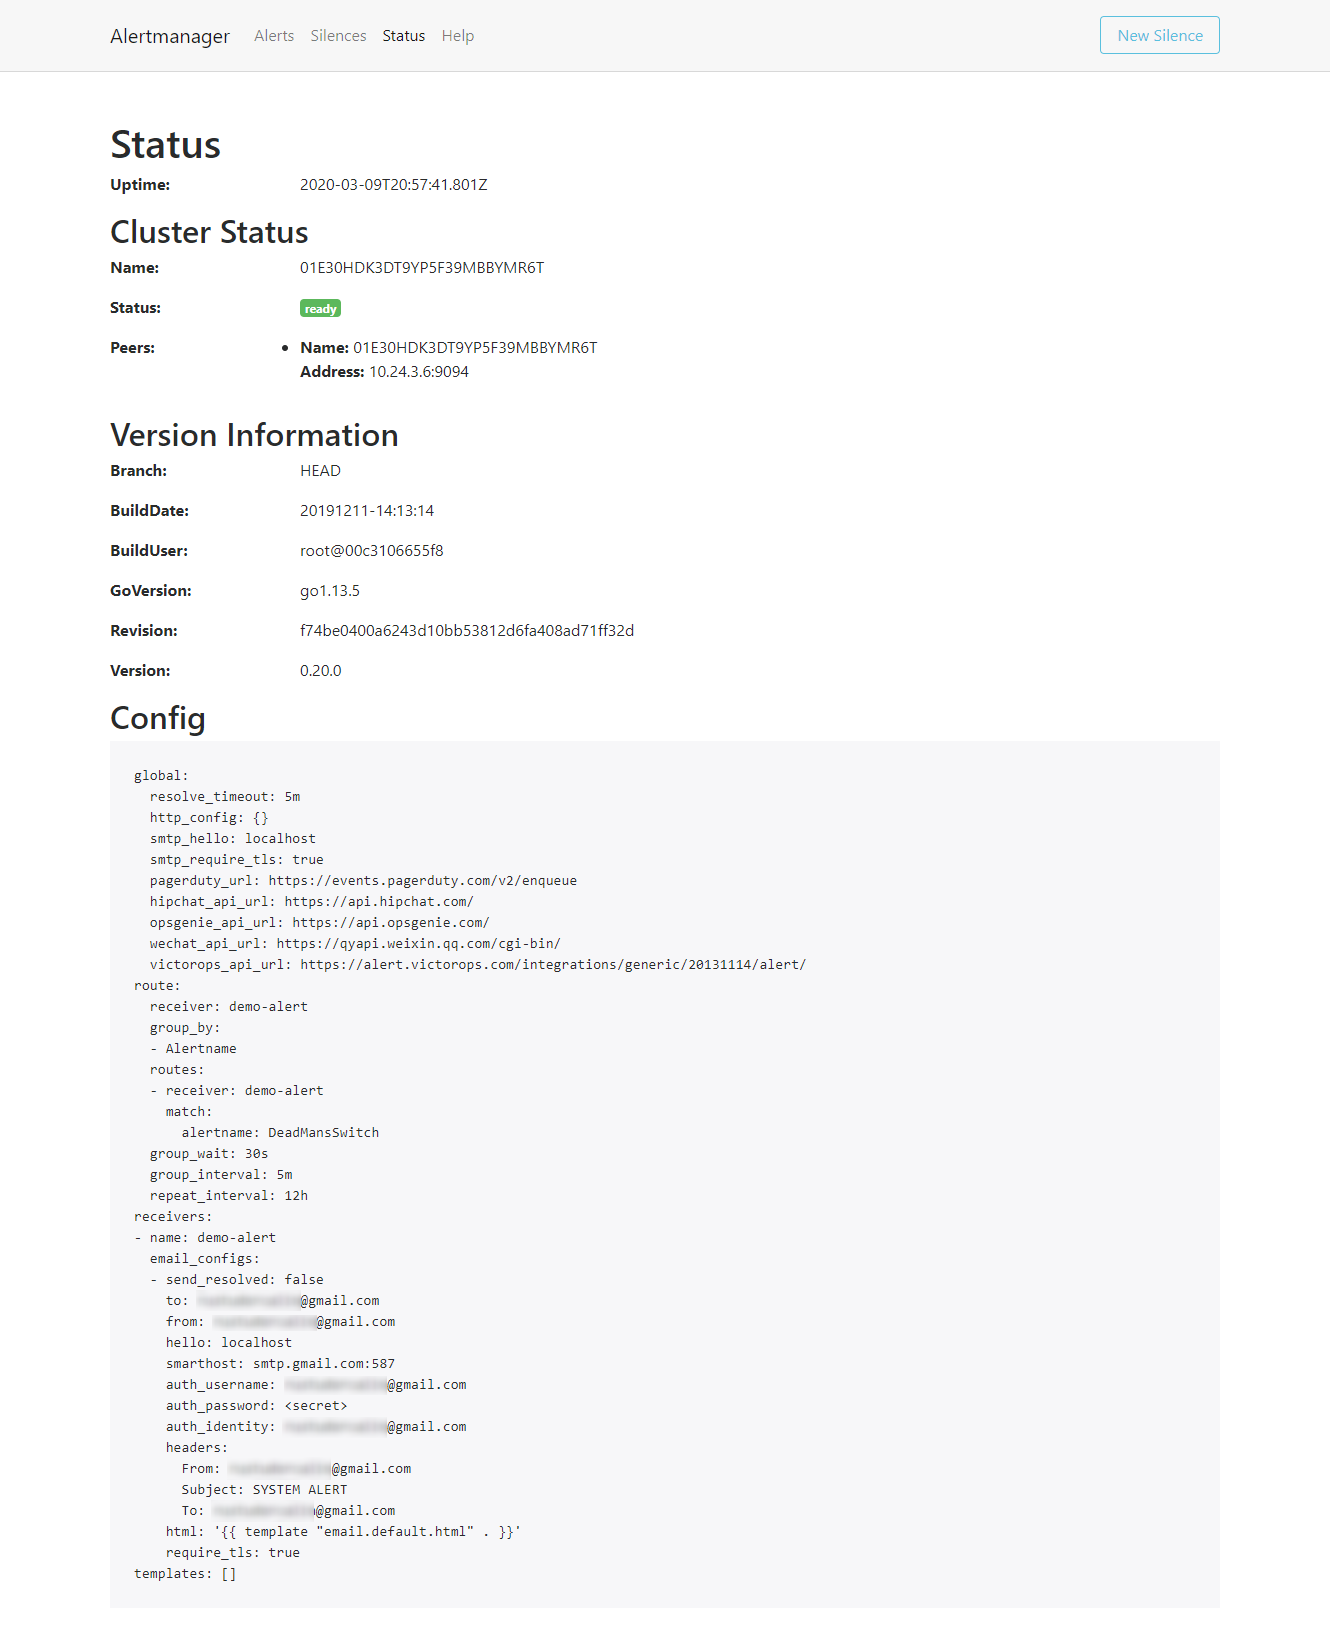
As we can see, this is the default alert manager configuration. You can also view this configuration in the Status tab of the Alertmanager UI. Next, let's make some changes to it -- in this case, to send an email:
$ cat alertmanager.yaml
global:
  resolve_timeout: 5m
route:
  group_by: [Alertname]
  # Send all notifications to me.
  receiver: demo-alert
  group_wait: 30s
  group_interval: 5m
  repeat_interval: 12h
  routes:
  - match:
      alertname: DemoAlertName
    receiver: 'demo-alert'

receivers:
- name: demo-alert
  email_configs:
  - to: your_email@gmail.com
    from: from_email@gmail.com
    # Your smtp server address
    smarthost: smtp.gmail.com:587
    auth_username: from_email@gmail.com
    auth_identity: from_email@gmail.com
    auth_password: 16letter_generated token # you can use gmail account password, but better create a dedicated token for this
    headers:
      From: from_email@gmail.com
      Subject: 'Demo ALERT'
First, we need to code this:
$ cat alertmanager.yaml | base64 -w0
After we get the encoded output, we need to fill it in the yaml file we are going to apply:
cat alertmanager-secret-k8s.yaml
apiVersion: v1
data:
  alertmanager.yaml: <paste here de encoded content of alertmanager.yaml>
kind: Secret
metadata:
  name: alertmanager-demo-prometheus-operator-alertmanager
  namespace: monitoring
type: Opaque
$ kubectl apply -f alertmanager-secret-k8s.yaml
Warning: kubectl apply should be used on resource created by either kubectl create --save-config or kubectl apply
secret/alertmanager-demo-prometheus-operator-alertmanager configured
The configuration will automatically reload and display changes in the UI.
Next, we deploy something to monitor it. For this example, a simple nginx deployment is enough:
$ cat nginx-deployment.yaml
apiVersion: apps/v1 # for versions before 1.9.0 use apps/v1beta2
kind: Deployment
metadata:
  name: nginx-deployment
spec:
  selector:
    matchLabels:
      app: nginx
  replicas: 3 # tells deployment to run 2 pods matching the template
  template:
    metadata:
      labels:
        app: nginx
    spec:
      containers:
      - name: nginx
        image: nginx:1.7.9
        ports:
        - containerPort: 80
$ kubectl apply -f nginx-deployment.yaml
deployment.apps/nginx-deployment created
According to the configuration yaml, we have three copies:
$ kubectl get pods
NAME                                READY   STATUS    RESTARTS   AGE
nginx-deployment-5754944d6c-7g6gq   1/1     Running   0          67s
nginx-deployment-5754944d6c-lhvx8   1/1     Running   0          67s
nginx-deployment-5754944d6c-whhtr   1/1     Running   0          67s
In Prometheus UI, use the same expression we configured for alarms:
rate (container_cpu_usage_seconds_total{pod_name=~"nginx-.*", image!="", container!="POD"}[5m])
We can check the data for these pods, all of which should have a value of 0.

Let's add some load to one pod, and then look at the change of the value. When the value is greater than 0.04, we should receive an alarm:
$  kubectl exec -it nginx-deployment-5754944d6c-7g6gq -- /bin/sh
# yes > /dev/null
The alarm has three stages:
-
Inactive: the alarm triggering conditions are not met
-
Pending: condition satisfied
-
Firing: trigger alarm
We have seen that the alarm is in the inactive state, so add some load on the CPU to observe the remaining two states:
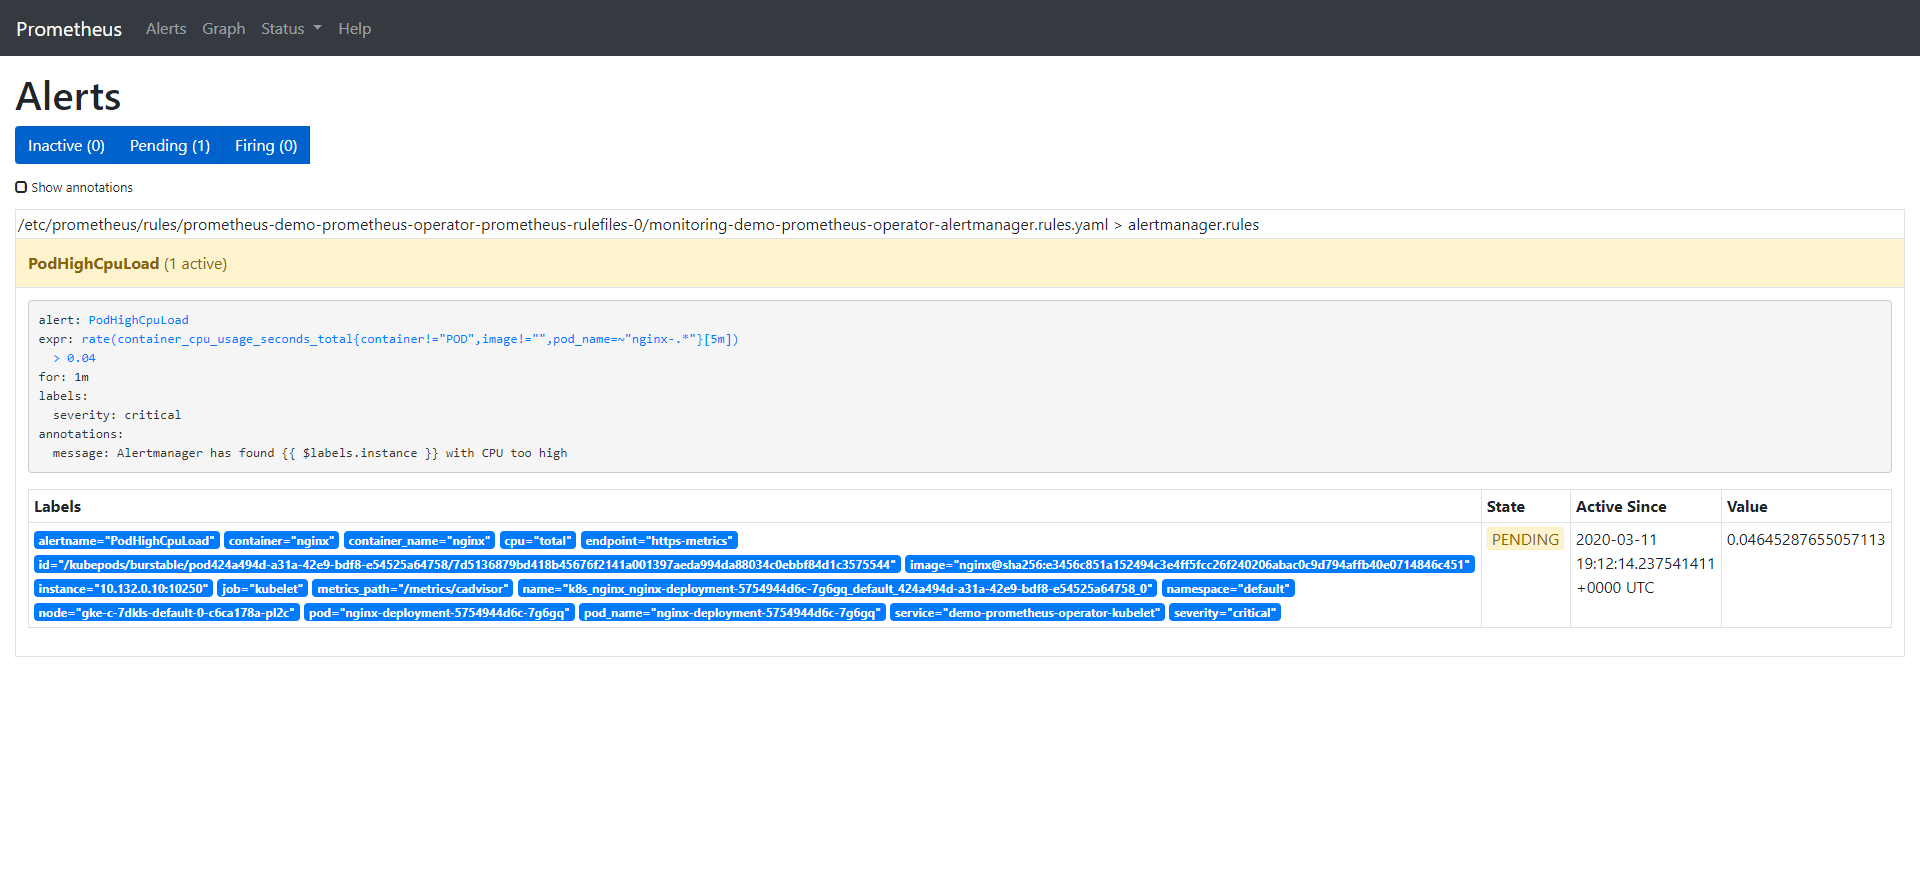

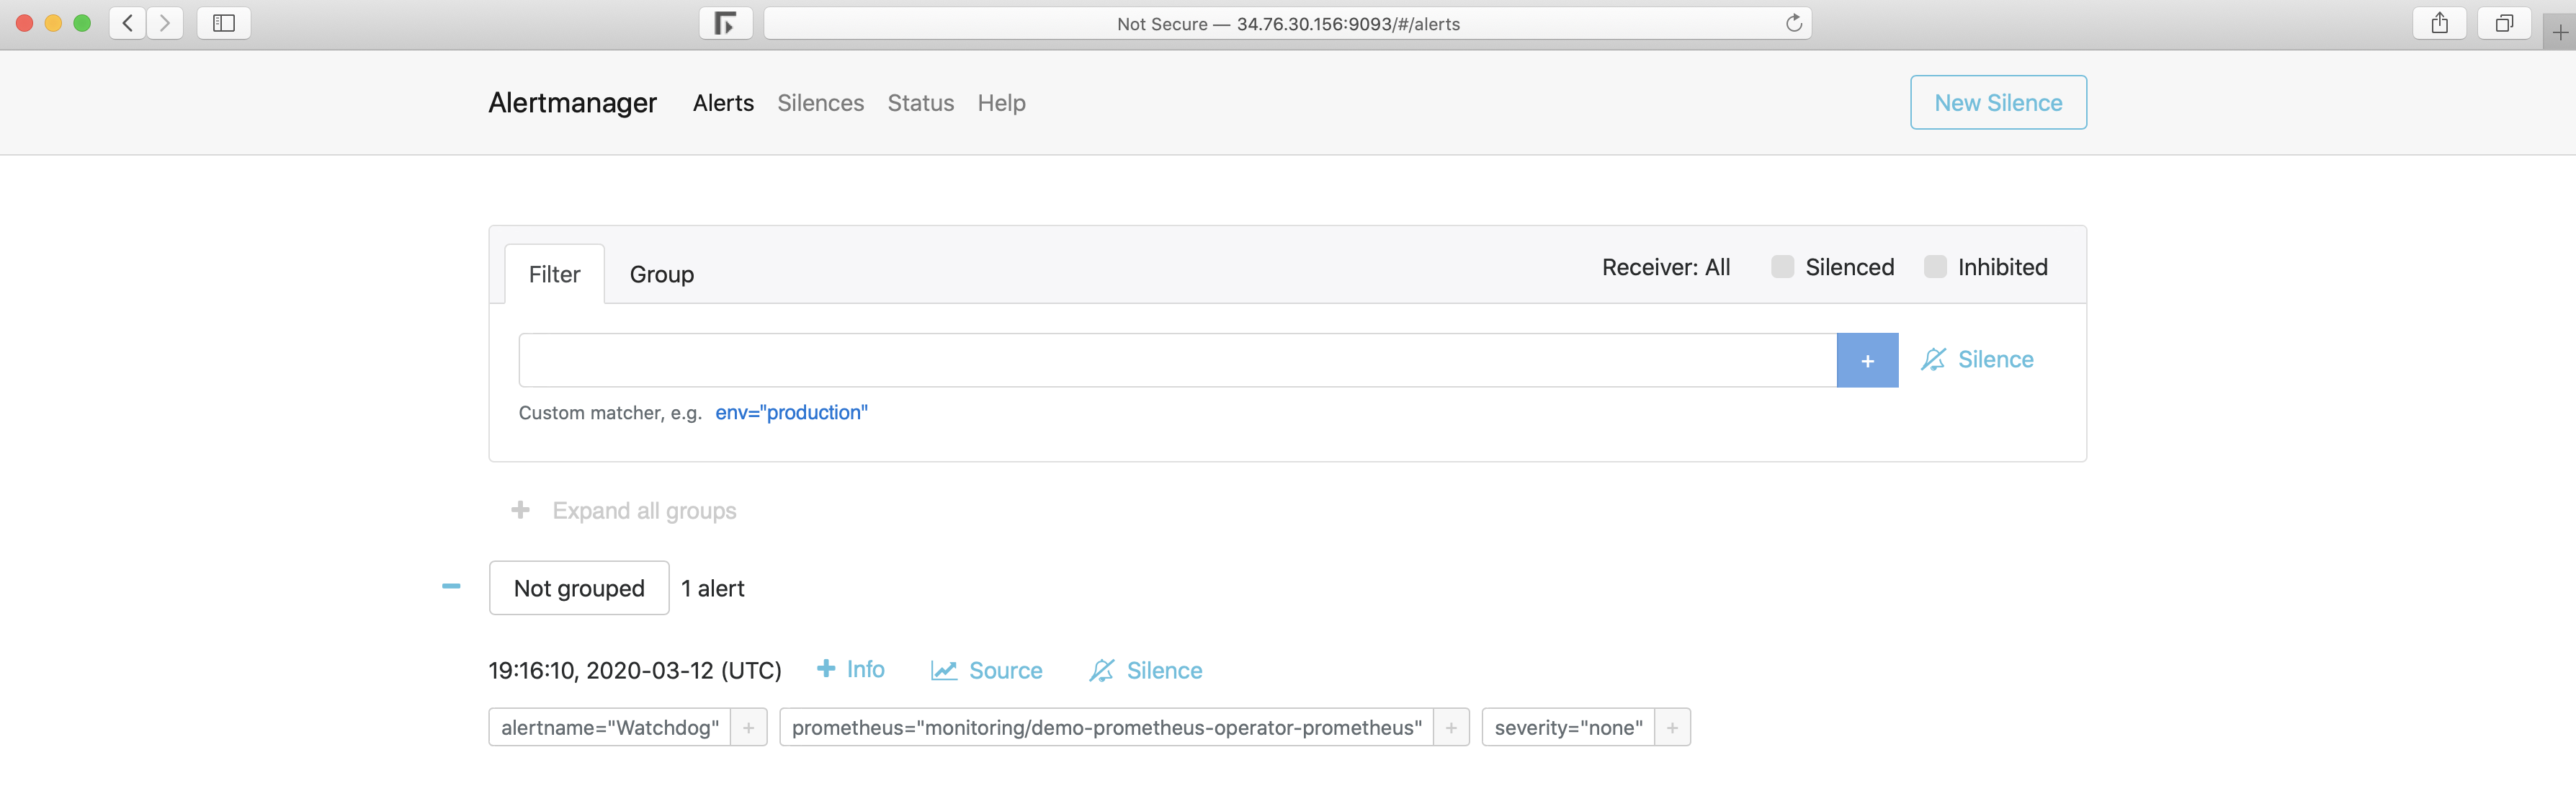
Once the alarm is triggered, it will be displayed in the Alertmanager:
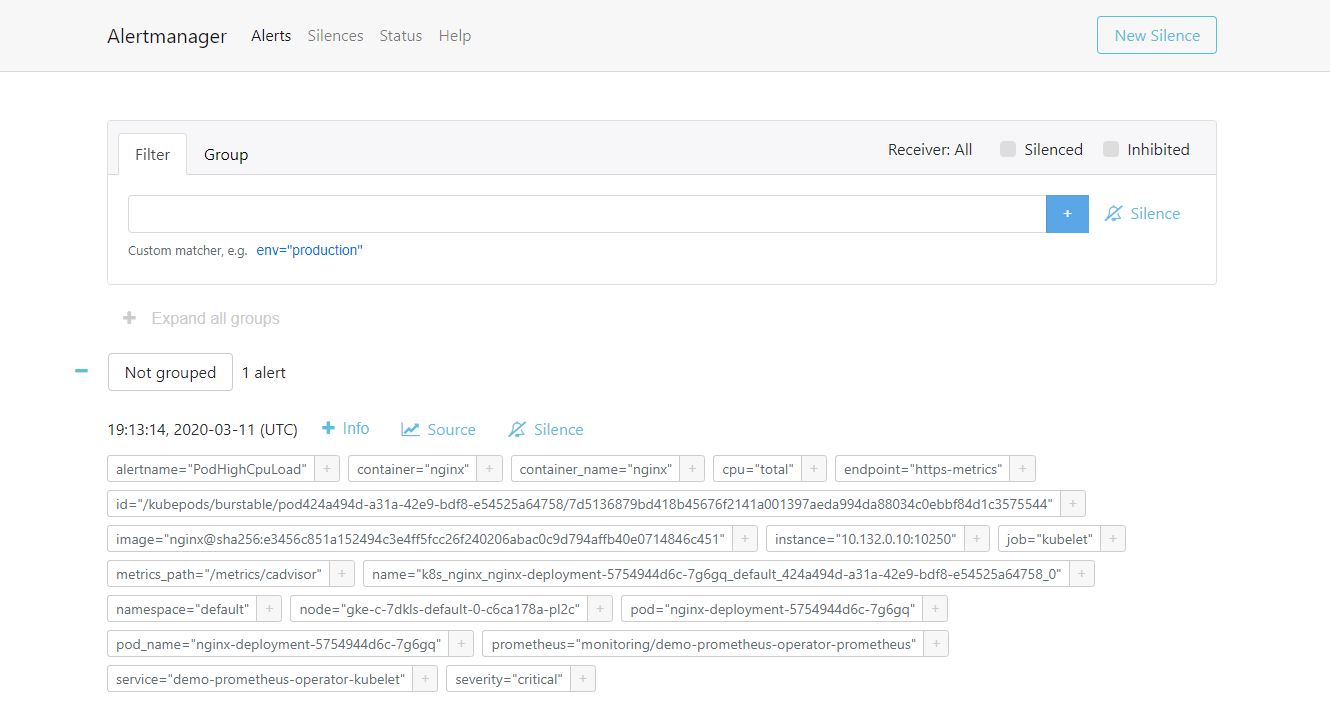
Alertmanger is configured to send mail when we receive an alert. So at this point, if we check the inbox, we see something like this:
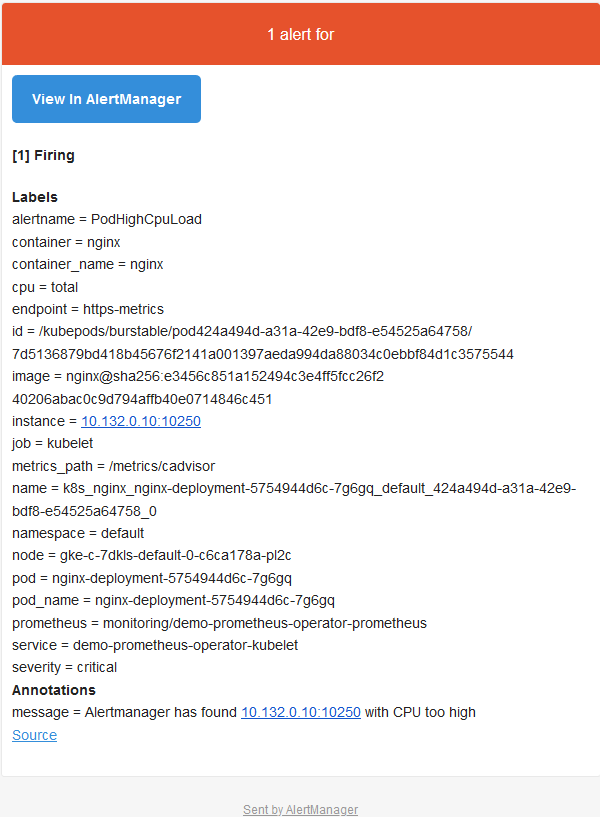
Sum up
We know the importance of monitoring, but if there is no alarm, it will be incomplete. When there is a problem, the alarm can immediately inform us, let us immediately know that there is a problem in the system. Prometheus covers both the monitoring solution and the Alertmanager component. In this article, we saw how to define alarms in the Prometheus configuration and how they reach the Alertmanager when triggered. Then, according to the definition / integration of Alertmanager, we received an email containing the details of the triggered alarm (which can also be sent via Slack or PagerDuty).