Reference link: https://www.jianshu.com/p/37d2e8d68c91
https://satijalab.org/seurat/articles/pbmc3k_tutorial.html
https://satijalab.org/seurat/articles/visualization_vignette.html
The requirement we need to solve in this code is to process the expression matrix (. csv file) we downloaded from the GEO database with the package seurat. The desired goal is to draw a UMAP map and mark the genes we are interested in.
(1) At present, my understanding of the package of seurat is almost zero. It's like learning from scratch.
(2) On the other hand, the processing method of the processing matrix we use is relatively vague.
These are the two problems I have encountered. I believe I have the ability to avert danger every time. I believe I can go on to overcome the difficulties. I hope my analysis results are reliable enough to provide guidance for their next experiments.
In fact, we don't need to use the encapsulated package of seurat, although each step of processing is fool like, which is very cool to use. But I need to put a question mark on the credibility of the results.
Can we simply search and draw UMAP diagram directly using matrix?
Last night, we used umap to directly process the original count matrix. As a result, the calculation was not completed all night (this method must be wrong). Later, check pipeline on official website , it is found that the hypervariable genes are used to find before calculating the principal components. Therefore, the general idea now should be to go through it again according to the process of the official website.
1. First of all, the first step, will be our Objects that convert csv data to seurat.
Reference link: https://www.jianshu.com/p/41d7fdae0484 #There is something wrong with the author's code. Don't use her
https://www.jianshu.com/p/37d2e8d68c91
data<-read.csv("process.csv",header=T)
dim(data)
#36920   454
#First, convert the data into a secrut object. Our matrix is the count matrix
#Convert data to sparse matrix
dataan <- as(as.matrix(data),"dgCMatrix")
Error display:
Error in as(as.matrix(data), "dgCMatrix") :
There is no method or default function that can be used to cast "matrix" to "dgCMatrix"
But yesterday seemed to be a success. Why?
The main reason found is the lack of dependent packages.
library(dplyr)
library(Seurat)
library(patchwork)
After loading, continue to run this step without error.
But the emergence of warning:
Warning message:
In storage.mode(from) <- "double" : NAs introduced by coercion
#The value of NA is forced to be introduced.
Let's see if the value of NA is generated.
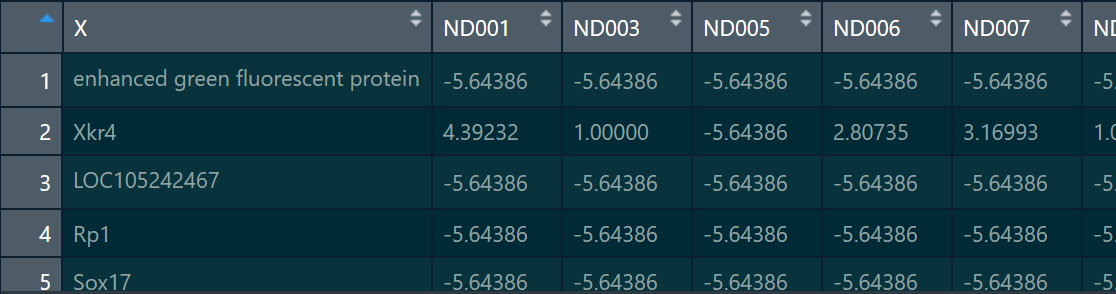
The main reason is that one column of my matrix is a character, and when I read the data, I did not set this column (column X in the figure below, that is, gene name) as the row name.
I'll try reading the matrix again.
library(dplyr)
library(Seurat)
library(patchwork)
data<-read.csv("process.csv",header=T)
row.names(data)<-data[,1]
data<-data[,-1]
dim(data)
#36920   453
#First, convert the data into a secrut object. Our matrix is the count matrix
#Convert data to sparse matrix
data_1<- as.matrix(data)
data_2 <- as(as.matrix(data),"dgCMatrix") #The main reason is that the package was not loaded.
After reading the matrix again, a new error occurs.
Error in asMethod(object) :
'Realloc' could not re-allocate memory (132335648 bytes)
Search on the search engine with the keyword "Realloc 'could not re allocate memory".
I just can't reallocate memory (every time I encounter this type of problem, I'll be stupid immediately).
After checking, it is necessary to clear the running memory of R. maybe I have processed many large matrices before and after, so fill up the memory.
Reference link: https://www.zhihu.com/question/390053502
Solution:
rm(list=ls())
gc()
           used  (Mb) gc trigger   (Mb)  max used
Ncells  3632349 194.0    6540962  349.4   6540962
Vcells 40283137 307.4  139136965 1061.6 173921129
         (Mb)
Ncells  349.4
Vcells 1327.0

rstudioapi::restartSession() #Restart R

Restarting R session...
Finally.
Let's look at the structure of this sparse matrix.
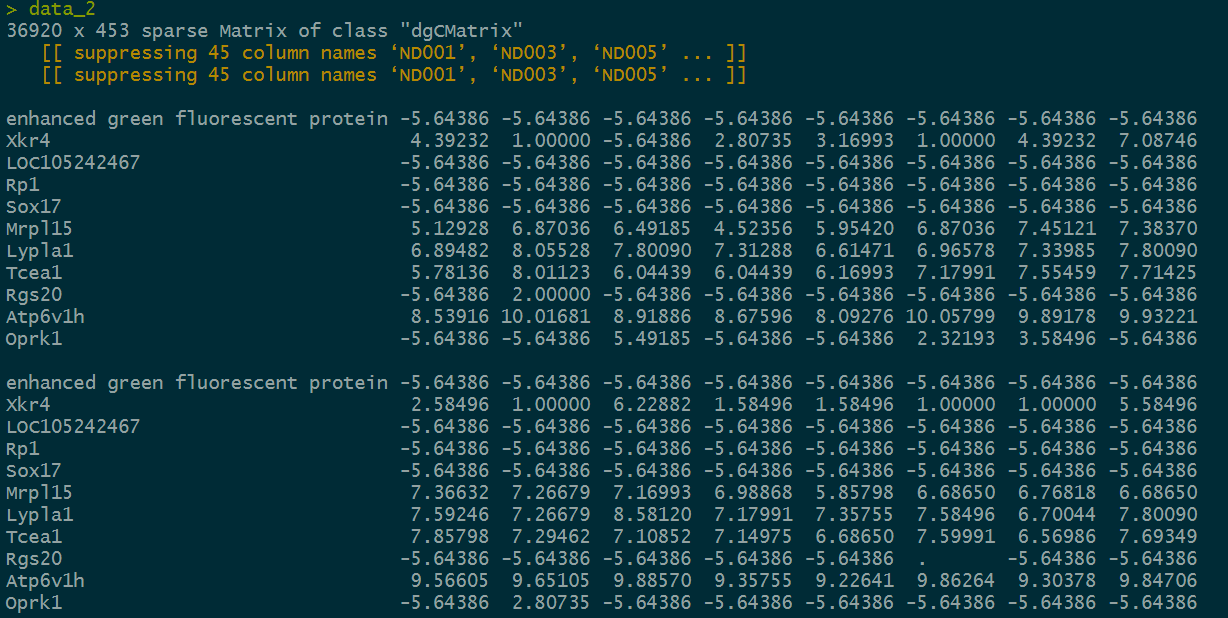
This matrix should be similar to the expression matrix I am familiar with.
Then, convert the data to a seurat object.
data_3<- CreateSeuratObject(counts = data_2, project = "tang", min.cells = 3, min.features = 200)
During the conversion, new problems arise.
Error in h(simpleError(msg, call)) :
An error occurred while evaluating the 'x' parameter while selecting a method for the 'colSums' function: Cholmod error' out of memory 'at file... / Core/cholmod_memory.c, line 146
It's strange to say out of memory.
The solution to this problem is very simple. It's because I've taken up all the space in front of me. It's strange to be dissatisfied with several super large matrices. At this time, the simplest way is to restart Rstudio.
After this problem is solved, our seurat object has been created. Then, the next thing we have to face is how to deal with this object.
2. Process the seurat object.
(I forgot to record. The next steps are encapsulated in the seurat package. You only need to run it like a fool.)
data_3<-FindVariableFeatures(data_3,selection.method = "vst",nfeatures = 5633) #Search for hypervariable genes
all.genes<-rownames(data_3)
data_3<-ScaleData(data_3,features = all.genes) #normalization
data_3<-RunPCA(data_3,features = VariableFeatures(object = data_3)) #PCA
data_3<-FindNeighbors(data_3,dims = 1:40) #clustering
data_3<-FindClusters(data_3,resolution = 0.5)
data_3<-RunUMAP(data_3,dims = 1:40) #UMAP
3. Individually label the cell populations of interest
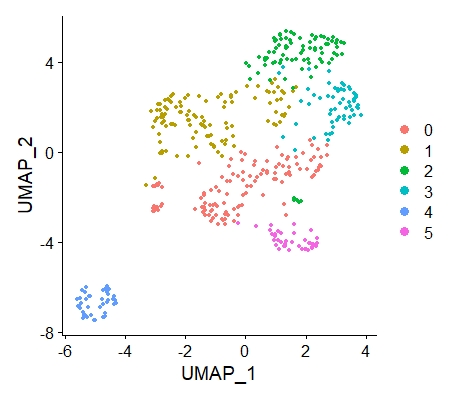
DimPlot(data_3,reduction = "umap")
#cell.highlight
#cols.highlight
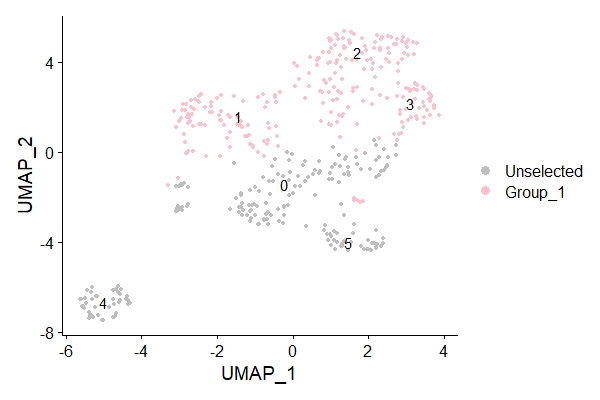
g1_treat <- WhichCells(data_3, idents = c("1","2","3"))
DimPlot(data_3,label=T,cells.highlight= list(g1_treat), cols.highlight = c("pink"),cols = "grey")
g2_treat <- WhichCells(data_3, idents = c("5"))
DimPlot(data_3,label=T,cells.highlight= list(g2_treat), cols.highlight = c("pink"),cols = "grey")
g3_treat <- WhichCells(data_3, idents = c("5","0"))
DimPlot(data_3,label=T,cells.highlight= list(g3_treat), cols.highlight = c("pink"),cols = "grey")
g4_treat <- WhichCells(data_3, idents = c("0"))
DimPlot(data_3,label=T,cells.highlight= list(g4_treat), cols.highlight = c("pink"),cols = "grey")
The resulting figure is shown below.
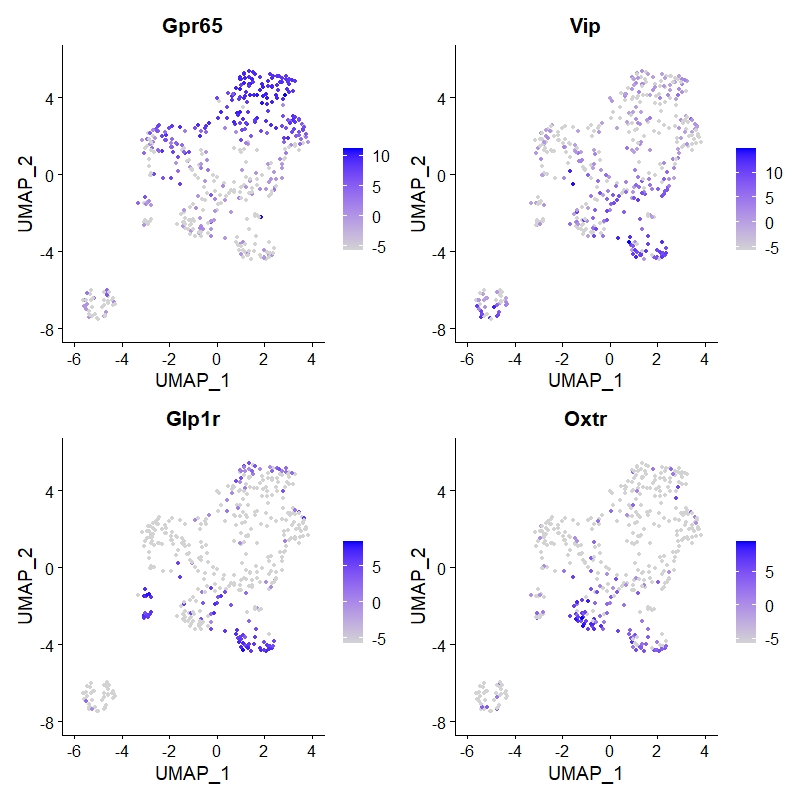
4. Label cells expressing genes of interest to us
FeaturePlot(data_3,features = c("Gpr65"))
FeaturePlot(data_3,features = c("Vip"))
FeaturePlot(data_3,features = c("Glp1r"))
FeaturePlot(data_3,features = c("Oxtr"))

FeaturePlot(data_3,features = c("Gpr65","Vip","Glp1r","Oxtr"))
Of course, there are other details that can be further explored. So far, we have basically completed our needs.
However, for our project, it should be understood that the author draws the tsne diagram.
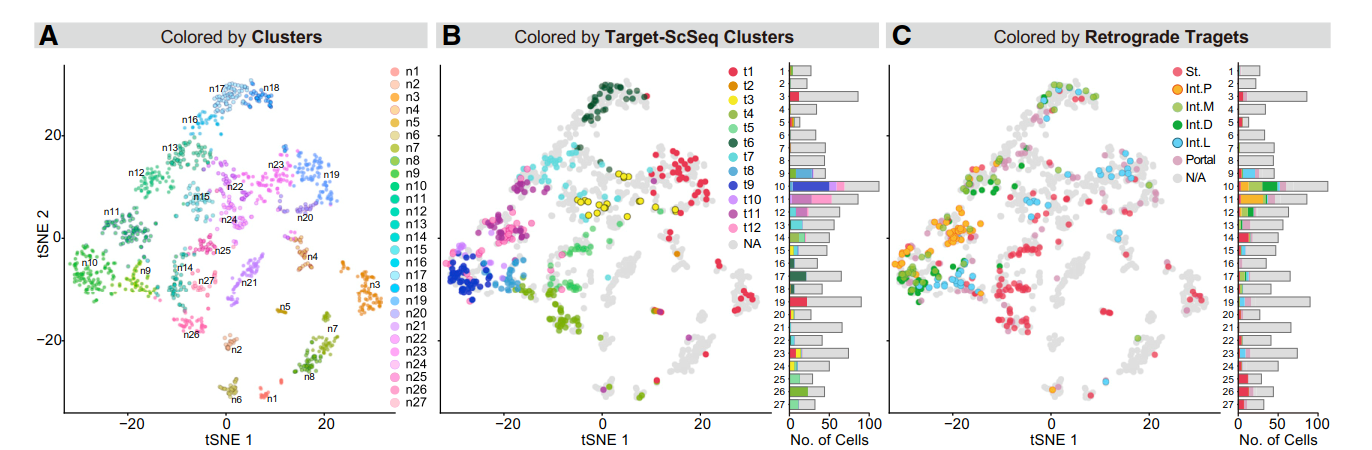
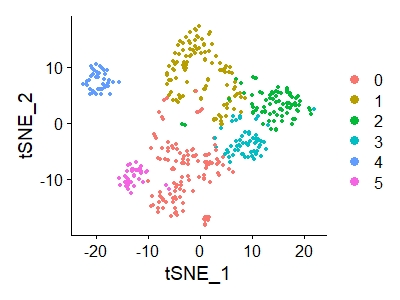
In the tsne diagram, the author divides the cells into 27 categories, while we only have 6 categories. I don't know whether there will be any difference.
If you just want to see it, it doesn't matter.
data_3<-RunTSNE(data_3,dims = 1:40)
DimPlot(data_3,reduction = "tsne")
The article also said that some cells were removed due to cell damage during operation. We marked them in the figure.
(pictures can't be uploaded here)
Roughly speaking, these damaged cells are not in the class of genes we are interested in. So we can remove it. Or these damaged cells will not affect our experiment.