This article is mainly reproduced in Blog
github project address: https://github.com/albu/albumentations
Help document - evaluations
This paper mainly introduces some common methods of image data enhancement library augmentation
Python image processing library – augmentations, which can be used for image data enhancement during network training in deep learning. Features of augmentations image data enhancement Library:
- Fast image data enhancement based on highly optimized OpenCV library;
- Super simple API interface for different image tasks, such as segmentation and detection;
- Easy to customize;
- Easy to add to other frameworks, such as PyTorch;
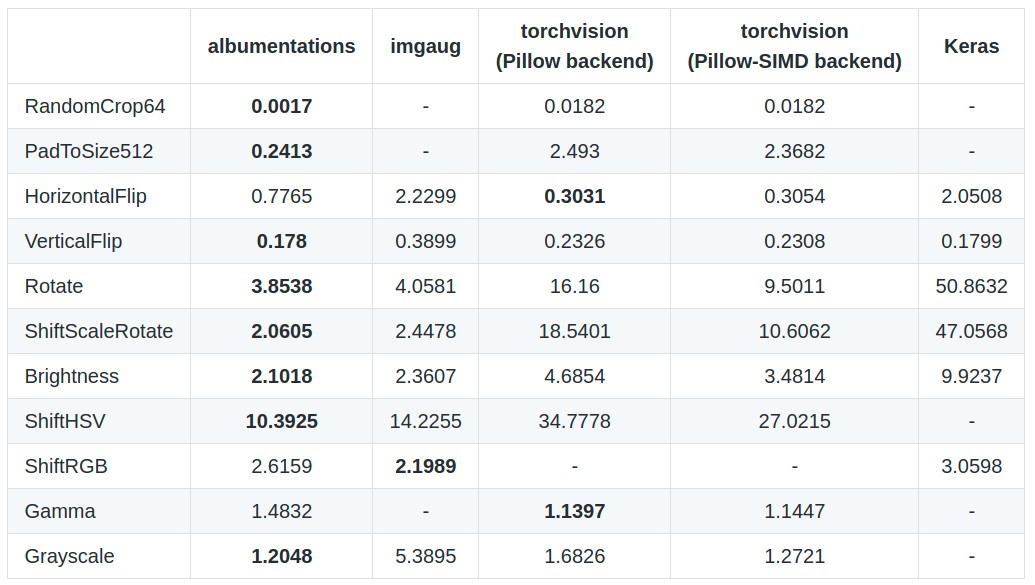
The following is the right ImageNet Validation Set The first 2000 pictures in are processed with Intel Core i7-7800X CPU. The processing speed of different data enhancement libraries is compared (in seconds, the less the time, the better)——
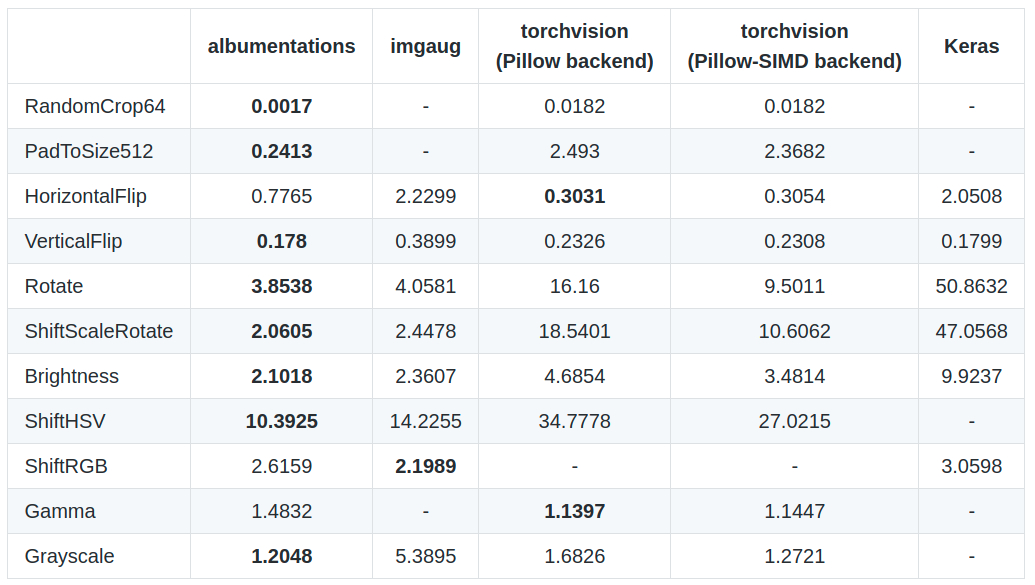 Comparison of processing speed of different data enhancement Libraries
1. pip installation of investments
sudo pip install albumentations
# or
sudo pip install -U git+https://github.com/albu/albumentations
2. Comparison of different image data enhancement Libraries
albumentations/benchmark/README.md
The first 2000 images in the ImageNet validation set are processed using Intel Core i7-7800X CPU
The processing speed of different data enhancement libraries is compared in seconds. The less the time, the better
3. Use examples
import numpy as np
import cv2
from matplotlib import pyplot as plt
from albumentations import (
HorizontalFlip, IAAPerspective, ShiftScaleRotate, CLAHE, RandomRotate90,
Transpose, ShiftScaleRotate, Blur, OpticalDistortion, GridDistortion, HueSaturationValue,
IAAAdditiveGaussianNoise, GaussNoise, MotionBlur, MedianBlur, IAAPiecewiseAffine,
IAASharpen, IAAEmboss, RandomContrast, RandomBrightness, Flip, OneOf, Compose
) # Image transformation function
image = cv2.imread('test.jpg', 1) # BGR
image = cv2.cvtColor(image, cv2.COLOR_BGR2RGB)
aug = HorizontalFlip(p=1)
img_HorizontalFlip = aug(image=image)['image']
aug = IAAPerspective(scale=0.2, p=1)
img_IAAPerspective = aug(image=image)['image']
aug = ShiftScaleRotate(p=1)
img_ShiftScaleRotate = aug(image=image)['image']
def augment_flips_color(p=.5):
return Compose([
CLAHE(),
RandomRotate90(),
Transpose(),
ShiftScaleRotate(shift_limit=0.0625, scale_limit=0.50, rotate_limit=45, p=.75),
Blur(blur_limit=3),
OpticalDistortion(),
GridDistortion(),
HueSaturationValue()
], p=p)
aug = augment_flips_color(p=1)
img_augment_flips_color = aug(image=image)['image']
def strong_aug(p=.5):
return Compose([
RandomRotate90(),
Flip(),
Transpose(),
OneOf([
IAAAdditiveGaussianNoise(),
GaussNoise(),
], p=0.2),
OneOf([
MotionBlur(p=.2),
MedianBlur(blur_limit=3, p=.1),
Blur(blur_limit=3, p=.1),
], p=0.2),
ShiftScaleRotate(shift_limit=0.0625, scale_limit=0.2, rotate_limit=45, p=.2),
OneOf([
OpticalDistortion(p=0.3),
GridDistortion(p=.1),
IAAPiecewiseAffine(p=0.3),
], p=0.2),
OneOf([
CLAHE(clip_limit=2),
IAASharpen(),
IAAEmboss(),
RandomContrast(),
RandomBrightness(),
], p=0.3),
HueSaturationValue(p=0.3),
], p=p)
aug == strong_aug(p=1)
img_strong_aug = aug(image=image)['image']
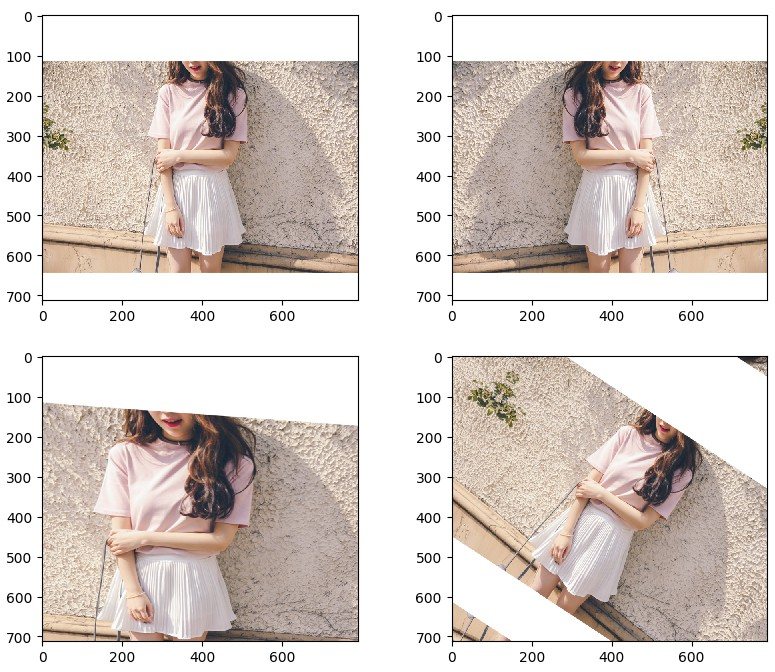
# show
plt.subplot(2, 3, 1)
plt.imshow(image)
plt.subplot(2, 3, 2)
plt.imshow(img_HorizontalFlip)
plt.subplot(2, 3, 3)
plt.imshow(img_IAAPerspective)
plt.subplot(2, 3, 4)
plt.imshow(img_ShiftScaleRotate)
plt.subplot(2, 3, 5)
plt.imshow(img_augment_flips_color)
plt.subplot(2, 3, 6)
plt.imshow(img_strong_aug)
plt.show()
from albumentations import (
    RandomRotate90, Transpose, ShiftScaleRotate, Blur,
    OpticalDistortion, CLAHE, GaussNoise, MotionBlur,
    GridDistortion, HueSaturationValue, IAAAdditiveGaussianNoise,
    MedianBlur, IAAPiecewiseAffine, IAASharpen, IAAEmboss,
    RandomContrast, RandomBrightness, Flip, OneOf, Compose
)
import numpy as np

def strong_aug(p=0.5):
    return Compose([
        RandomRotate90(),
        Flip(),
        Transpose(),
        OneOf([
            IAAAdditiveGaussianNoise(),
            GaussNoise(),
        ], p=0.2),
        OneOf([
            MotionBlur(p=0.2),
            MedianBlur(blur_limit=3, p=0.1),
            Blur(blur_limit=3, p=0.1),
        ], p=0.2),
        ShiftScaleRotate(shift_limit=0.0625, scale_limit=0.2, rotate_limit=45, p=0.2),
        OneOf([
            OpticalDistortion(p=0.3),
            GridDistortion(p=0.1),
            IAAPiecewiseAffine(p=0.3),
        ], p=0.2),
        OneOf([
            CLAHE(clip_limit=2),
            IAASharpen(),
            IAAEmboss(),
            RandomContrast(),
            RandomBrightness(),
        ], p=0.3),
        HueSaturationValue(p=0.3),
    ], p=p)

image = np.ones((300, 300, 3), dtype=np.uint8)
mask = np.ones((300, 300), dtype=np.uint8)
whatever_data = "my name"
augmentation = strong_aug(p=0.9)
data = {"image": image, "mask": mask, "whatever_data": whatever_data, "additional": "hello"}
augmented = augmentation(**data)  ## Data enhancement
image, mask, whatever_data, additional = augmented["image"], augmented["mask"], augmented["whatever_data"], augmented["additional"]
4. Use examples of updates
October 24, 2018
Github - Albumentations Updated several usage demos about evaluations
4.1 comprehensive example - showcase
# Import related libraries and define functions for visualization
#!--*-- coding: utf-8 --*--
import os

import numpy as np
import cv2
from matplotlib import pyplot as plt
from skimage.color import label2rgb

import albumentations as A
import random

BOX_COLOR = (255, 0, 0)
TEXT_COLOR = (255, 255, 255)

def visualize_bbox(img, bbox, color=BOX_COLOR, thickness=2, **kwargs):
    #height, width = img.shape[:2]
    x_min, y_min, w, h = bbox
    x_min, x_max, y_min, y_max = int(x_min), int(x_min + w), int(y_min), int(y_min + h)

    cv2.rectangle(img, (x_min, y_min), (x_max, y_max), color=color, thickness=thickness)
    return img

def visualize_titles(img, bbox, title, color=BOX_COLOR, thickness=2, font_thickness = 2, font_scale=0.35, **kwargs):
    #height, width = img.shape[:2]
    x_min, y_min, w, h = bbox
    x_min, x_max, y_min, y_max = int(x_min), int(x_min + w), int(y_min), int(y_min + h)

    ((text_width, text_height), _) = cv2.getTextSize(title, cv2.FONT_HERSHEY_SIMPLEX, font_scale, font_thickness)
    cv2.rectangle(img, (x_min, y_min - int(1.3 * text_height)), (x_min + text_width, y_min), BOX_COLOR, -1)
    cv2.putText(img, title, (x_min, y_min - int(0.3 * text_height)), cv2.FONT_HERSHEY_SIMPLEX, font_scale, TEXT_COLOR,
                font_thickness, lineType=cv2.LINE_AA)
    return img


def augment_and_show(aug, image, mask=None, bboxes=[],
                     categories=[], category_id_to_name=[], filename=None,
                     font_scale_orig=0.35, font_scale_aug=0.35,
                     show_title=True, **kwargs):

    augmented = aug(image=image, mask=mask, bboxes=bboxes, category_id=categories)

    image = cv2.cvtColor(image, cv2.COLOR_BGR2RGB)
    image_aug = cv2.cvtColor(augmented['image'], cv2.COLOR_BGR2RGB)

    for bbox in bboxes:
        visualize_bbox(image, bbox, **kwargs)

    for bbox in augmented['bboxes']:
        visualize_bbox(image_aug, bbox, **kwargs)

    if show_title:
        for bbox,cat_id in zip(bboxes, categories):
            visualize_titles(image, bbox, category_id_to_name[cat_id], font_scale=font_scale_orig, **kwargs)
        for bbox,cat_id in zip(augmented['bboxes'], augmented['category_id']):
            visualize_titles(image_aug, bbox, category_id_to_name[cat_id], font_scale=font_scale_aug, **kwargs)


    if mask is None:
        f, ax = plt.subplots(1, 2, figsize=(16, 8))

        ax[0].imshow(image)
        ax[0].set_title('Original image')

        ax[1].imshow(image_aug)
        ax[1].set_title('Augmented image')
    else:
        f, ax = plt.subplots(2, 2, figsize=(16, 16))

        if len(mask.shape) != 3:
            mask = label2rgb(mask, bg_label=0)
            mask_aug = label2rgb(augmented['mask'], bg_label=0)
        else:
            mask = cv2.cvtColor(mask, cv2.COLOR_BGR2RGB)
            mask_aug = cv2.cvtColor(augmented['mask'], cv2.COLOR_BGR2RGB)

        ax[0, 0].imshow(image)
        ax[0, 0].set_title('Original image')

        ax[0, 1].imshow(image_aug)
        ax[0, 1].set_title('Augmented image')

        ax[1, 0].imshow(mask, interpolation='nearest')
        ax[1, 0].set_title('Original mask')

        ax[1, 1].imshow(mask_aug, interpolation='nearest')
        ax[1, 1].set_title('Augmented mask')

    f.tight_layout()
    plt.show()

    if filename is not None:
        f.savefig(filename)

    return augmented['image'], augmented['mask'], augmented['bboxes']


def find_in_dir(dirname):
    return [os.path.join(dirname, fname) for fname in sorted(os.listdir(dirname))]
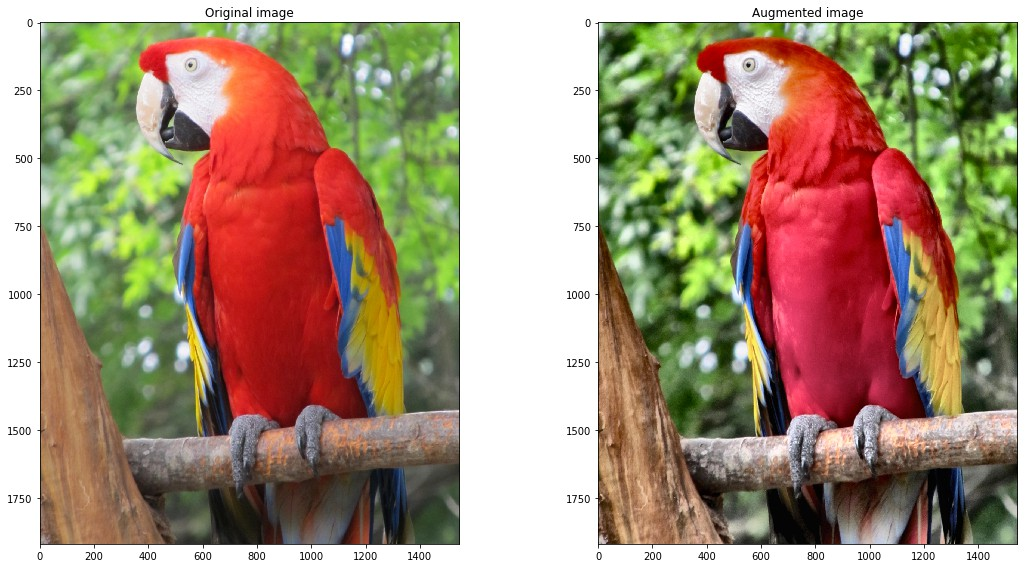
Color enhancements - Color Augmentations
# Color enhancement processing function
random.seed(42)
image = cv2.imread('images/parrot.jpg')
light = A.Compose([
A.RandomBrightness(p=1),
A.RandomContrast(p=1),
A.RandomGamma(p=1),
# A.RGBShift(),
A.CLAHE(p=1),
# A.ToGray(),
# A.HueSaturationValue(),
], p=1)
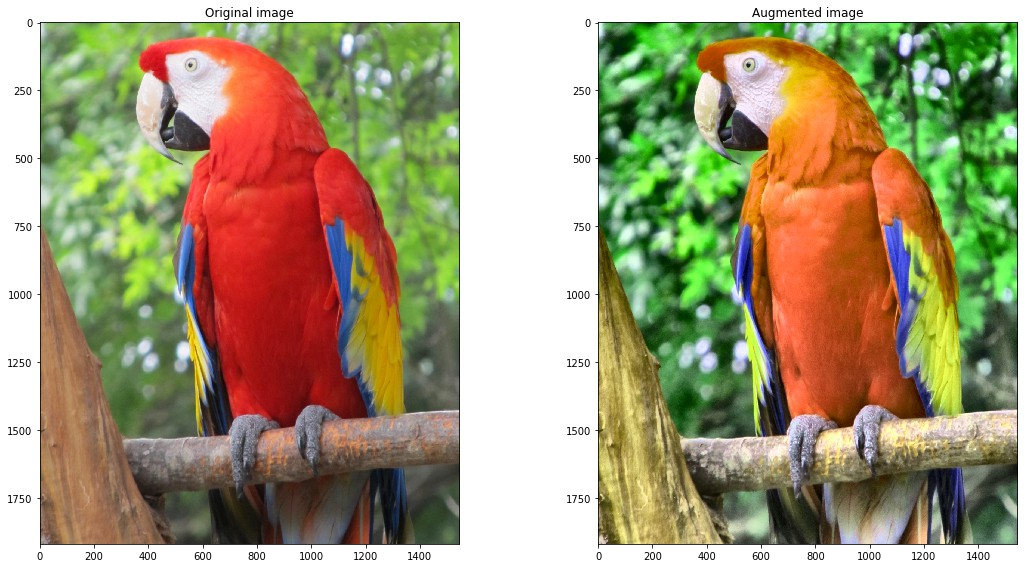
medium = A.Compose([
A.CLAHE(p=1),
A.HueSaturationValue(hue_shift_limit=20, sat_shift_limit=50, val_shift_limit=50, p=1),
], p=1)
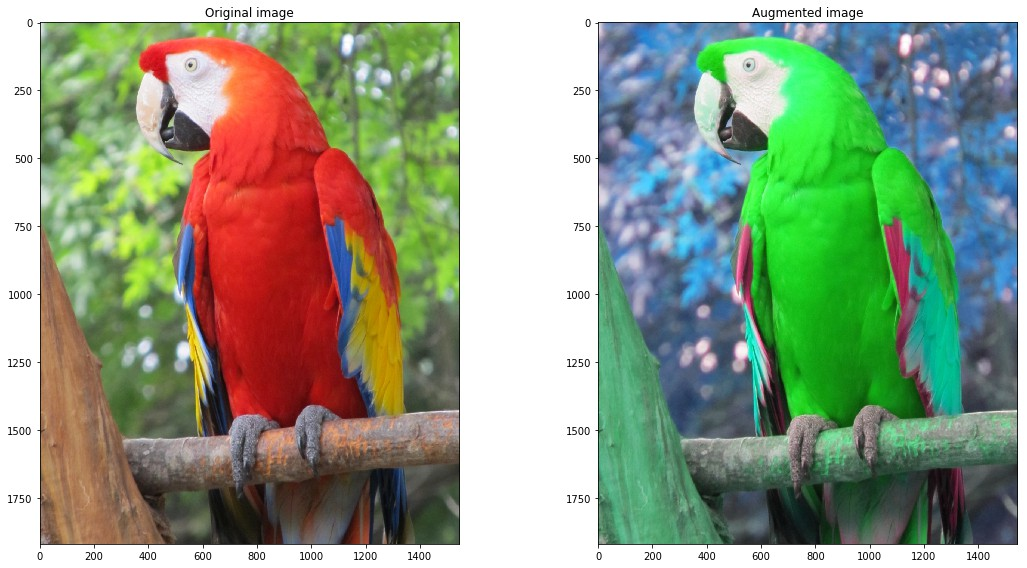
strong = A.Compose([
A.ChannelShuffle(p=1),
], p=1)
Color enhancement - light:
res = augment_and_show(light, image)
Color enhancement - medium:
res = augment_and_show(medium, image)
Color enhancement - strong:
res = augment_and_show(strong, image)
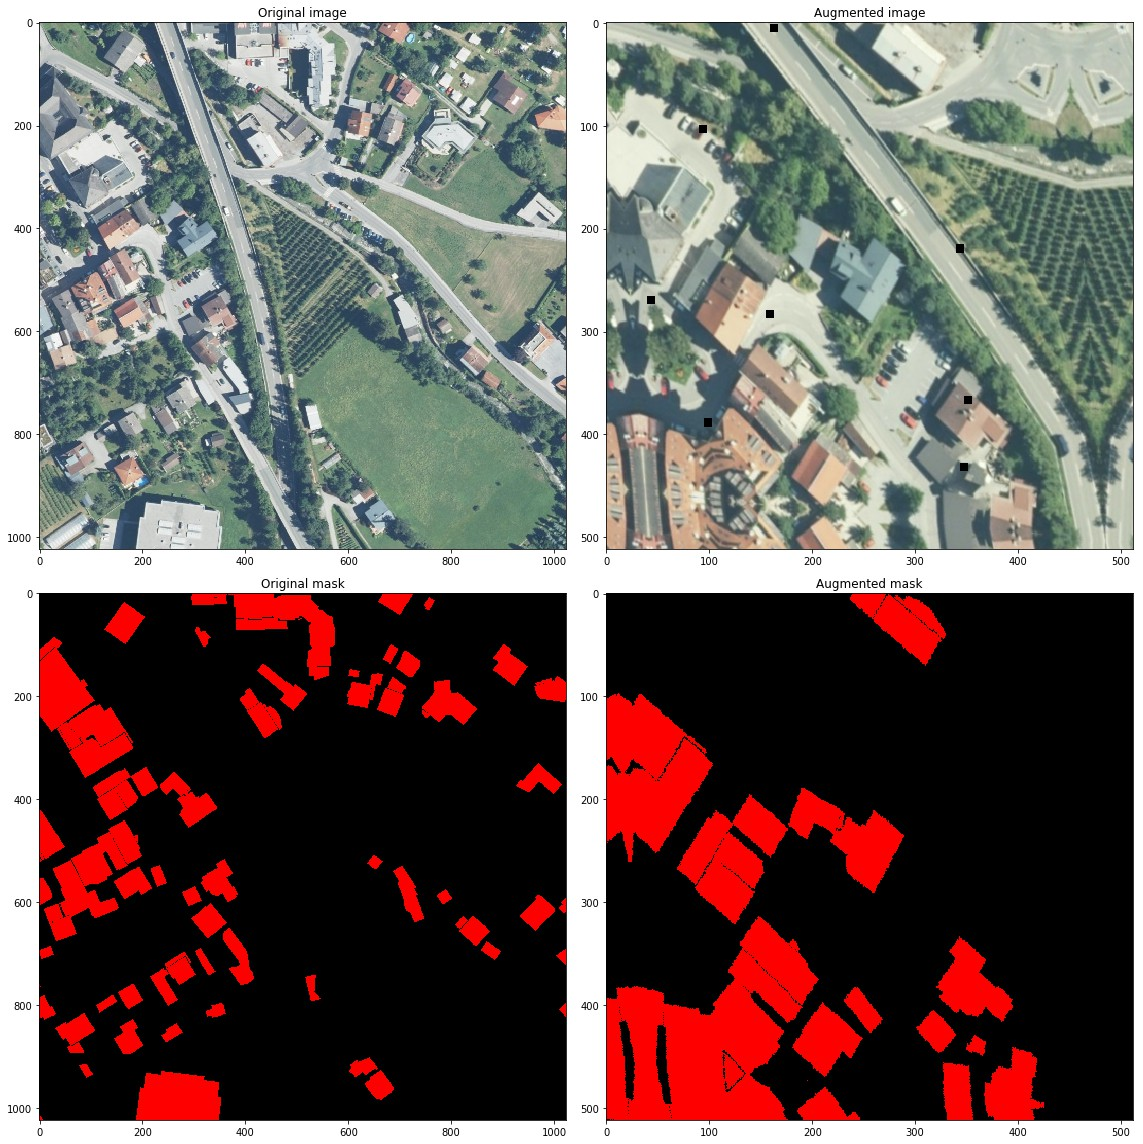
Aerial remote sensing image - Inria Aerial Image Labeling Dataset
random.seed(42)

image = cv2.imread('images/inria/inria_tyrol_w4_image.jpg')
mask = cv2.imread('images/inria/inria_tyrol_w4_mask.tif', cv2.IMREAD_GRAYSCALE)
image, mask = image[:1024, :1024], mask[:1024,:1024]

light = A.Compose([
    A.RandomSizedCrop((512-100, 512+100), 512, 512),
    A.ShiftScaleRotate(),
    A.RGBShift(),
    A.Blur(),
    A.GaussNoise(),
    A.ElasticTransform(),
    A.Cutout(p=1)
],p=1)

res = augment_and_show(light, image, mask)
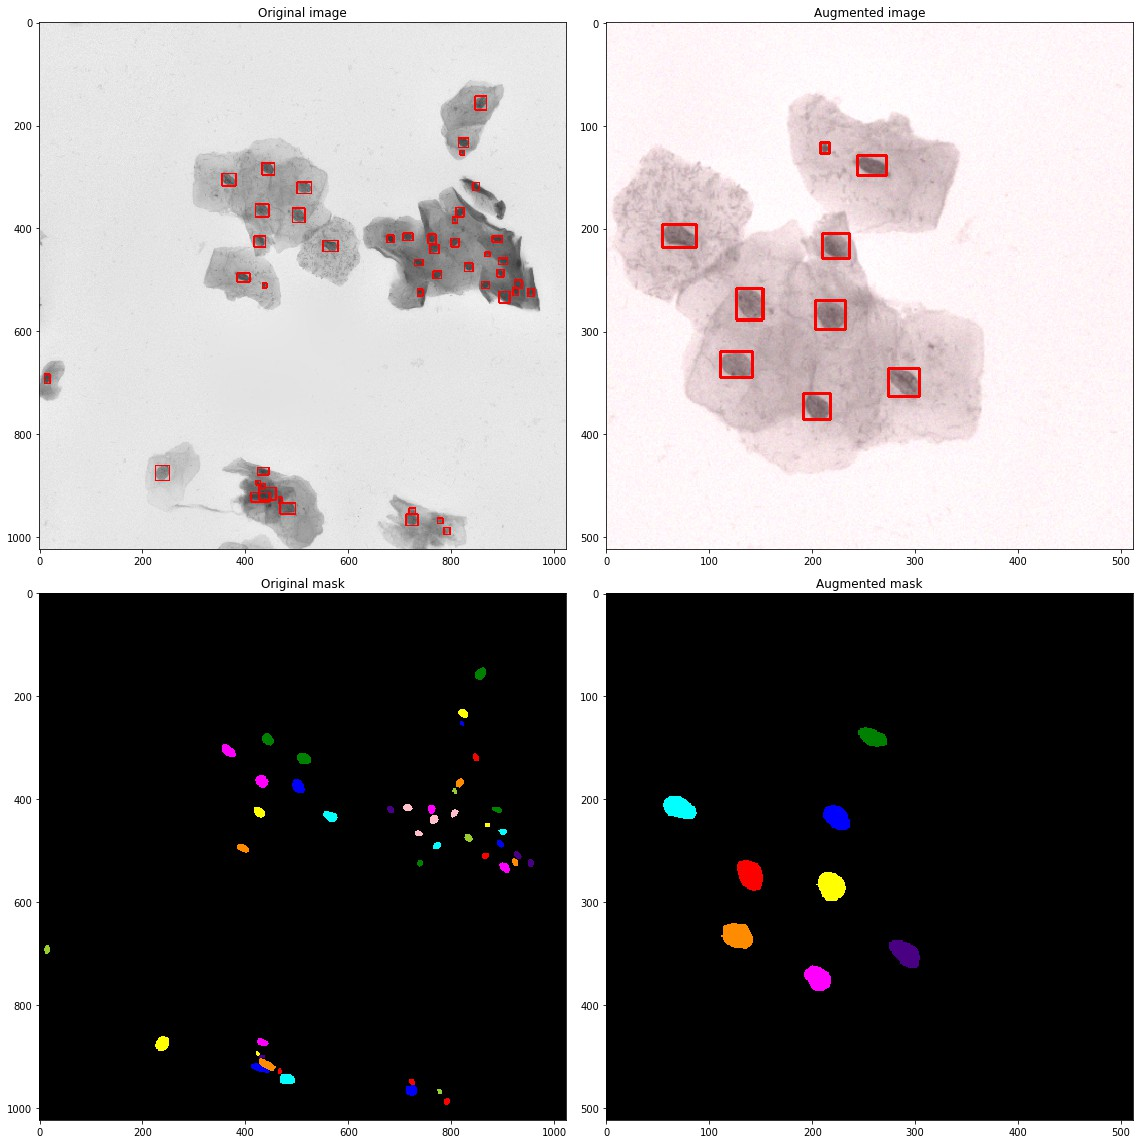
Nuclear segmentation - 2018 Data Science Bowl
random.seed(42)

image = cv2.imread('images/dsb2018/1a11552569160f0b1ea10bedbd628ce6c14f29edec5092034c2309c556df833e/images/1a11552569160f0b1ea10bedbd628ce6c14f29edec5092034c2309c556df833e.png')
masks = [cv2.imread(x, cv2.IMREAD_GRAYSCALE) for x in find_in_dir('images/dsb2018/1a11552569160f0b1ea10bedbd628ce6c14f29edec5092034c2309c556df833e/masks')]
bboxes = [cv2.boundingRect(cv2.findNonZero(mask)) for mask in masks]
label_image = np.zeros_like(masks[0])
for i, mask in enumerate(masks):
    label_image += (mask > 0).astype(np.uint8) * i

light = A.Compose([
    A.RGBShift(),
    A.InvertImg(),
    A.Blur(),
    A.GaussNoise(),
    A.Flip(),
    A.RandomRotate90(),
    A.RandomSizedCrop((512 - 100, 512 + 100), 512, 512),
], bbox_params={'format':'coco', 'min_area': 1, 'min_visibility': 0.5, 'label_fields': ['category_id']}, p=1)

label_ids = [0] * len(bboxes)
label_names = ['Nuclei']

res = augment_and_show(light, image, label_image, bboxes, label_ids, label_names, show_title=False)
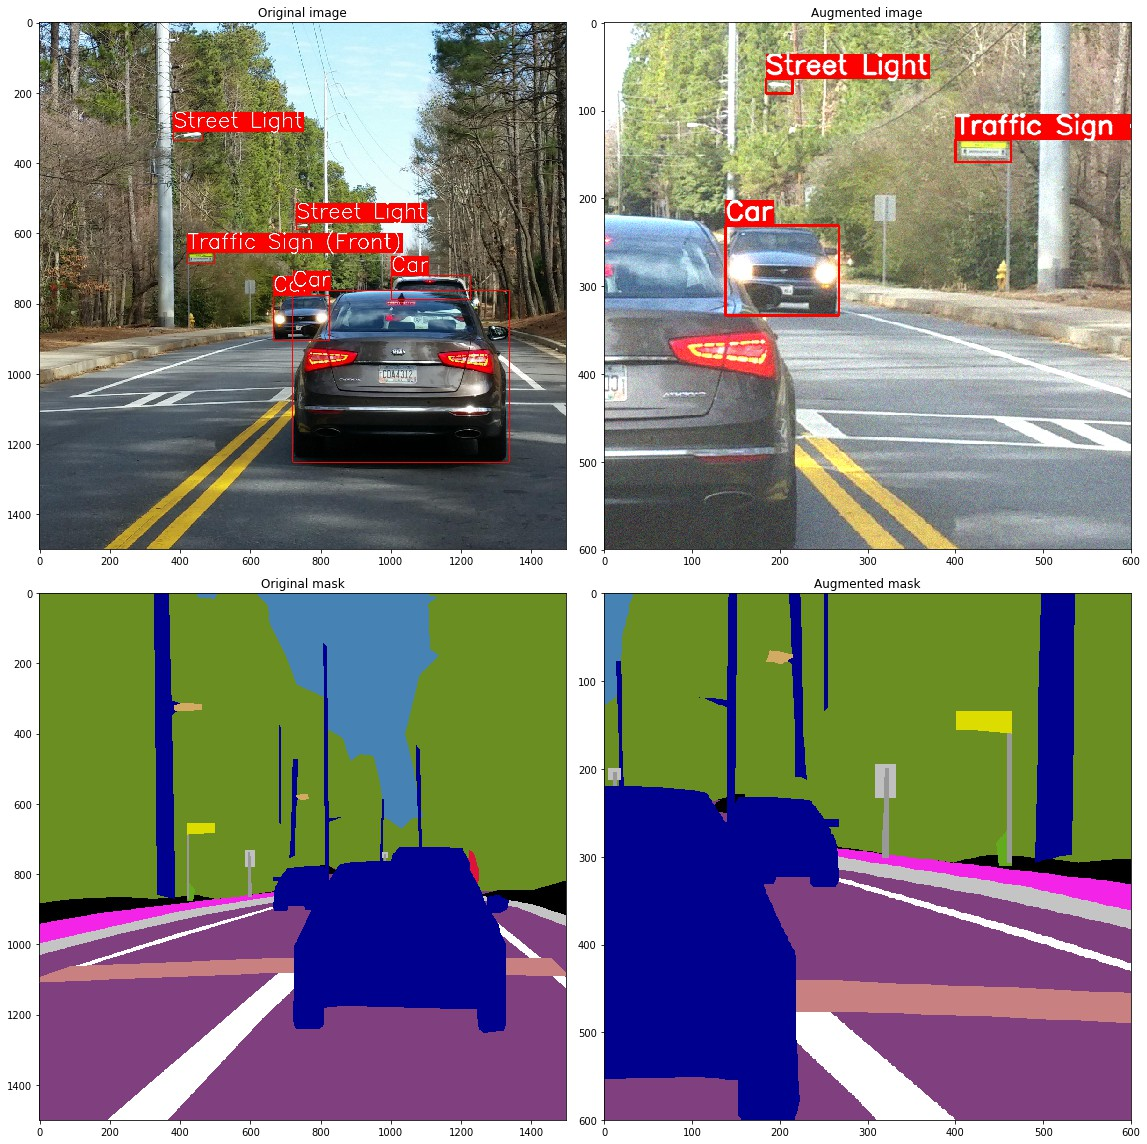
Street view data - mapilary Vista
from PIL import Image
image = cv2.imread('images/vistas/_HnWguqEbRCphUquTMrCCA.jpg')
labels = cv2.imread('images/vistas/_HnWguqEbRCphUquTMrCCA_labels.png', cv2.IMREAD_COLOR)
instances = np.array(Image.open('images/vistas/_HnWguqEbRCphUquTMrCCA_instances.png'),dtype=np.uint16)
IGNORED = 65 * 256
instances[(instances//256 != 55) & (instances//256 != 44) & (instances//256 != 50)] = IGNORED
image = image[1000:2500, 1000:2500]
labels = labels[1000:2500, 1000:2500]
instances = instances[1000:2500, 1000:2500]
bboxes = [cv2.boundingRect(cv2.findNonZero((instances == instance_id).astype(np.uint8))) for instance_id in np.unique(instances) if instance_id != IGNORED]
instance_labels = [instance_id // 256 for instance_id in np.unique(instances) if instance_id != IGNORED]
# coco_bboxes = [list(bbox) + [label] for bbox, label in zip(bboxes, instance_labels)]
# coco_bboxes = A.convert_bboxes_to_albumentations(image.shape, coco_bboxes, source_format='coco')
titles = ["Bird",
"Ground Animal",
"Curb",
"Fence",
"Guard Rail",
"Barrier",
"Wall",
"Bike Lane",
"Crosswalk - Plain",
"Curb Cut",
"Parking",
"Pedestrian Area",
"Rail Track",
"Road",
"Service Lane",
"Sidewalk",
"Bridge",
"Building",
"Tunnel",
"Person",
"Bicyclist",
"Motorcyclist",
"Other Rider",
"Lane Marking - Crosswalk",
"Lane Marking - General",
"Mountain",
"Sand",
"Sky",
"Snow",
"Terrain",
"Vegetation",
"Water",
"Banner",
"Bench",
"Bike Rack",
"Billboard",
"Catch Basin",
"CCTV Camera",
"Fire Hydrant",
"Junction Box",
"Mailbox",
"Manhole",
"Phone Booth",
"Pothole",
"Street Light",
"Pole",
"Traffic Sign Frame",
"Utility Pole",
"Traffic Light",
"Traffic Sign (Back)",
"Traffic Sign (Front)",
"Trash Can",
"Bicycle",
"Boat",
"Bus",
"Car",
"Caravan",
"Motorcycle",
"On Rails",
"Other Vehicle",
"Trailer",
"Truck",
"Wheeled Slow",
"Car Mount",
"Ego Vehicle",
"Unlabeled"]
light = A.Compose([
A.HorizontalFlip(p=1),
A.RandomSizedCrop((800 - 100, 800 + 100), 600, 600),
A.GaussNoise(var_limit=(100, 150), p=1),
], bbox_params={'format':'coco', 'min_area': 1, 'min_visibility': 0.5, 'label_fields': ['category_id']}, p=1)
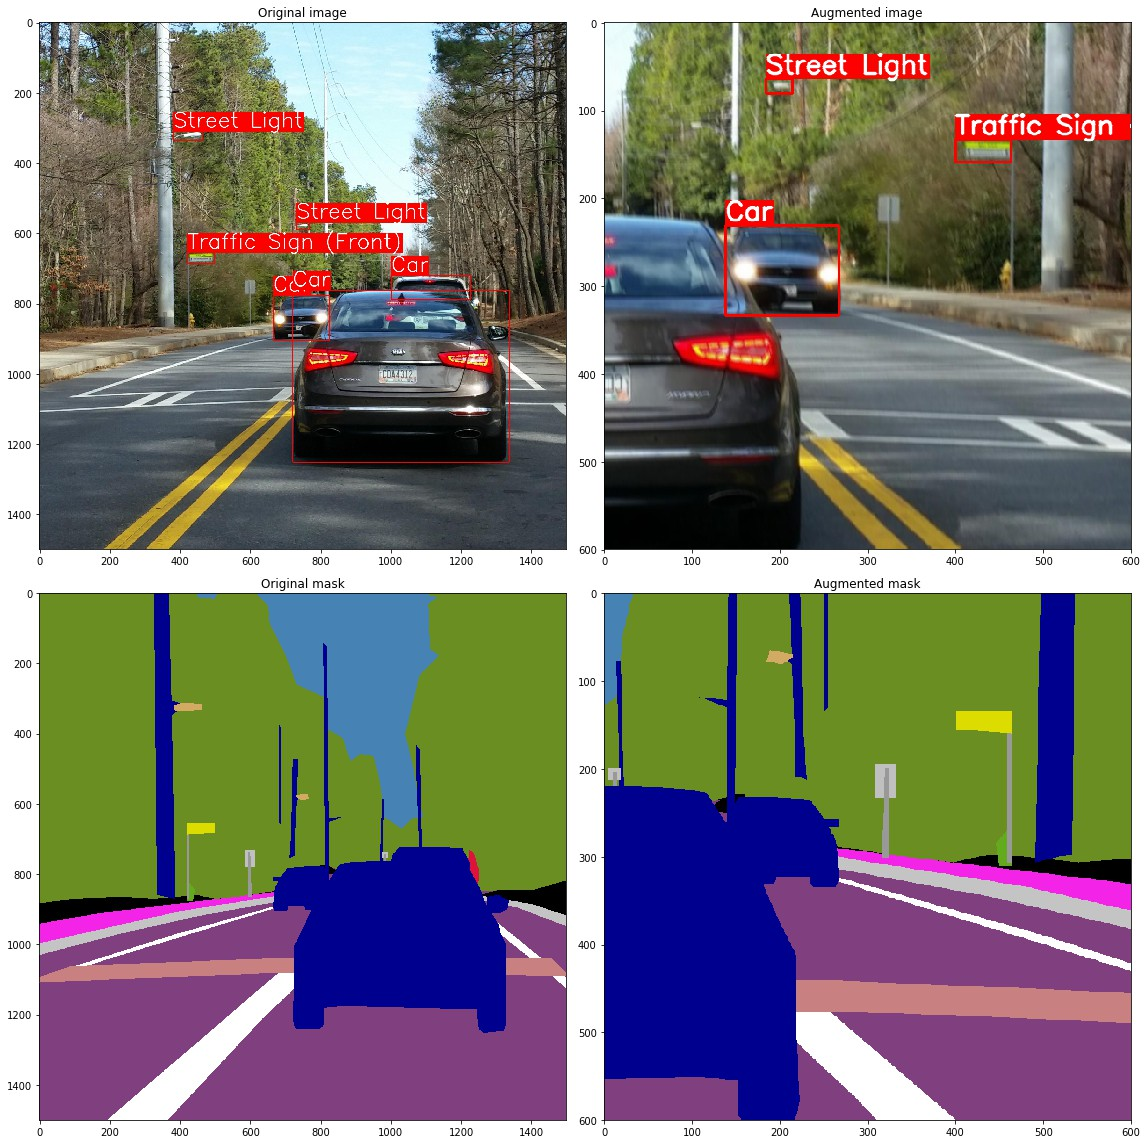
medium = A.Compose([
A.HorizontalFlip(p=1),
A.RandomSizedCrop((800 - 100, 800 + 100), 600, 600),
A.MotionBlur(blur_limit=37, p=1),
], bbox_params={'format':'coco', 'min_area': 1, 'min_visibility': 0.5, 'label_fields': ['category_id']}, p=1)
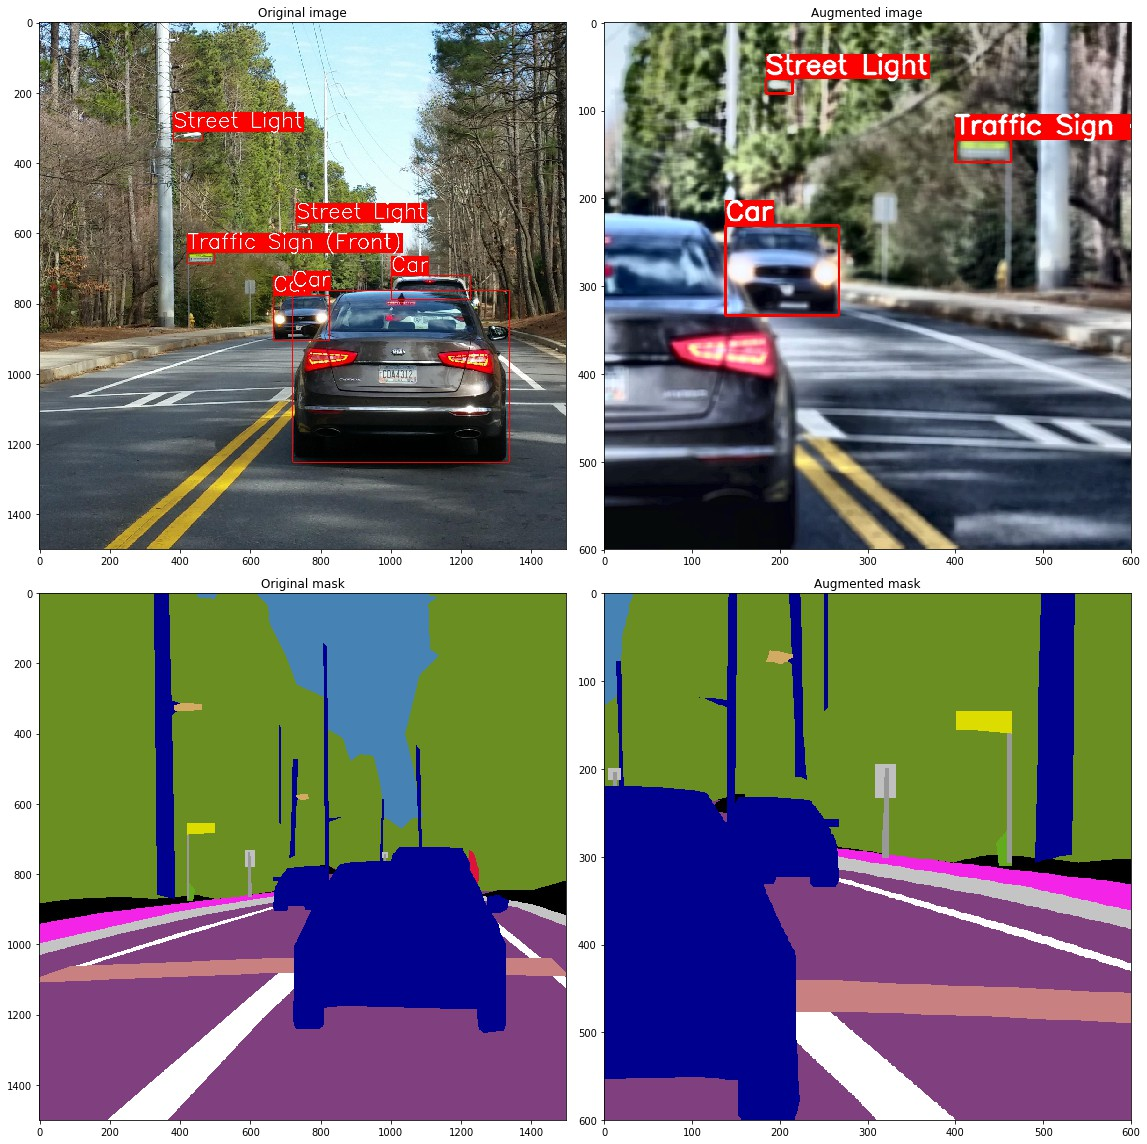
strong = A.Compose([
A.HorizontalFlip(p=1),
A.RandomSizedCrop((800 - 100, 800 + 100), 600, 600),
A.RGBShift(p=1),
A.Blur(blur_limit=11, p=1),
A.RandomBrightness(p=1),
A.CLAHE(p=1),
], bbox_params={'format':'coco', 'min_area': 1, 'min_visibility': 0.5, 'label_fields': ['category_id']}, p=1)
Streetscape data enhancement - light:
random.seed(13)
res = augment_and_show(light, image, labels, bboxes,
                       instance_labels, titles, thickness=2,
                       font_scale_orig=2, font_scale_aug=1)
Street view data enhancement - medium:
random.seed(13)
res = augment_and_show(medium, image, labels, bboxes,
                       instance_labels, titles, thickness=2,
                       font_scale_orig=2, font_scale_aug=1)
Street view data enhancement - strong:
random.seed(13)
res = augment_and_show(strong, image, labels, bboxes,
                       instance_labels, titles, thickness=2,
                       font_scale_orig=2, font_scale_aug=1)
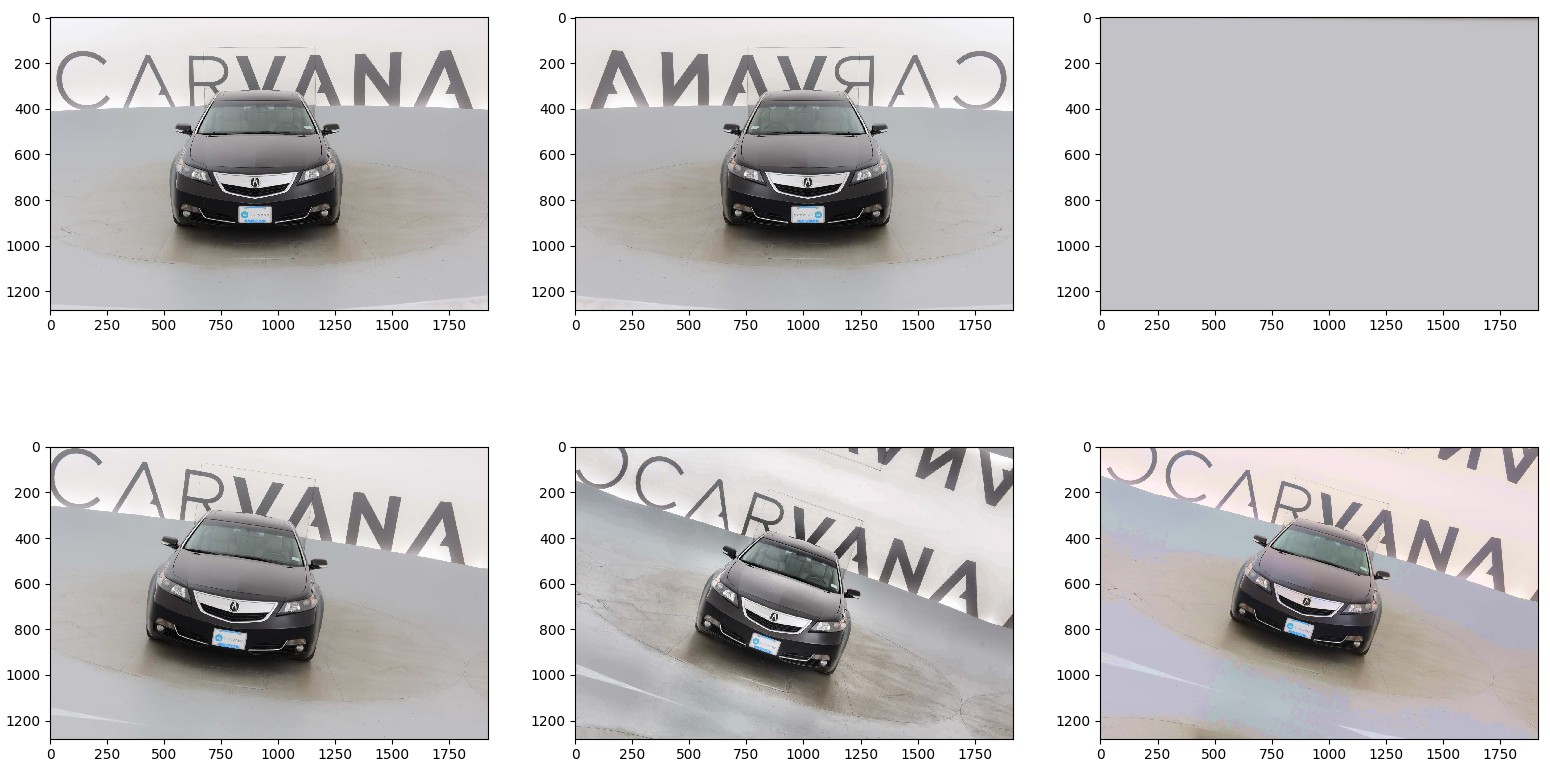
4.2 Classification example
import numpy as np
import cv2
import matplotlib.pyplot as plt
from albumentations import (
HorizontalFlip, IAAPerspective, ShiftScaleRotate, CLAHE,
RandomRotate90, Transpose, ShiftScaleRotate, Blur,
OpticalDistortion, GridDistortion, HueSaturationValue,
IAAAdditiveGaussianNoise, GaussNoise, MotionBlur, MedianBlur,
IAAPiecewiseAffine, IAASharpen, IAAEmboss, RandomContrast,
RandomBrightness, Flip, OneOf, Compose
)
def augment_and_show(aug, image):
image = aug(image=image)['image']
plt.figure(figsize=(10, 10))
plt.imshow(image)
image = cv2.imread('test.jpg')
image = cv2.cvtColor(image, cv2.COLOR_BGR2RGB)
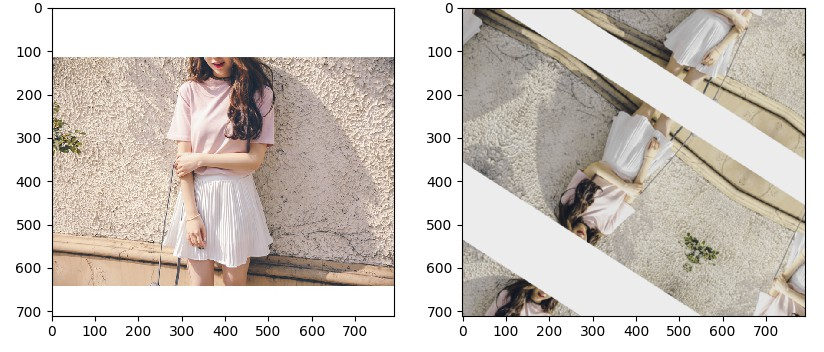
plt.subplot(2, 2, 1)
plt.imshow(image)
plt.subplot(2, 2, 2)
aug = HorizontalFlip(p=1)
image_aug1 = aug(image=image)['image']
plt.imshow(image_aug1)
plt.subplot(2, 2, 3)
aug = IAAPerspective(scale=0.2, p=1)
image_aug2 = aug(image=image)['image']
plt.imshow(image_aug2)
plt.subplot(2, 2, 4)
aug = ShiftScaleRotate(p=1)
image_aug3 = aug(image=image)['image']
plt.imshow(image_aug3)
plt.show()
def augment_flips_color(p=.5):
return Compose([
CLAHE(),
RandomRotate90(),
Transpose(),
ShiftScaleRotate(shift_limit=0.0625,
scale_limit=0.50,
rotate_limit=45, p=.75),
Blur(blur_limit=3),
OpticalDistortion(),
GridDistortion(),
HueSaturationValue()
], p=p)
aug = augment_flips_color(p=1)
image_aug = aug(image=image)['image']
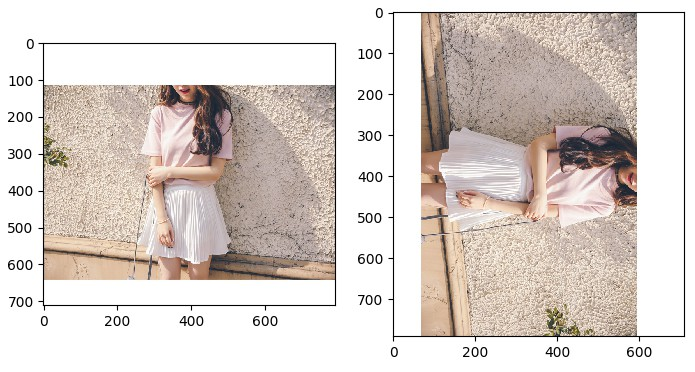
plt.subplot(1, 2, 1)
plt.imshow(image)
plt.subplot(1, 2, 2)
plt.imshow(image_aug)
plt.show()
def strong_aug(p=.5):
    return Compose([
        RandomRotate90(),
        Flip(),
        Transpose(),
        OneOf([
            IAAAdditiveGaussianNoise(),
            GaussNoise(),
        ], p=0.2),
        OneOf([
            MotionBlur(p=.2),
            MedianBlur(blur_limit=3, p=.1),
            Blur(blur_limit=3, p=.1),
        ], p=0.2),
        ShiftScaleRotate(shift_limit=0.0625, scale_limit=0.2, rotate_limit=45, p=.2),
        OneOf([
            OpticalDistortion(p=0.3),
            GridDistortion(p=.1),
            IAAPiecewiseAffine(p=0.3),
        ], p=0.2),
        OneOf([
            CLAHE(clip_limit=2),
            IAASharpen(),
            IAAEmboss(),
            RandomContrast(),
            RandomBrightness(),
        ], p=0.3),
        HueSaturationValue(p=0.3),
    ], p=p)

aug = strong_aug(p=1)
image_aug = aug(image=image)['image']

plt.subplot(1, 2, 1)
plt.imshow(image)
plt.subplot(1, 2, 2)
plt.imshow(image_aug)
plt.show()
4.3 Object Detection example
# Import relevant libraries and define visualization functions

import os
import numpy as np
import cv2
from matplotlib import pyplot as plt
from urllib.request import urlopen

from albumentations import (
    HorizontalFlip,
    VerticalFlip,
    Resize,
    CenterCrop,
    RandomCrop,
    Crop,
    Compose
)


# Visualization function for bounding boxes and category labels on pictures
BOX_COLOR = (255, 0, 0)
TEXT_COLOR = (255, 255, 255)

def visualize_bbox(img, bbox, class_id, class_idx_to_name, color=BOX_COLOR, thickness=2):
    x_min, y_min, w, h = bbox
    x_min, x_max, y_min, y_max = int(x_min), int(x_min + w), int(y_min), int(y_min + h)
    cv2.rectangle(img, (x_min, y_min), (x_max, y_max), color=color, thickness=thickness)
    class_name = class_idx_to_name[class_id]
    ((text_width, text_height), _) = cv2.getTextSize(class_name, cv2.FONT_HERSHEY_SIMPLEX, 0.35, 1)
    cv2.rectangle(img, (x_min, y_min - int(1.3 * text_height)), (x_min + text_width, y_min), BOX_COLOR, -1)
    cv2.putText(img, class_name, (x_min, y_min - int(0.3 * text_height)), cv2.FONT_HERSHEY_SIMPLEX, 0.35,TEXT_COLOR, lineType=cv2.LINE_AA)
    return img


def visualize(annotations, category_id_to_name):
    img = annotations['image'].copy()
    for idx, bbox in enumerate(annotations['bboxes']):
        img = visualize_bbox(img, bbox, annotations['category_id'][idx], category_id_to_name)
    plt.figure(figsize=(12, 12))
    plt.imshow(img)
    plt.imshow()
For detection problems, bbox must be defined in the specified format_ params. There are two supported formats: coco and pascal_voc.
coco's bounding box format is: [x_min, y_min, width, height], e.g. [97, 12, 150, 200]
pascal_ The bounding box format of VOC is: [x_min, y_min, x_max, y_max], e.g. [97, 12, 247, 212]
def get_aug(aug, min_area=0., min_visibility=0.):
return Compose(aug, bbox_params={'format': 'coco', 'min_area': min_area, 'min_visibility': min_visibility, 'label_fields': ['category_id']})
def download_image(url):
data = urlopen(url).read()
data = np.frombuffer(data, np.uint8)
image = cv2.imdecode(data, cv2.IMREAD_COLOR)
image = cv2.cvtColor(image, cv2.COLOR_BGR2RGB)
return image
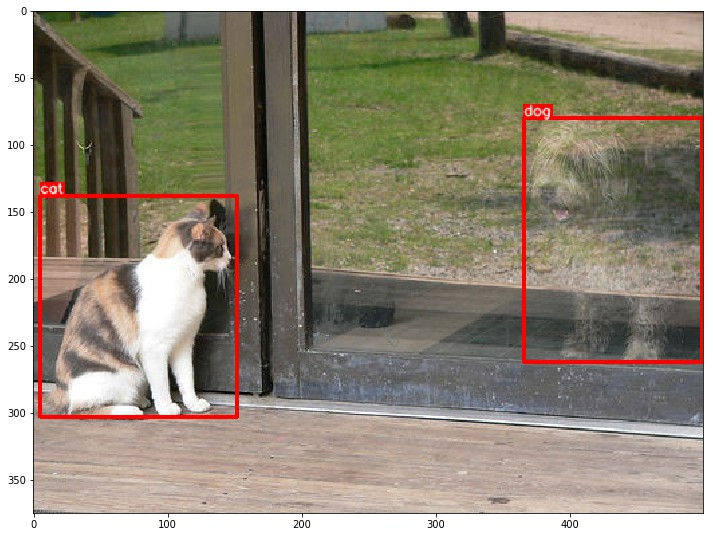
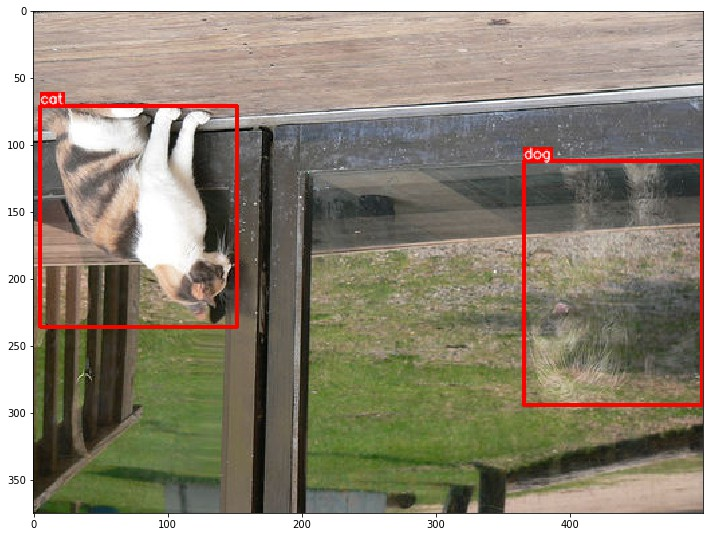
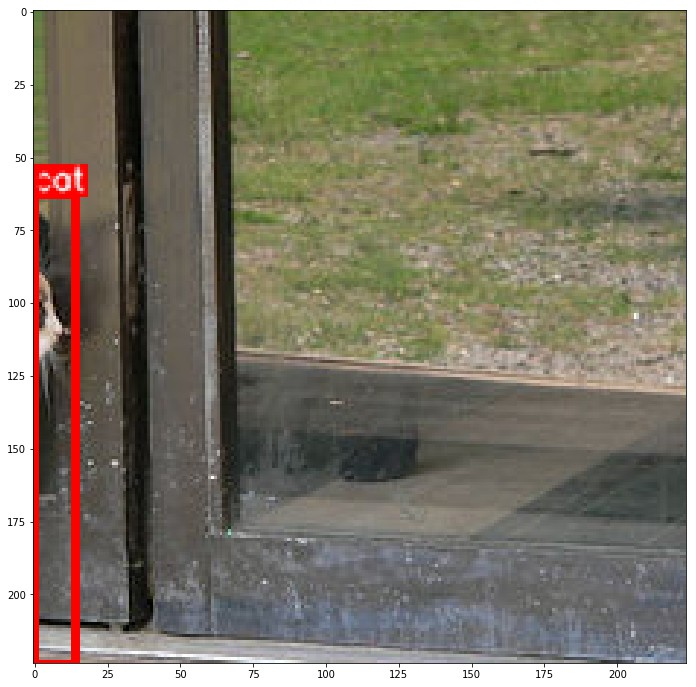
image = download_image('http://images.cocodataset.org/train2017/000000386298.jpg')
# Annotations for image 386298 from COCO http://cocodataset.org/#explore?id=386298
annotations = {'image': image, 'bboxes': [[366.7, 80.84, 132.8, 181.84], [5.66, 138.95, 147.09, 164.88]], 'category_id': [18, 17]}
category_id_to_name = {17: 'cat', 18: 'dog'}
Visual original annotation:
visualize(annotations, category_id_to_name)
Vertical flip enhancement:
aug = get_aug([VerticalFlip(p=1)])
augmented = aug(**annotations)
visualize(augmented, category_id_to_name)
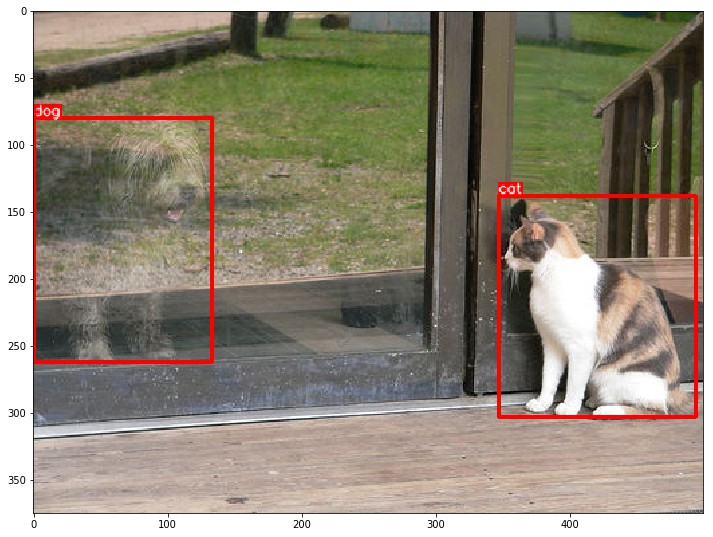
Horizontal flip enhancement:
aug = get_aug([HorizontalFlip(p=1)])
augmented = aug(**annotations)
visualize(augmented, category_id_to_name)
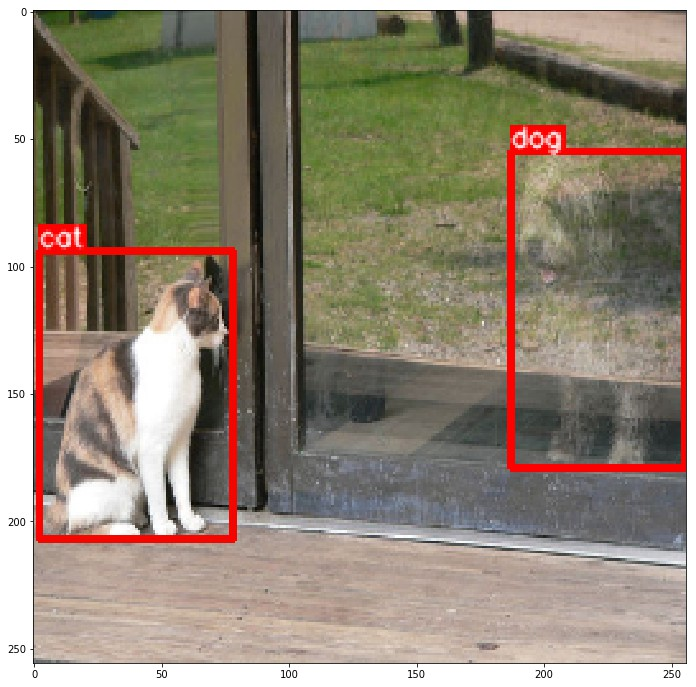
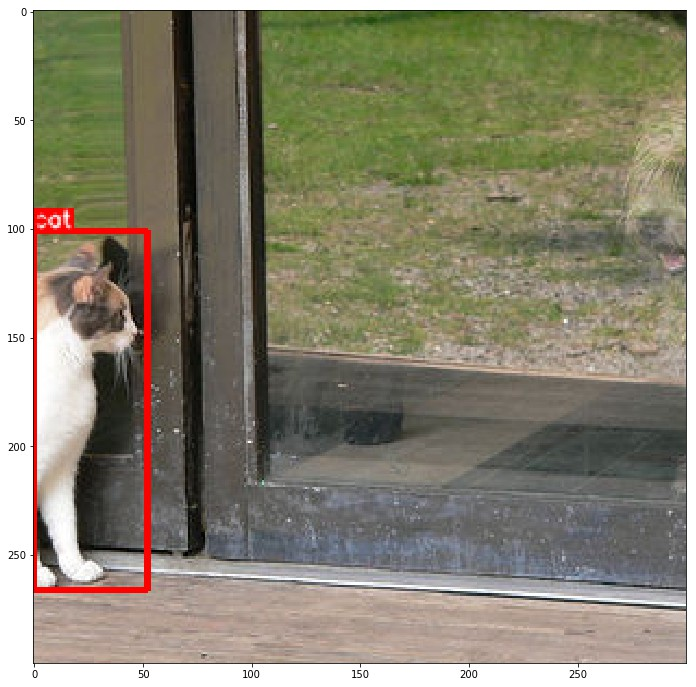
Resize data enhancement:
aug = get_aug([Resize(p=1, height=256, width=256)])
augmented = aug(**annotations)
visualize(augmented, category_id_to_name)
The augmentation library also supports cropping and deleting boxes It mainly includes two parameters: min_aera and min_visibility.
Default min_aera and min_ The visibility values are all 0, so only boxes beyond the picture size will be deleted
CenterCrop:
aug = get_aug([CenterCrop(p=1, height=300, width=300)])
augmented = aug(**annotations)
visualize(augmented, category_id_to_name)
CenterCrop with default filter:
aug = get_aug([CenterCrop(p=1, height=224, width=224)])
augmented = aug(**annotations)
print(augmented['category_id'])
visualize(augmented, category_id_to_name)
CenterCrop + filter with min_area:
aug = get_aug([CenterCrop(p=1, height=224, width=224)], min_area=4000)
augmented = aug(**annotations)
visualize(augmented, category_id_to_name)
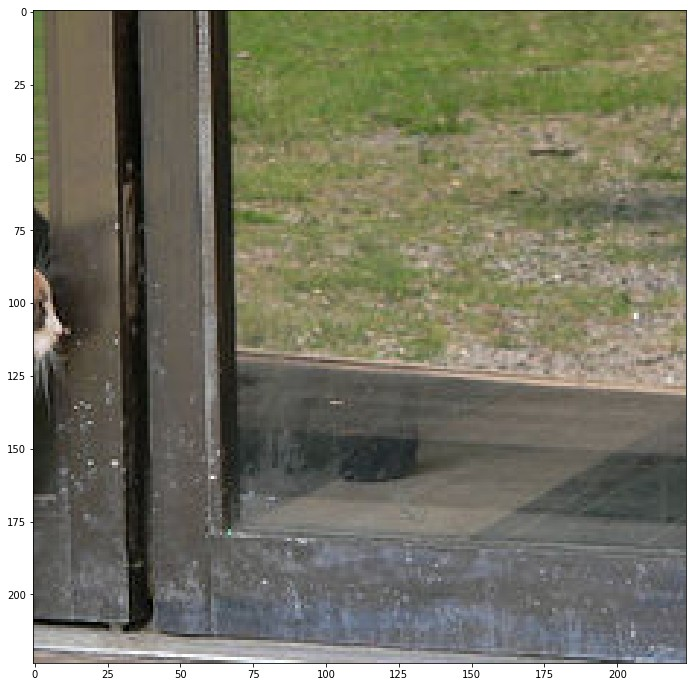
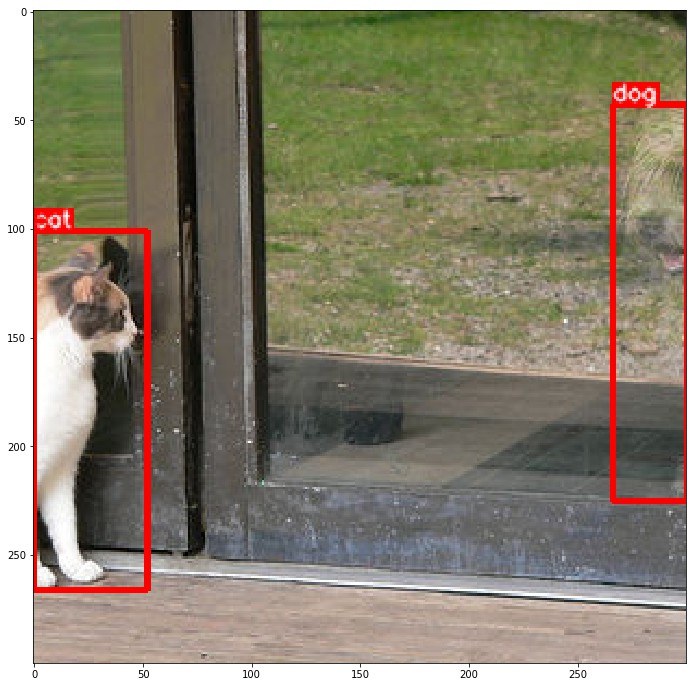
CenterCrop + filter by visibility:
# Only boxes with visibility greater than threshold after transformation are returned
aug = get_aug([CenterCrop(p=1, height=300, width=300)], min_visibility=0.3)
augmented = aug(**annotations)
visualize(augmented, category_id_to_name)

# As shown in the figure, after transformation, the box area of dog is about 25% of the original box, less than 0.3, so it is discarded
# After transformation, the box area of cat is about 36% of the original box, which is greater than 0.3, so it is retained
4.3 Segmentation example
Pictures and data from: TGS Salt Identification Challenge .
# Import related libraries and define visualization functions
import numpy as np
import cv2
from matplotlib import pyplot as plt

from albumentations import (
    PadIfNeeded,
    HorizontalFlip,
    VerticalFlip,
    CenterCrop,
    Crop,
    Compose,
    Transpose,
    RandomRotate90,
    ElasticTransform,
    GridDistortion,
    OpticalDistortion,
    RandomSizedCrop,
    OneOf,
    CLAHE,
    RandomContrast,
    RandomGamma,
    RandomBrightness
)


def visualize(image, mask, original_image=None, original_mask=None):
    fontsize = 18

    if original_image is None and original_mask is None:
        f, ax = plt.subplots(2, 1, figsize=(8, 8))

        ax[0].imshow(image)
        ax[1].imshow(mask)
    else:
        f, ax = plt.subplots(2, 2, figsize=(8, 8))

        ax[0, 0].imshow(original_image)
        ax[0, 0].set_title('Original image', fontsize=fontsize)

        ax[1, 0].imshow(original_mask)
        ax[1, 0].set_title('Original mask', fontsize=fontsize)

        ax[0, 1].imshow(image)
        ax[0, 1].set_title('Transformed image', fontsize=fontsize)

        ax[1, 1].imshow(mask)
        ax[1, 1].set_title('Transformed mask', fontsize=fontsize)
    plt.show()


# Original drawing
image = cv2.imread('images/kaggle_salt/0fea4b5049_image.png')
mask = cv2.imread('images/kaggle_salt/0fea4b5049.png', 0)
print(image.shape, mask.shape)
original_height, original_width = image.shape[:2]
visualize(image, mask)
Padding:
The network structure of UNet type requires that the size of the input picture can be divided by the n power of 2. N is the number of maxpooling layers
In the original UNet structure, N=5, so the size of the input picture needs to be padded to the nearest size that can be divided by the 5th power of 2 = 32, i.e. 128
This operation can take PadIfNeeded Transform, which pad the four sides of image and mask at the same time
You can specify the type of padding, such as zero, constant, reflection The default is reflection
aug = PadIfNeeded(p=1, min_height=128, min_width=128)
augmented = aug(image=image, mask=mask)

image_padded = augmented['image']
mask_padded = augmented['mask']

print(image_padded.shape, mask_padded.shape)

visualize(image_padded, mask_padded, original_image=image, original_mask=mask)

CenterCrop and Crop:
aug = CenterCrop(p=1, height=original_height, width=original_width)
augmented = aug(image=image_padded, mask=mask_padded)

image_center_cropped = augmented['image']
mask_center_cropped = augmented['mask']

print(image_center_cropped.shape, mask_center_cropped.shape)

assert (image - image_center_cropped).sum() == 0
assert (mask - mask_center_cropped).sum() == 0

visualize(image_padded, mask_padded,
          original_image=image_center_cropped,
          original_mask=mask_center_cropped)
x_min = (128 - original_width) // 2
y_min = (128 - original_height) // 2

x_max = x_min + original_width
y_max = y_min + original_height

aug = Crop(p=1, x_min=x_min, x_max=x_max, y_min=y_min, y_max=y_max)
augmented = aug(image=image_padded, mask=mask_padded)

image_cropped = augmented['image']
mask_cropped = augmented['mask']

print(image_cropped.shape, mask_cropped.shape)

assert (image - image_cropped).sum() == 0
assert (mask - mask_cropped).sum() == 0

visualize(image_cropped, mask_cropped, original_image=image_padded, original_mask=mask_padded)
Lossless transformations
For satellite and remote sensing images and medical images, it is better to enhance the image without increasing or losing the image information
There are eight different ways to represent the same box on the plane
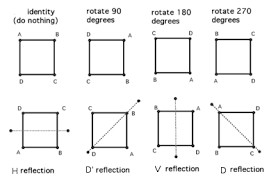
These eight data enhancements can be implemented by horizontalflip, verticalflip, transfer and randomrotate90
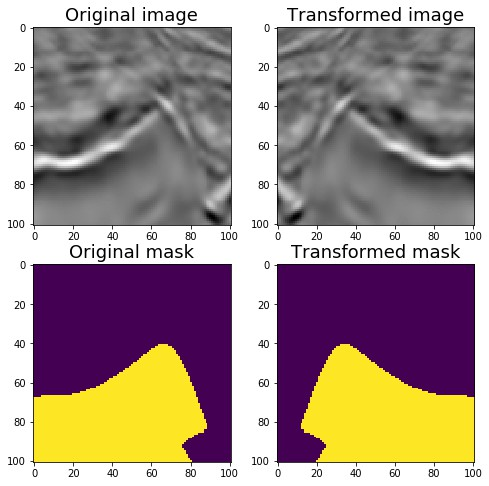
Flip horizontally:
aug = HorizontalFlip(p=1)
augmented = aug(image=image, mask=mask)

image_h_flipped = augmented['image']
mask_h_flipped = augmented['mask']

visualize(image_h_flipped, mask_h_flipped,
          original_image=image, original_mask=mask)
Flip vertically:
aug = VerticalFlip(p=1)
augmented = aug(image=image, mask=mask)

image_v_flipped = augmented['image']
mask_v_flipped = augmented['mask']

visualize(image_v_flipped, mask_v_flipped,
          original_image=image, original_mask=mask)
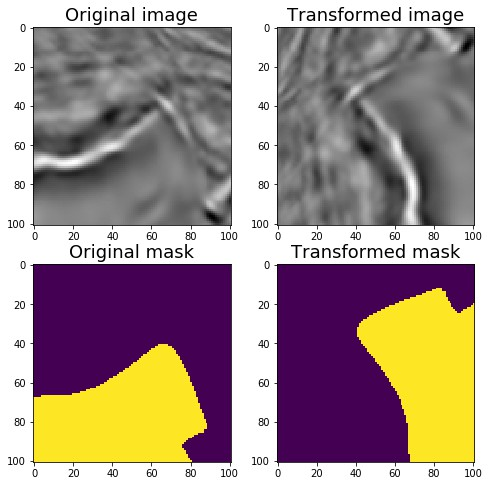
Random rotation 90 degrees:
# Random rotation 0, 90180270
aug = RandomRotate90(p=1)
augmented = aug(image=image, mask=mask)

image_rot90 = augmented['image']
mask_rot90 = augmented['mask']

visualize(image_rot90, mask_rot90,
          original_image=image, original_mask=mask)
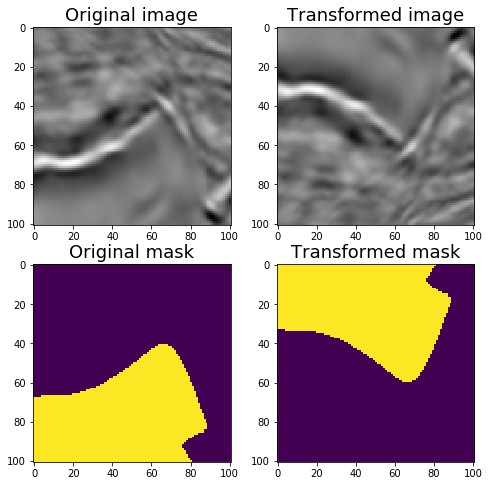
Transpose:
# Swap X and Y axes
aug = Transpose(p=1)
augmented = aug(image=image, mask=mask)

image_transposed = augmented['image']
mask_transposed = augmented['mask']

visualize(image_transposed, mask_transposed,
          original_image=image, original_mask=mask)
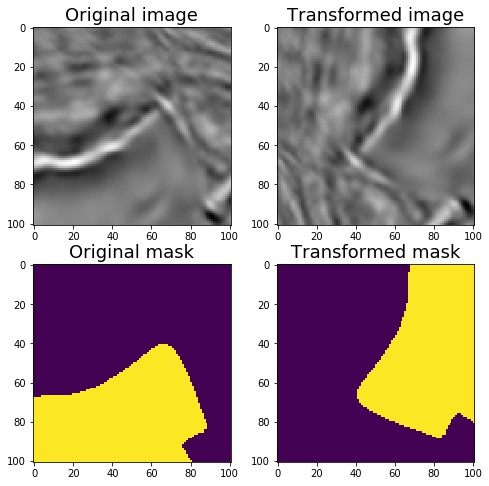
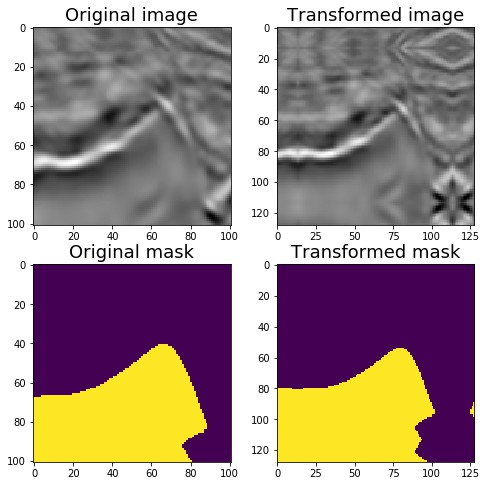
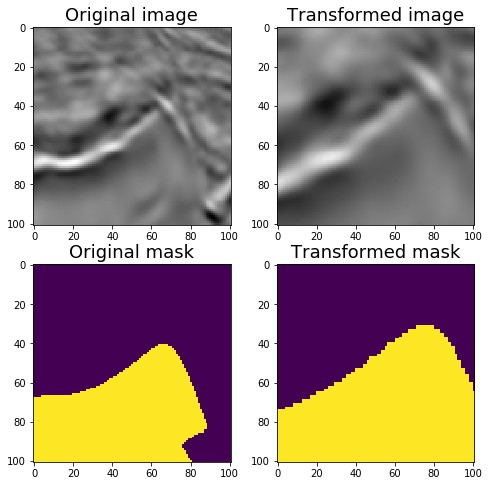
Non rigid transformations: elastic transformation, mesh deformation, optical distortion
In medical image problems, non - rigid transformation is helpful for data enhancement
Elastic transform
aug = ElasticTransform(p=1,
                       alpha=120,
                       sigma=120 * 0.05,
                       alpha_affine=120 * 0.03)
augmented = aug(image=image, mask=mask)

image_elastic = augmented['image']
mask_elastic = augmented['mask']

visualize(image_elastic, mask_elastic,
          original_image=image, original_mask=mask)
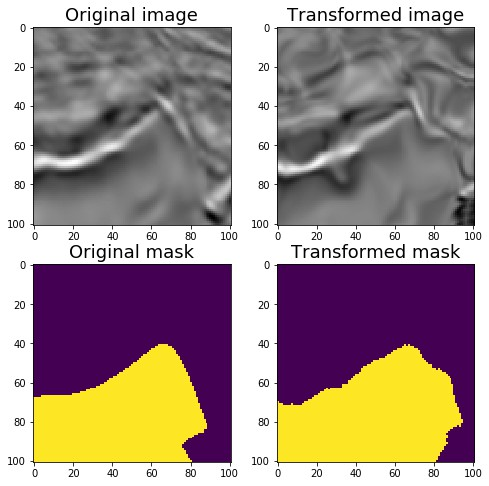
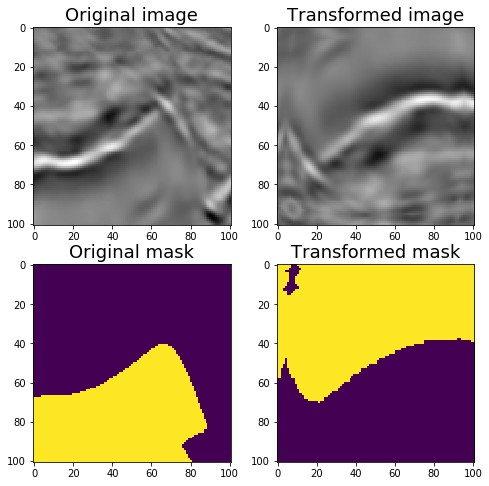
Mesh deformation GridDistortion:
aug = GridDistortion(p=1)
augmented = aug(image=image, mask=mask)

image_grid = augmented['image']
mask_grid = augmented['mask']

visualize(image_grid, mask_grid,
          original_image=image, original_mask=mask)
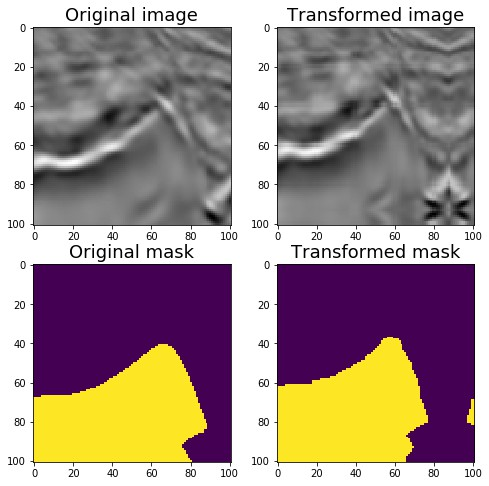
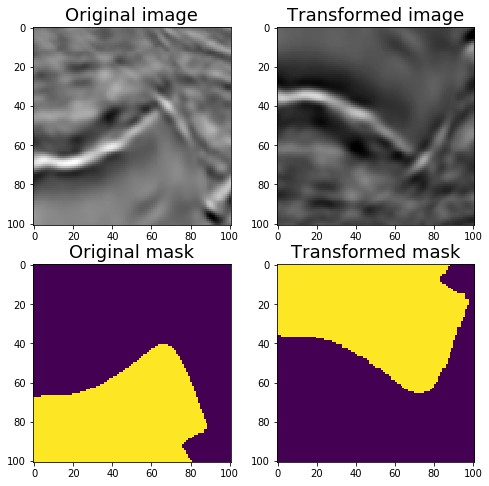
Optical distortion:
aug = OpticalDistortion(p=1, distort_limit=2, shift_limit=0.5)
augmented = aug(image=image, mask=mask)

image_optical = augmented['image']
mask_optical = augmented['mask']

visualize(image_optical, mask_optical,
          original_image=image, original_mask=mask)
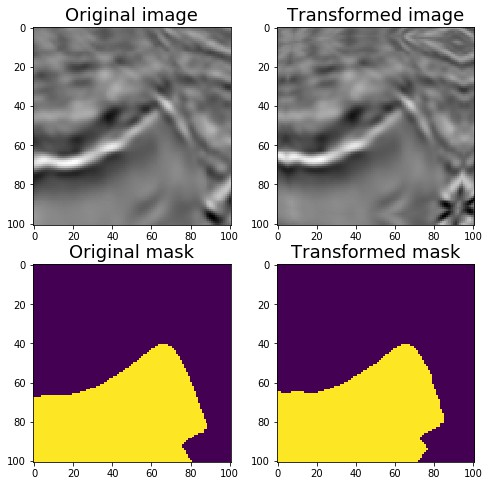
RandomSizedCrop:
RandomCrop and RandomScale combination
aug = RandomSizedCrop(p=1,
                      min_max_height=(50, 101),
                      height=original_height,
                      width=original_width)
augmented = aug(image=image, mask=mask)

image_scaled = augmented['image']
mask_scaled = augmented['mask']

visualize(image_scaled, mask_scaled,
          original_image=image, original_mask=mask)
Data enhancement - Light, non destructive augmentations:
aug = Compose([VerticalFlip(p=0.5),
              RandomRotate90(p=0.5)])

augmented = aug(image=image, mask=mask)

image_light = augmented['image']
mask_light = augmented['mask']

visualize(image_light, mask_light,
          original_image=image, original_mask=mask)

Data enhancement - Medium:
aug = Compose([
    OneOf([RandomSizedCrop(min_max_height=(50, 101),
                           height=original_height,
                           width=original_width, p=0.5),
          PadIfNeeded(min_height=original_height,
                      min_width=original_width, p=0.5)], p=1),
    VerticalFlip(p=0.5),
    RandomRotate90(p=0.5),
    OneOf([ElasticTransform(p=0.5,
                            alpha=120,
                            sigma=120 * 0.05,
                            alpha_affine=120 * 0.03),
        GridDistortion(p=0.5),
        OpticalDistortion(p=1,
                          distort_limit=1,
                          shift_limit=0.5)
        ], p=0.8)])

augmented = aug(image=image, mask=mask)

image_medium = augmented['image']
mask_medium = augmented['mask']

visualize(image_medium, mask_medium,
          original_image=image, original_mask=mask)
Data enhancement - Strong:
Add CLAHE, RandomBrightness, RandomContrast, RandomGamma, etc. only non spatial transformation processing is performed on the picture, not mask processing
aug = Compose([
    OneOf([RandomSizedCrop(min_max_height=(50, 101),
                           height=original_height,
                           width=original_width, p=0.5),
          PadIfNeeded(min_height=original_height,
                      min_width=original_width, p=0.5)], p=1),
    VerticalFlip(p=0.5),
    RandomRotate90(p=0.5),
    OneOf([ElasticTransform(p=0.5,
                            alpha=120,
                            sigma=120 * 0.05,
                            alpha_affine=120 * 0.03),
        GridDistortion(p=0.5),
        OpticalDistortion(p=1, distort_limit=2, shift_limit=0.5)
        ], p=0.8),
    CLAHE(p=0.8),
    RandomContrast(p=0.8),
    RandomBrightness(p=0.8),
    RandomGamma(p=0.8)])

augmented = aug(image=image, mask=mask)

image_heavy = augmented['image']
mask_heavy = augmented['mask']

visualize(image_heavy, mask_heavy, original_image=image, original_mask=mask)
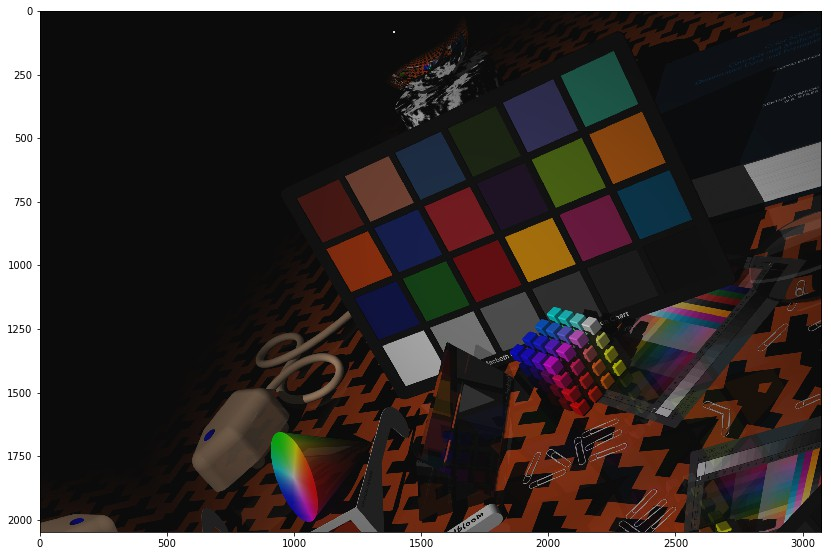
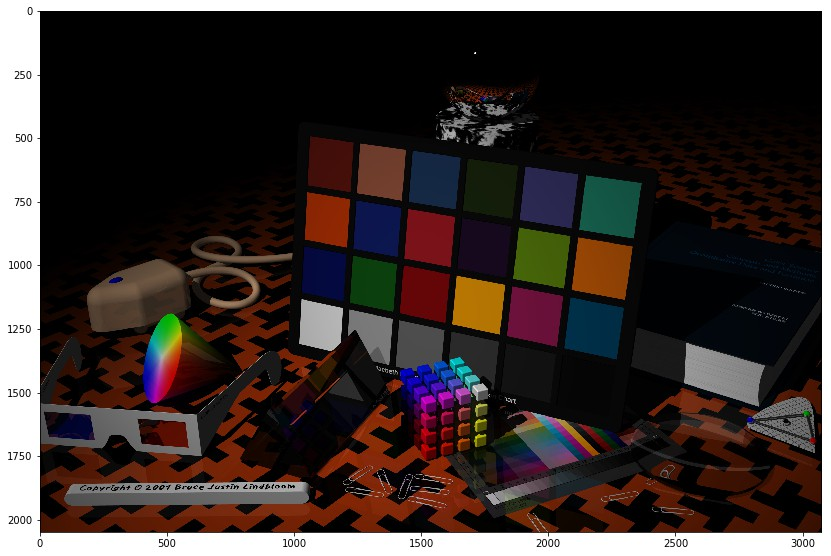
4.4 Non-8-bit images example
from io import BytesIO
from zipfile import ZipFile
from urllib.request import urlopen

import cv2
import numpy as np
from matplotlib import pyplot as plt

from albumentations import (
    Compose, ToFloat, FromFloat, RandomRotate90,
    Flip, OneOf, MotionBlur, MedianBlur, Blur,
    ShiftScaleRotate, OpticalDistortion, GridDistortion,
    RandomContrast, RandomBrightness, HueSaturationValue,
)

# Download 16 bit TIFF pictures
url = urlopen("http://www.brucelindbloom.com/downloads/DeltaE_16bit_gamma1.0.tif.zip")
zipfile = ZipFile(BytesIO(url.read()))
zip_names = zipfile.namelist()
file_name = zip_names.pop()
extracted_file = zipfile.open(file_name)
data = np.frombuffer(extracted_file.read(), np.uint16)

img = cv2.imdecode(data, cv2.IMREAD_UNCHANGED)
img = cv2.cvtColor(img, cv2.COLOR_BGR2RGB)

# OpenCV may read incorrectly some TIFF files.
# Consider using `tifffile` - https://github.com/blink1073/tifffile

print(img.dtype)
# dtype('uint16')

# Divide all values by 65535 so we can display the image using matplotlib
plt.imshow(img / 65535)
plt.show()
def strong_tiff_aug(p=.5):
    return Compose([
        # Calculations supports uint8 and float32 inputs
        # For float32, all values must be between [0.0, 1.0]
        # Before data enhancement transformation, first perform 'ToFloat()' processing to convert the image into float32 ndarray
        ToFloat(),

        # Or specify the maximum value entered
        # ToFloat(max_value=65535.0),

        # Then perform data enhancement
        RandomRotate90(),
        Flip(),
        OneOf([
            MotionBlur(p=0.2),
            MedianBlur(blur_limit=3, p=0.1),
            Blur(blur_limit=3, p=0.1),
        ], p=0.2),
        ShiftScaleRotate(shift_limit=0.0625,
                         scale_limit=0.2,
                         rotate_limit=45, p=.2),
        OneOf([
            OpticalDistortion(p=0.3),
            GridDistortion(p=0.1),
        ], p=0.2),
        OneOf([
            RandomContrast(),
            RandomBrightness(),
        ], p=0.3),
        HueSaturationValue(hue_shift_limit=20,
                           sat_shift_limit=0.1,
                           val_shift_limit=0.1, p=0.3),

        # You can use 'FromFloat' to convert the enhanced image to the original data type
        # FromFloat(dtype='uint16'),

        # You can specify ` max_value `, then all values will be multiplied by the value
        # FromFloat(dtype='uint16', max_value=65535.0),
    ], p=p)

augmentation = strong_tiff_aug(p=0.9)
augmented = augmentation(image=img)
plt.figure(figsize=(14, 14))
plt.imshow(augmented['image'])
plt.show()