catalogue
User registration and login page
The histogram shows the winning rate information of each team:
The pie chart shows the number of games played by each team
The line chart shows the average score of each team
Implementation of administrator operation
preface
A few months ago, the author published a crawler article to get the information of Tiger flutter's NBA events( Portal ). But so much data can only be seen by yourself, which is of course a little boring, so now the author is based on node JS made a front-end website. The website realizes the user's registration and login operations. Users can log in to the website to retrieve the game information of the team they want to see, and can also view the winning rate map, game number map and average score map of each team; At the same time, the website also realizes the administrator identity, and the administrator's registration information is inserted from the local database (if you want to be an administrator, you have to pass me first!), The administrator can view the registration information of all users, view the user's operation log, and deactivate the user account. Let's take a look at the process of making web pages!
On the effect!
NBA crawler data front-end web page display
User registration and login page
First, we should prepare the background image of the page and write the css style to be used.

*{
    margin: 0;
    padding: 0;
}
body
{
    background-image: url(./pictures/background.jpg);
    background-size: cover;
    background-position:top;
    font-family: sans-serif;

}
.form .login-page
{
    width: 360px;
    padding: 10% 0 0;
    margin: auto;
}
.form
{
    position: relative;
    top: 150px;
    z-index: 1;
    background: rgb(205, 186, 226);
    max-width: 360px;
    margin: 0 auto 100px;
    padding: 45px;
    text-align: center;
}
.form input
{
    outline: none;
    background: #f2f2f2;
    width: 100%;
    border: 0;
    margin: 0 0 15px;
    padding: 15px;
    box-sizing: border-box;
    font-size: 14px;
}
.form button
{
    text-transform: uppercase;
    outline: 0;
    background: orange;
    width: 100%;
    border: none;
    padding: 15px;
    color: #fff;
    font-size: 14px;
    cursor: pointer;
    transition: .5s;
}
.form button:hover,.form button:active
{
    background: green;
    border: none;
}
.form .message a
{
    color: rgb(240, 17, 17);
    text-decoration: none;
}
.register-form
{
    display: none;
}
These are the preparatory work, and then we can start writing the front-end code of our html page.
The front-end code needs to implement two modules, login and registration.
<!--Register-->
<form class="register-form" method="POST" id="register-form" role="form">
<div class="form-group">
<input type="text" ng-model="add_username" tabindex="1" class="form-control" placeholder="User Name">
</div>
<div class="form-group">
<input type="password" ng-model="add_password" tabindex="2" class="form-control" placeholder="Password">
</div>
<div class="form-group">
<input type="password" ng-model="confirm_password" tabindex="2" class="form-control" placeholder="Confirm Your Password">
</div>
<div class="form-group">
<div class="row">
<div class="col-sm-6 col-sm-offset-3">
<button type="button" id="register-submit" tabindex="4" class="form-control" ng-click="doAdd()">Register</button>
</div>
</div>
</div>
<p class="massage">Already Registered ? <a href="#">Login</a></p>
</form>
<!--Login-->
<form class="login-form" method="POST" id="login-form" role="form">
<div class="form-group">
<input type="text" ng-model="username" tabindex="1" class="form-control" placeholder="User Name" name="username">
</div>
<div class="form-group">
<input type="password" ng-model="password" tabindex="2" placeholder="Password" name="password">
</div>
<div class="form-group">
<div class="row">
<div class="col-sm-6 col-sm-offset-3">
<button type="button" id="login-submit" tabindex="4" class="form-control" ng-click="check_pwd()">Login</button>
</div>
</div>
</div>
<p class="massage">Not Registered ? <a href="#">Register</a></p>
<p class="massage alert alert-warning" ng-if="msg && msg!='ok'">
<a href="#" class="close" data-dismiss="alert">×</a>
<strong>Warning!</strong>{{msg}}
</p>
</form>Then we need to switch between login and registration on the same page, so we use this code (provided that the jQuery module is introduced):
$('.massage a').click(function() {
    $('form').animate({height:"toggle", opacity:"toggle"}, "slow");
});
No, let's go directly to the renderings:
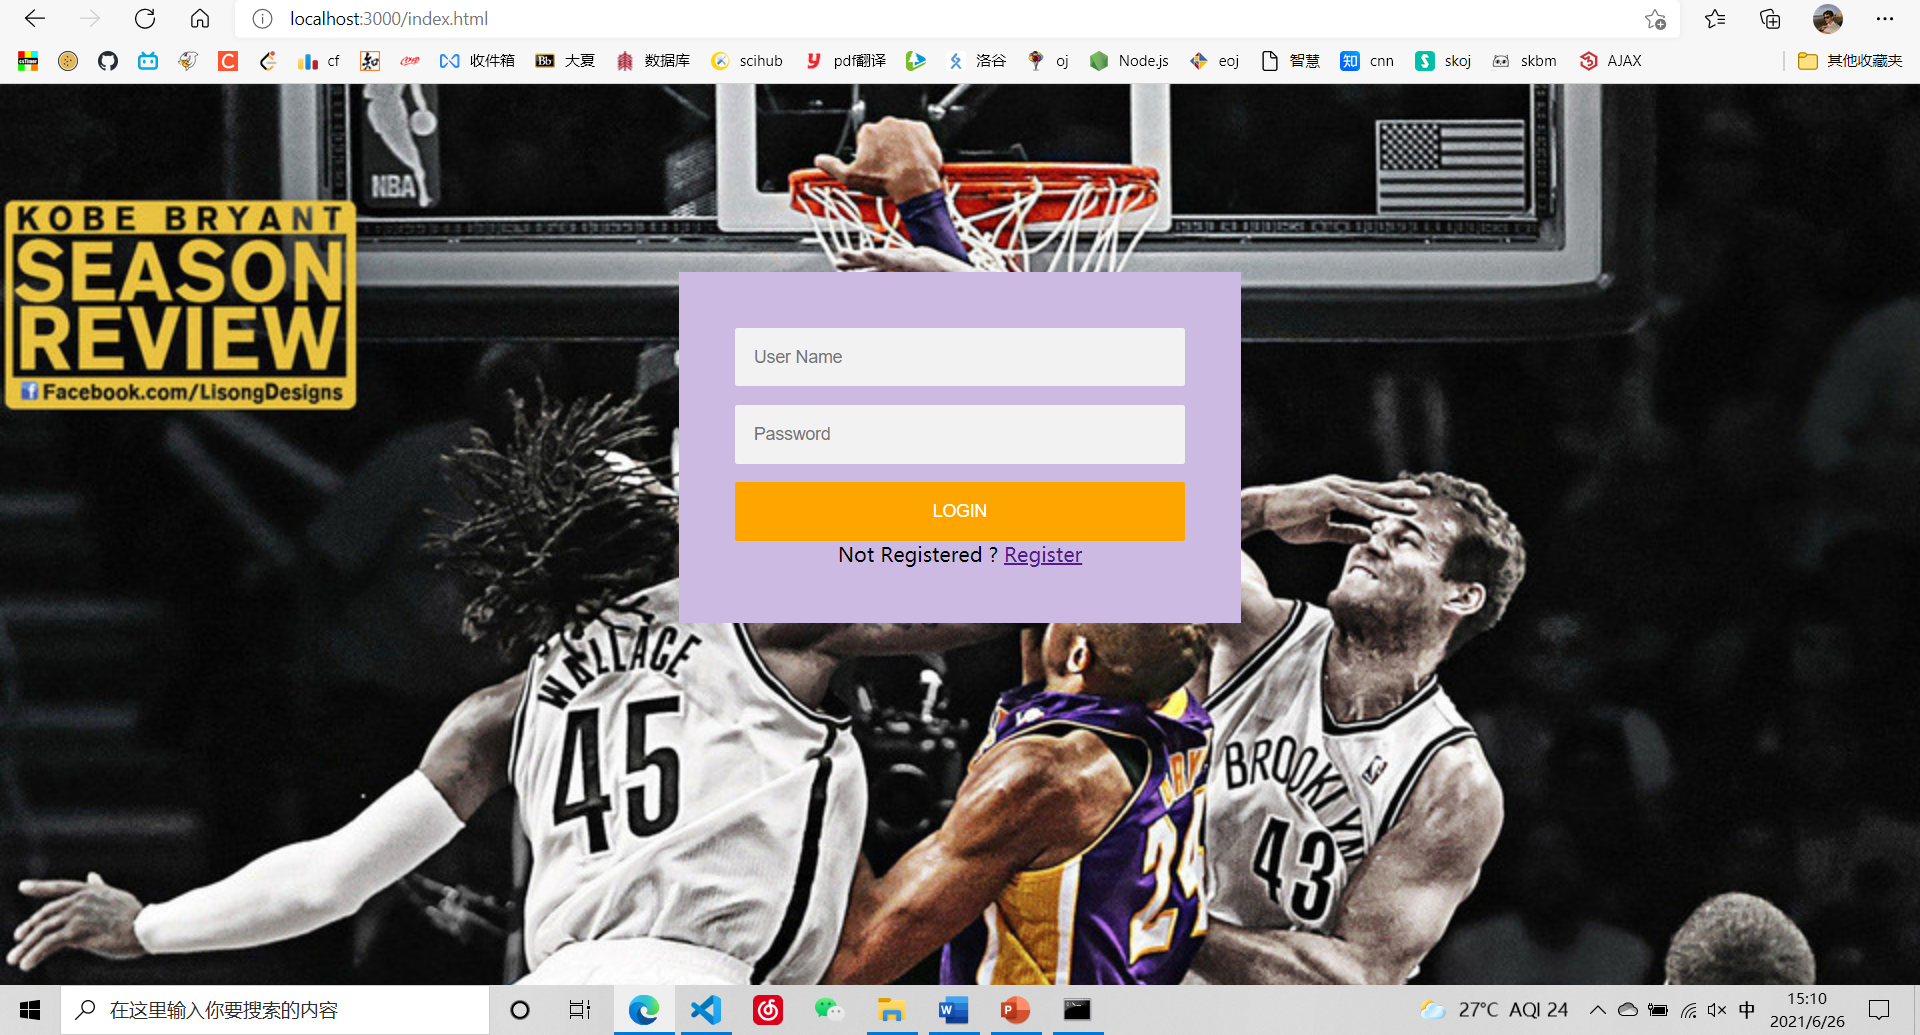
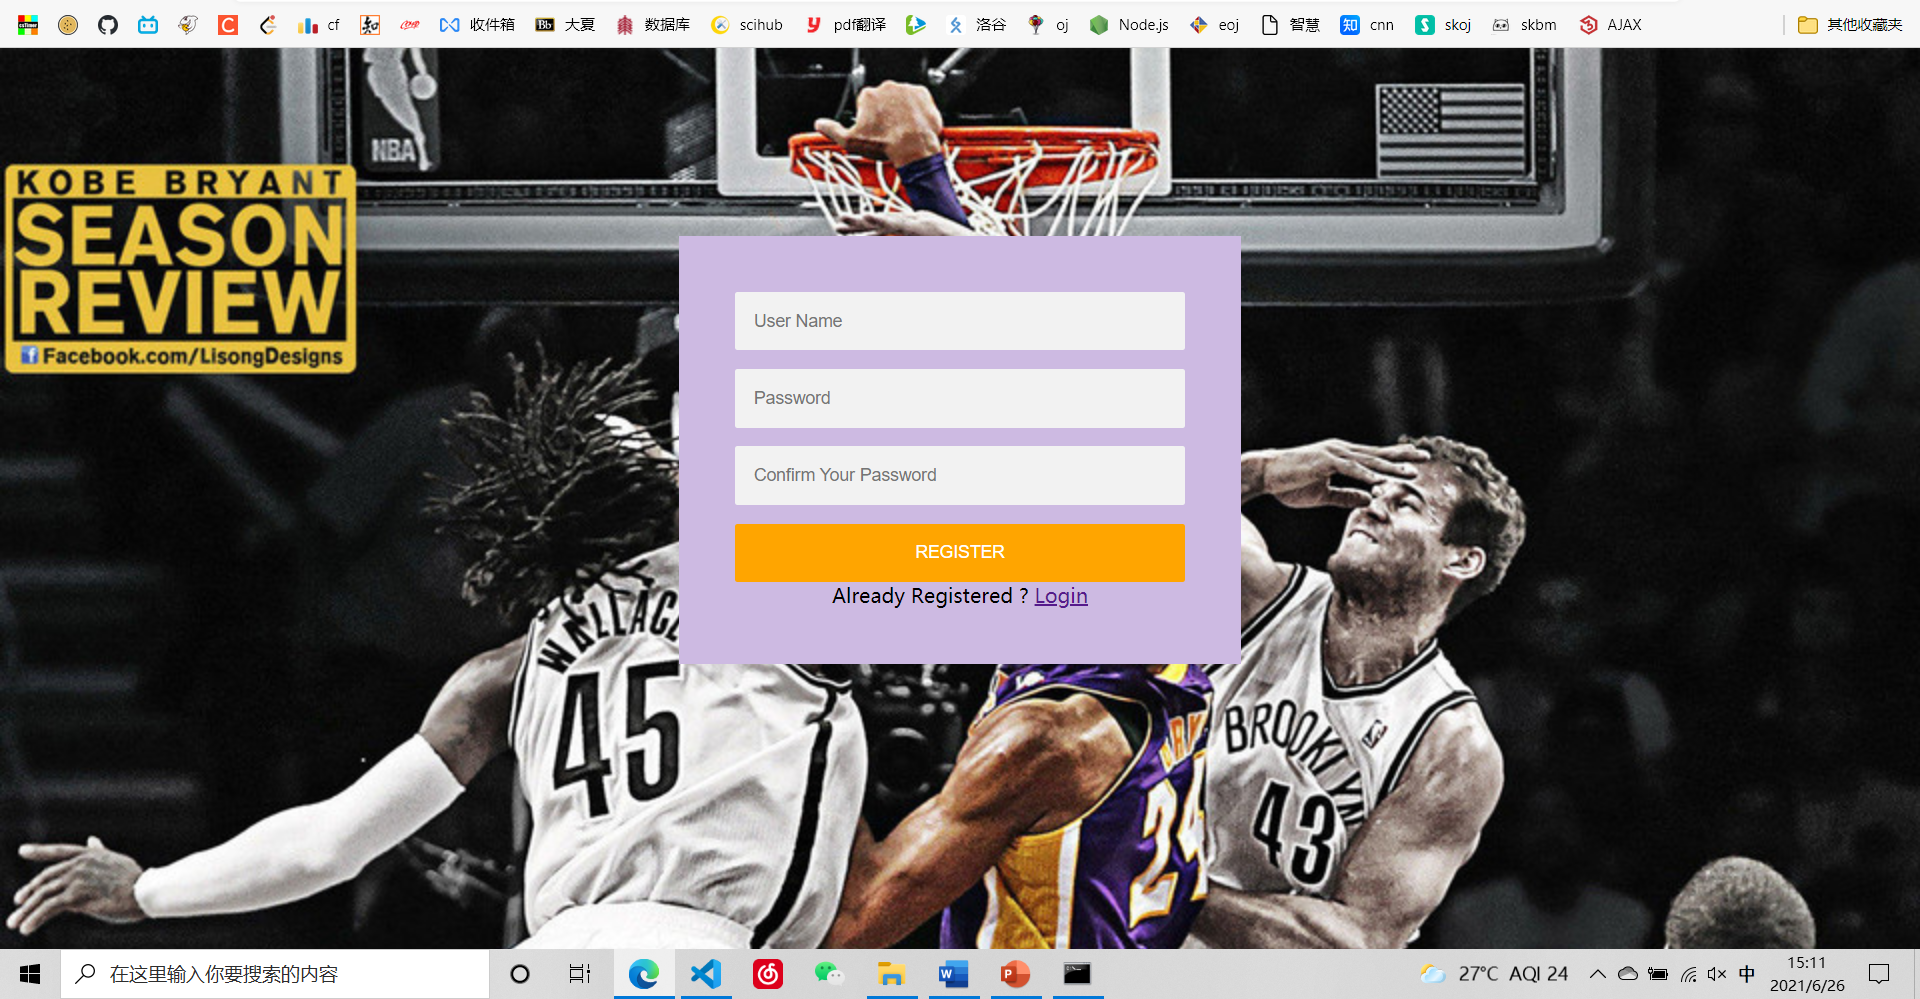
Due to the universal css, the two interfaces switch smoothly, and the mouse hovers over the button to highlight it. Then connect the front and back ends through angular and express, write the user's registration information into the mysql database, or verify the user's password from the database.
Retrieve team information
After successful login, we will enter competition HTML page.
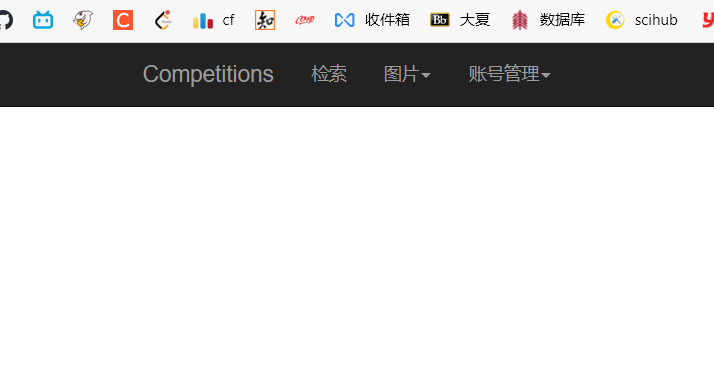
Click search and the following screen will appear.
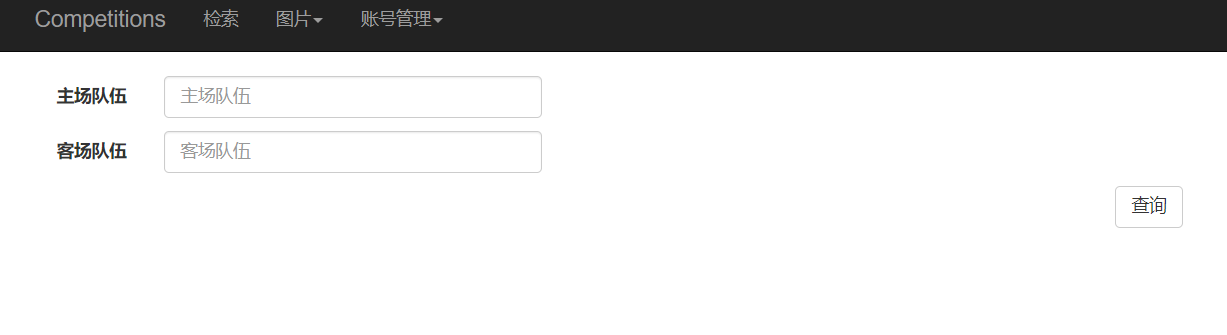
Here is a hiding and displaying of html elements. The code is as follows:
<div ng-show="isShow" style="width: 1300px;position:relative; top:70px;left: 80px">
<!--    Query page-->
    <div ng-include="'search.html'"></div>
</div>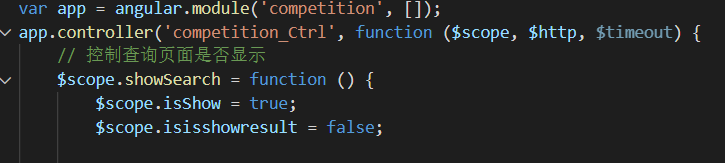
Use false and true of the show attribute to control whether the label is displayed or not.
The back end can capture the team name entered by the user, and then transfer it to mysql for retrieval.
// Query data (retrieved according to the host and guest teams)
    $scope.search = function () {
        var team = $scope.team;
        var oppo = $scope.oppo;

        // The user may not enter a team name, and all data will be found by default
        var myurl = `/competitions/search?t1=${team}&op=${oppo}`;

        $http.get(myurl).then(
            function (res) {
                if(res.data.message=='data'){
                    $scope.isisshowresult = true; //Display table query results
                    $scope.initPageSort(res.data.result)
                }else {
                    window.location.href=res.data.result;
                }


            },function (err) {
                $scope.msg = err.data;
            });
    };

//Another file ↓

router.get('/search', function(request, response) {
    console.log(request.session['username']);
    //sql strings and parameters
    if (request.session['username']===undefined) {
        response.json({message:'url',result:'/index.html'});
    }else {
        var param = request.query;
        compDAO.search(param,function (err, result, fields) {
            response.json({message:'data',result:result});
        })
    }
});

//Another file ↓

search :function(searchparam, callback) {
        // Combined query criteria
        var sql = 'select team,ground,scores,record,oppo,ground_op,'+
        'opScores,opRecord,time,timeCost,location,'+
        'numsOfAd,shoot,three_point,penalty,frontcourt,'+
        'backcourt,backboard,assist,foul,steal,mistake,cover from myfetches ';

        if(searchparam["t1"]!="undefined"){
            sql +=(`where team like '%${searchparam["t1"]}%'`);
            if(searchparam["op"]!="undefined"){
                sql +=(`AND oppo like '%${searchparam["op"]}%' `);
            };
        }
        else if(searchparam["op"]!="undefined"){
            sql +=(`where oppo like '%${searchparam["t1"]}%' `);
        };

        sql+=';';
        pool.getConnection(function(err, conn) {
            if (err) {
                callback(err, null, null);
            } else {
                conn.query(sql, function(qerr, vals, fields) {
                    conn.release(); //Release connection
                    callback(qerr, vals, fields); //Event driven callback
                });
            }
        });
    }
Retrieval supports dual team retrieval, that is, fixed home team and away team (with relative order relationship). Therefore, a series of conditional judgment statements should be added to the mysql search statements to form the search instructions on the mysql command line.
The final effect diagram is as follows. The results realize paging processing, and can be sorted according to the game time (ADU, you didn't lose!):
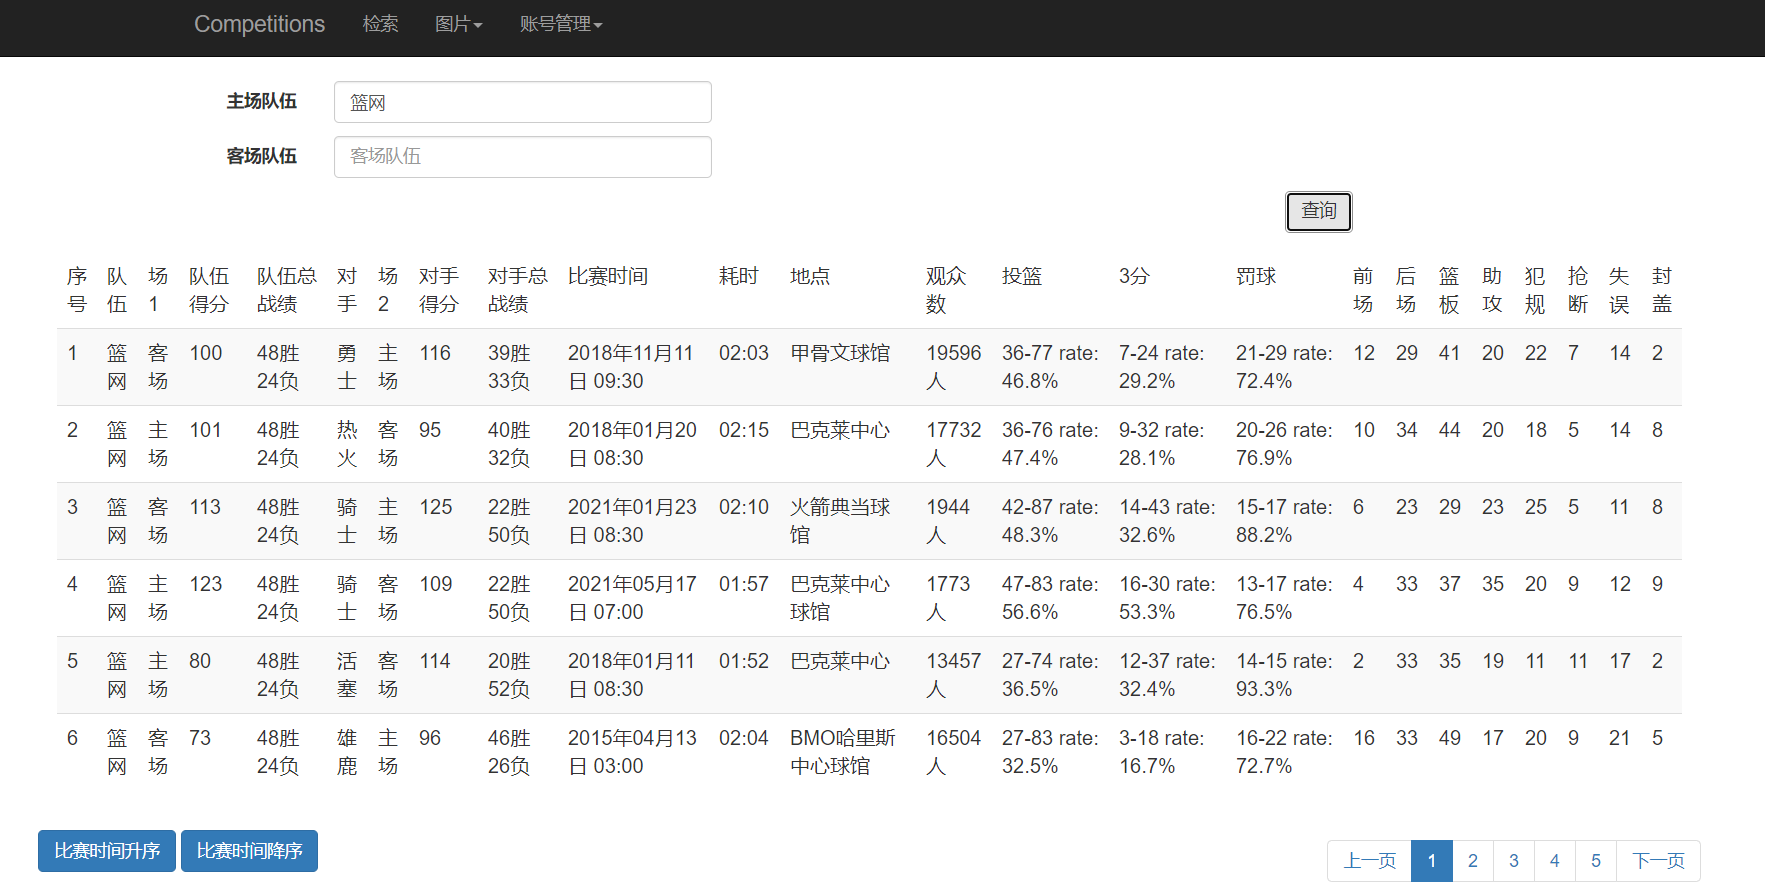
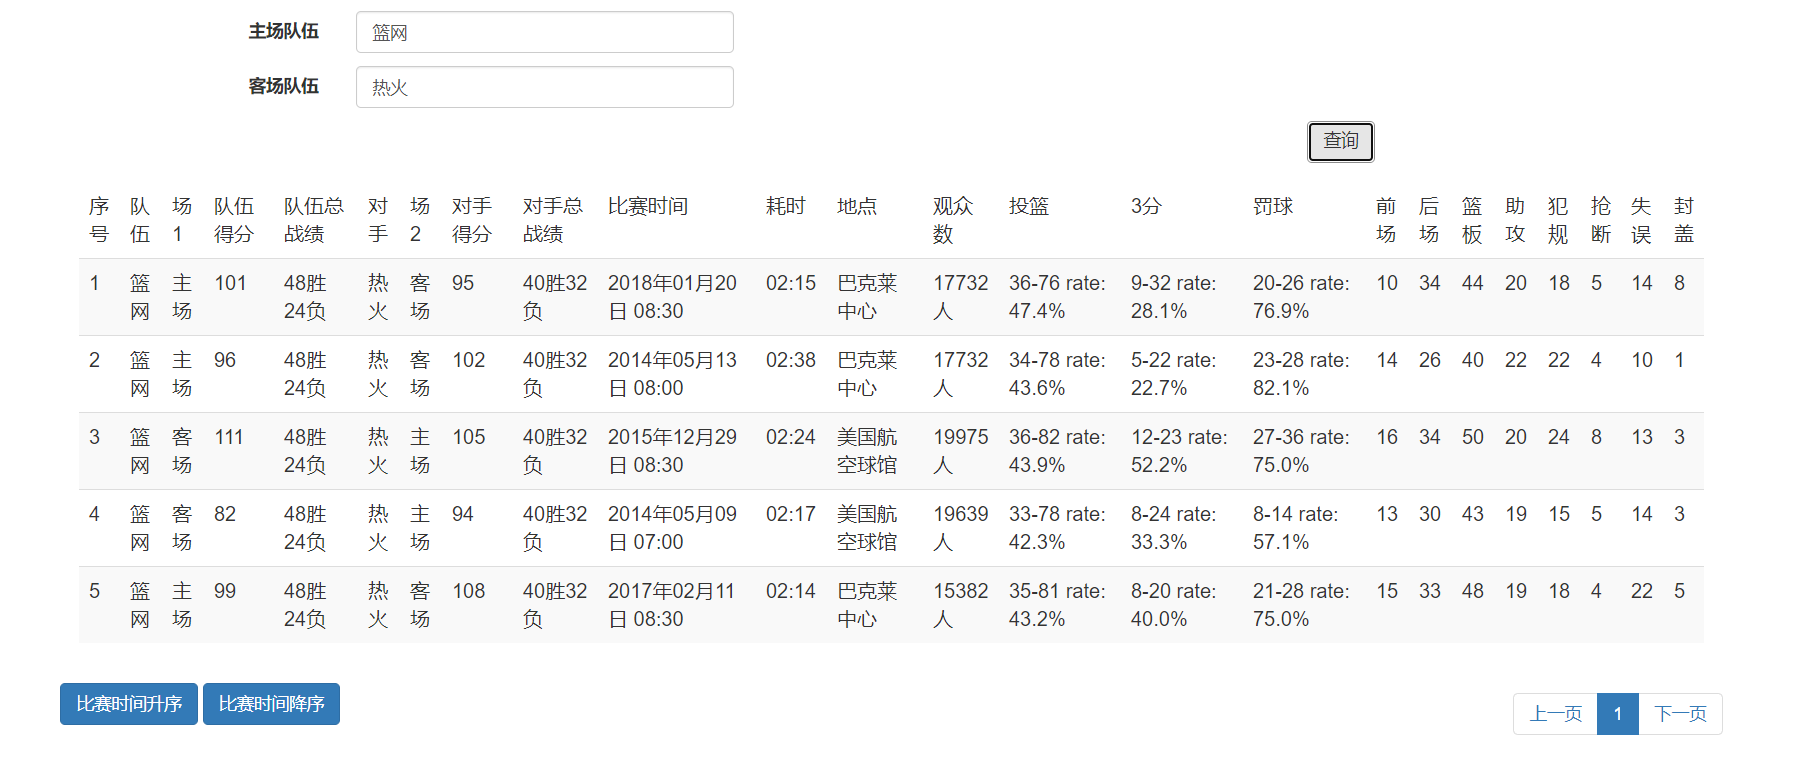
Chart making:
Click the picture and three chart options will drop down, namely, bar chart, pie chart and line chart. The charts are all produced by ECharts.
The histogram shows the winning rate information of each team:
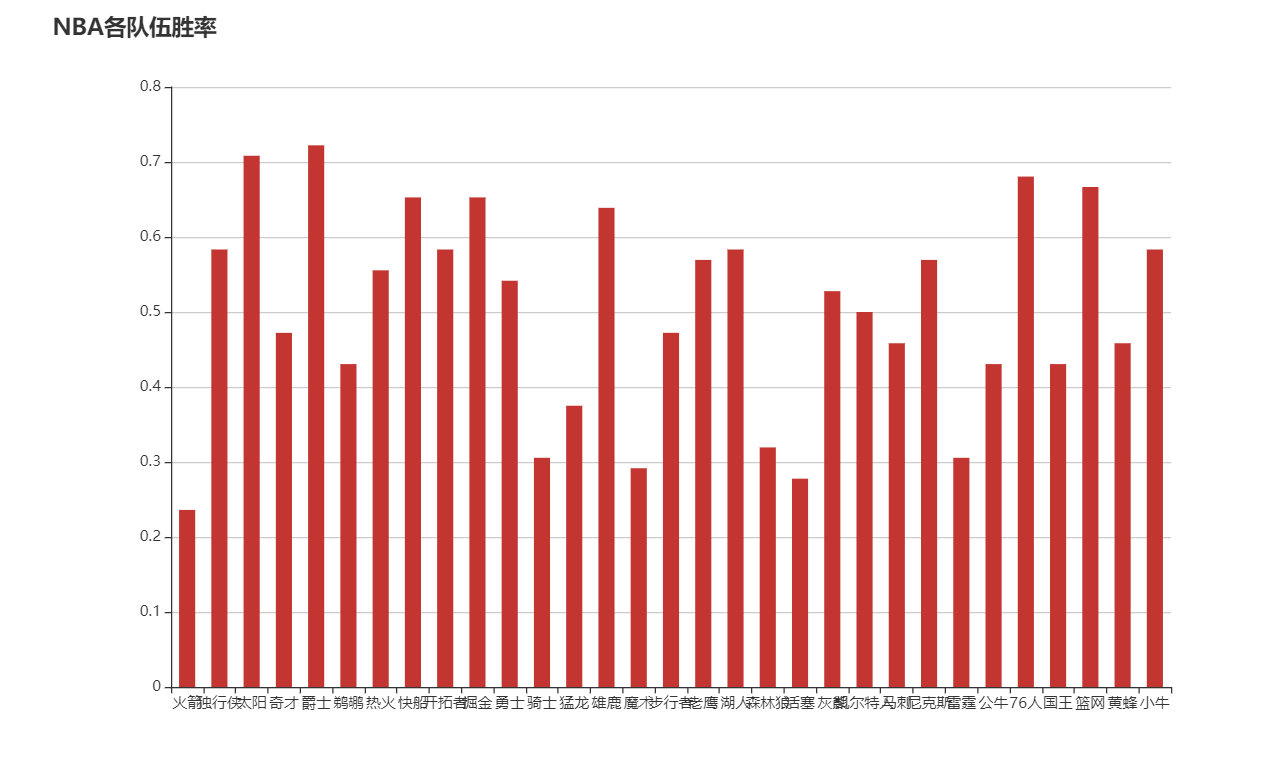
The record of the winning rate information is a string type, so the parInt function should be used to operate the character string of the record record record information to obtain the winning and losing games, so as to calculate the winning rate.
    $scope.histogram = function () {
        $scope.isShow = false;
        $http.get("/competitions/histogram")
            .then(
                function (res) {
                    if(res.data.message=='url'){
                        window.location.href=res.data.result;
                    }else {
                        let xdata = [], ydata = [], newdata;
                        res.data.result.forEach(function (element) {
                            // "record":"XX wins and XX fails"
                            if(element["record"].length > 4 && xdata.indexOf(element["team"]) == -1)
                            {
                                var win = parseInt(element["record"].substr(0, 2));//Convert string data into numbers and calculate the winning rate
                                var lose = parseInt(element["record"].substr(3, 2));
                                var rate = win / (win + lose);
                                ydata.push(rate);
                                xdata.push(element["team"]);
                            }
                        });
                        newdata = {"xdata": xdata, "ydata": ydata};

                        var myChart = echarts.init(document.getElementById('main1'));

                        // Specify configuration items and data for the chart
                        var option = {
                            title: {
                                text: 'NBA Five winning rates of each team'
                            },
                            tooltip: {},
                            legend: {
                                data: ['ranks']
                            },
                            xAxis: {
                                data: newdata["xdata"],
                                axisLabel: {
                                    show: true,
                                    interval:0
                                }
                            },

                            yAxis: {},
                            series: [{
                                name: 'winning probability',
                                type: 'bar',
                                data: newdata["ydata"],
                                barGap: '80%',
                                barWidth: '50%'
                            }]
                        };
                        // Display the chart using the configuration item and data you just specified.
                        myChart.setOption(option);
                    }
                },
                function (err) {
                    $scope.msg = err.data;
                });

    };
The pie chart shows the number of games played by each team
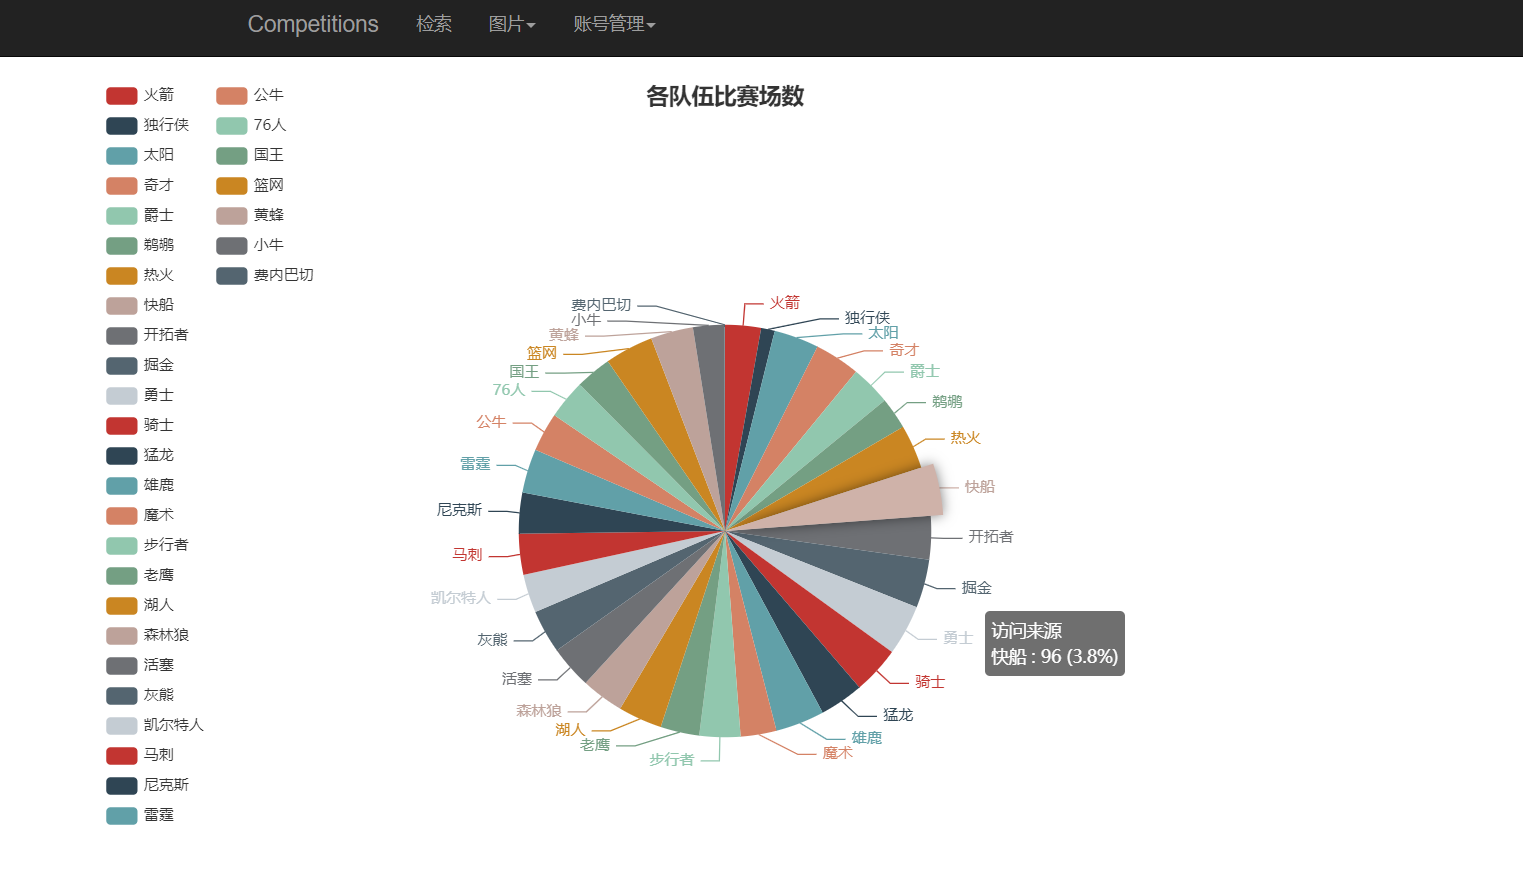
The number of matches can be directly obtained by using the built-in aggregate function COUNT() in mysql.
"select team as x,count(team) as y from myfetches group by team;"
Then it is good to take the obtained data as the data of pie graph.
    $scope.pie = function () {
        $scope.isShow = false;
        $http.get("/competitions/pie").then(
            function (res) {
                if(res.data.message=='url'){
                    window.location.href=res.data.result;
                }else {
                    let newdata = [];
                    res.data.result.forEach(function (element) {
                        newdata.push({name: element["x"], value: element["y"]});
                    });

                    var myChart = echarts.init(document.getElementById('main1'));
                    var app = {};
                    option = null;
                    // Specify configuration items and data for the chart
                    var option = {
                        title: {
                            text: 'Number of matches by team',
                            x: 'center'
                        },
                        tooltip: {
                            trigger: 'item',
                            formatter: "{a} <br/>{b} : {c} ({d}%)"
                        },
                        legend: {
                            orient: 'vertical',
                            left: 'left',
                            // data: ['direct access',' email marketing ',' Alliance advertising ',' video advertising ',' search engine ']
                        },
                        series: [
                            {
                                name: 'Access source',
                                type: 'pie',
                                radius: '55%',
                                center: ['50%', '60%'],
                                data: newdata,
                                itemStyle: {
                                    emphasis: {
                                        shadowBlur: 10,
                                        shadowOffsetX: 0,
                                        shadowColor: 'rgba(0, 0, 0, 0.5)'
                                    }
                                }
                            }
                        ]
                    };
                    // myChart.setOption(option);
                    app.currentIndex = -1;

                    setInterval(function () {
                        var dataLen = option.series[0].data.length;
                        // Cancels previously highlighted shapes
                        myChart.dispatchAction({
                            type: 'downplay',
                            seriesIndex: 0,
                            dataIndex: app.currentIndex
                        });
                        app.currentIndex = (app.currentIndex + 1) % dataLen;
                        // Highlight the current drawing
                        myChart.dispatchAction({
                            type: 'highlight',
                            seriesIndex: 0,
                            dataIndex: app.currentIndex
                        });
                        // Show tooltip
                        myChart.dispatchAction({
                            type: 'showTip',
                            seriesIndex: 0,
                            dataIndex: app.currentIndex
                        });
                    }, 1000);
                    if (option && typeof option === "object") {
                        myChart.setOption(option, true);
                    }
                    ;
                }
            });
    };
The line chart shows the average score of each team
The effects are as follows:
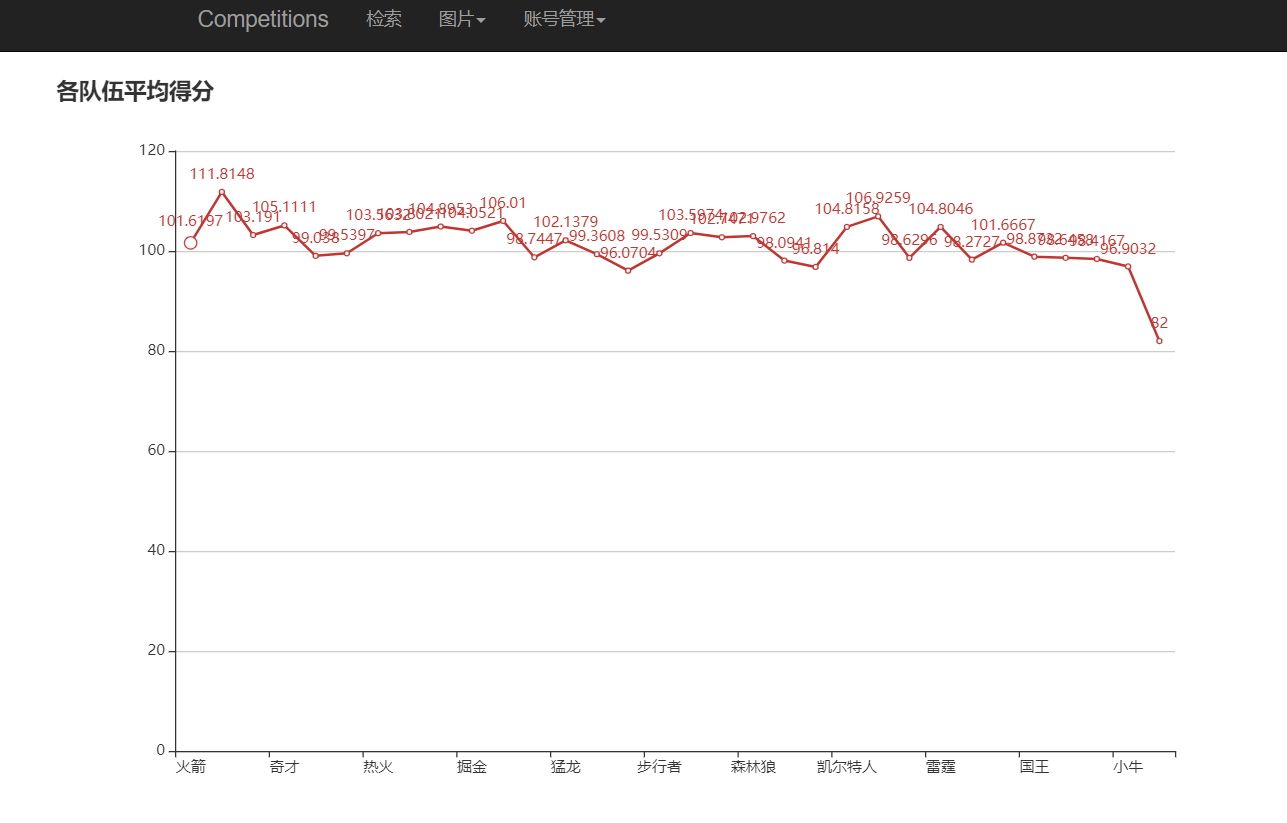
In the same way as pie chart, the average score can also be obtained by AVG() function.
"select team as x,avg(scores) as y from myfetches group by team;"
After obtaining the data, add the data to the ECharts component to display the line chart.
    $scope.line = function () {
        $scope.isShow = false;
        $http.get("/competitions/line").then(
            function (res) {
                if(res.data.message=='url'){
                    window.location.href=res.data.result;
                }else {
                    var myChart = echarts.init(document.getElementById("main1"));
                    let teams = [];
                    let avgScores = [];
                    res.data.result.forEach(function(element) {
                        teams.push(element["x"]);
                        avgScores.push(element["y"]);
                    });
                    option = {
                        title: {
                            text: 'Average score of each team'
                        },
                        xAxis: {
                            type: 'category',
                            data: teams,
                        },
                        yAxis: {
                            type: 'value'
                        },
                        series: [{
                            data: avgScores,
                            type: 'line',
                            itemStyle: {normal: {label: {show: true}}}
                        }],

                    };

                    if (option && typeof option === "object") {
                        myChart.setOption(option, true);
                    }
                }

            });
    };
Before displaying the chart every time, initialize the main1 tag on the front end to avoid overlapping multiple charts, and then display the current picture.
Implementation of administrator operation
We want the administrator to have the following permissions: view the registration information and operation logs of all users, and disable user accounts.
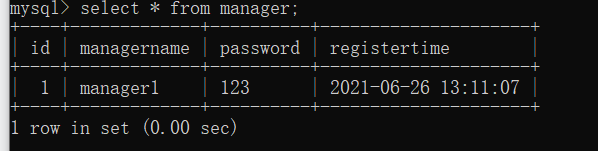
Of course, the administrator's registration cannot be written in the front of the web page, otherwise everyone can have the right to manage other people's accounts. Therefore, the administrator's account must be directly inserted into mysql by the background.
The front end of the management page is similar to the front end of user login.

Of course, you need to add a new routing address to the app file, and a series of database operations should be separated from user operations (you have to create a lot of new files, bald...).
After the administrator logs in successfully, the following interface will appear.

The View tab of the page has two options: user registration information and operation log browsing and deactivation of users. Because the former only realizes the display of mysql data, while the latter requires the administrator to input and modify the database information, I separate the two.
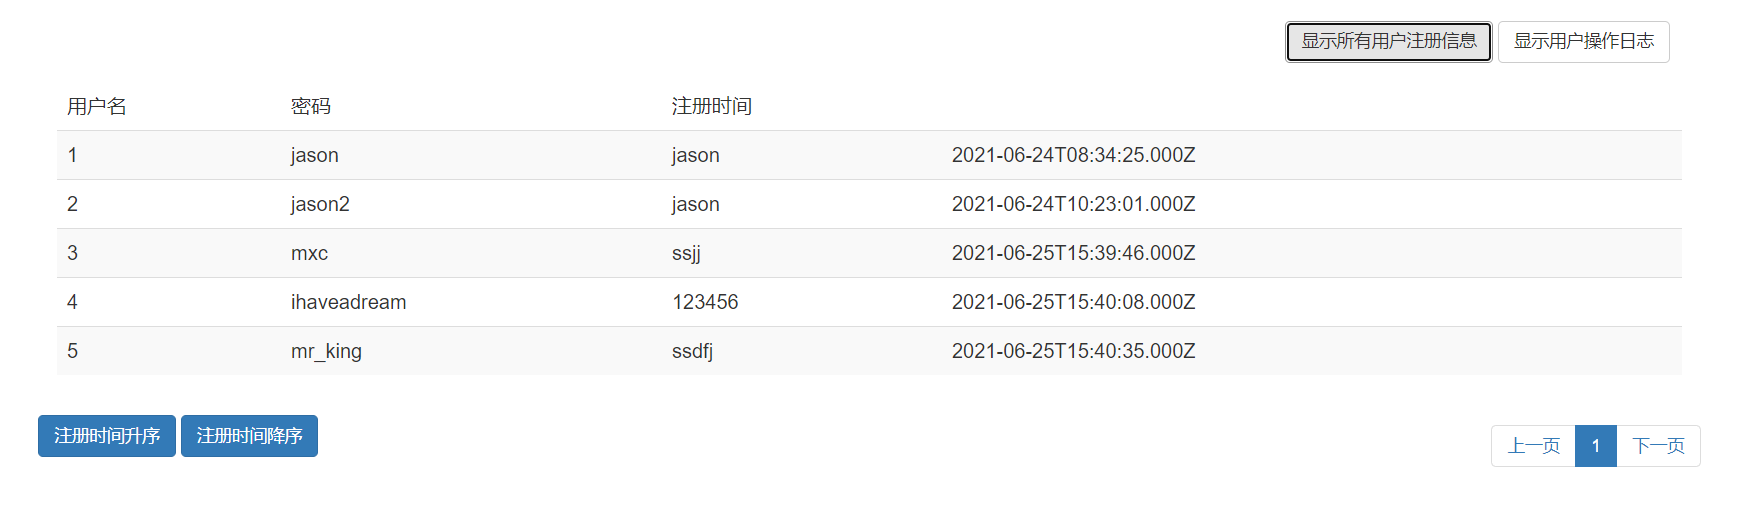
Enter the user registration information and operation log browsing tab, and the following screen will appear.

The administrator can click two buttons to select the information to browse.
(user registration information)
(user action log)
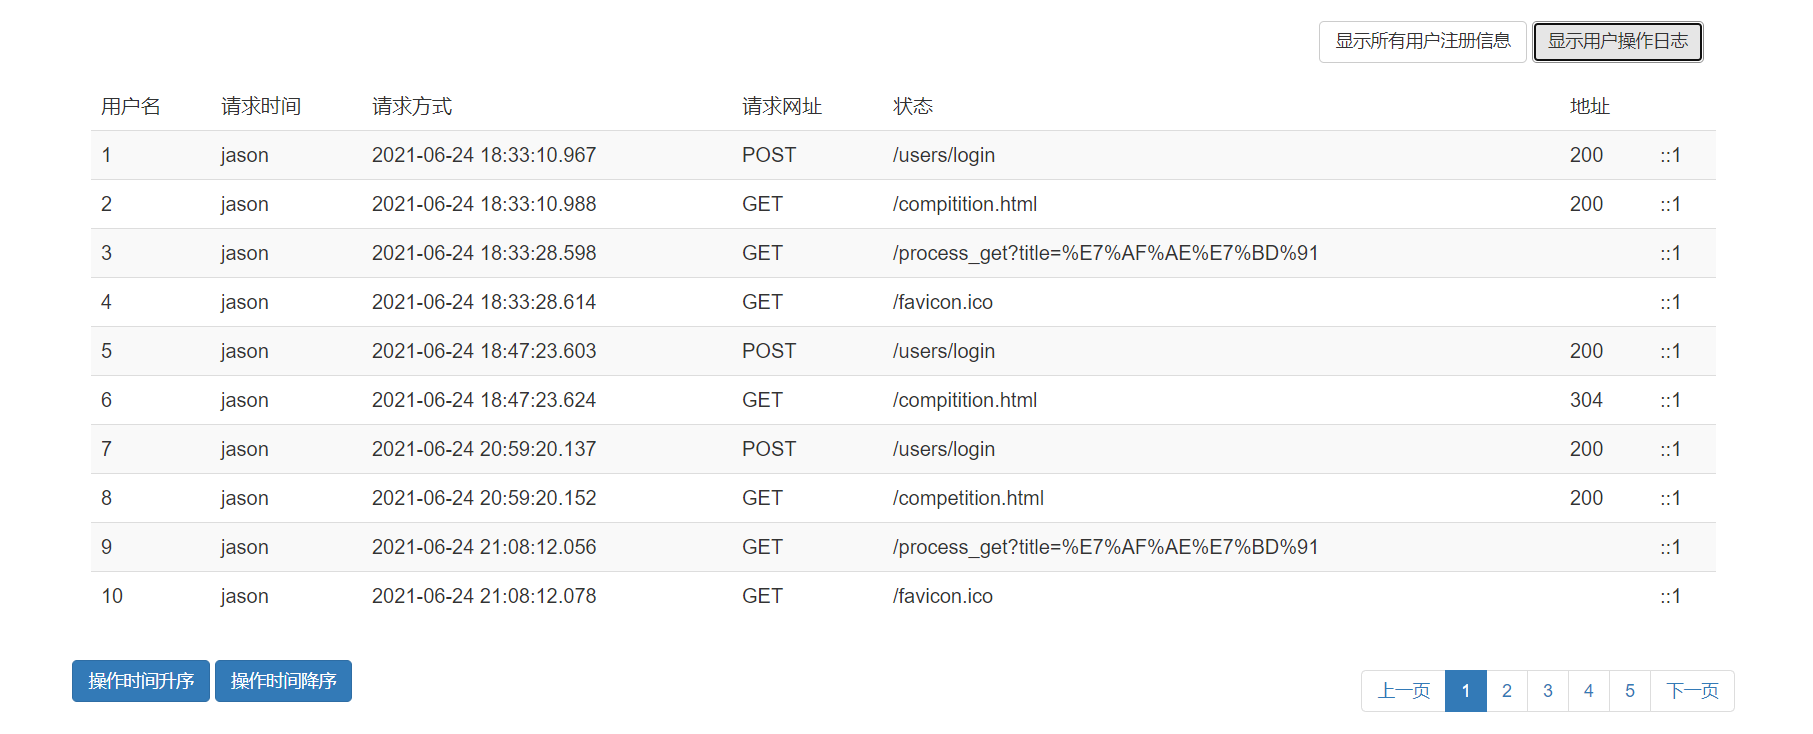
The front-end implementation here is also similar to the previous competition, which hides other pages when displaying one page. The data display also realizes paging processing and chronological sorting.
Click the disable user button, and the following screen will appear.

The administrator enters the user name to be deactivated and clicks OK to delete the user to be deleted.
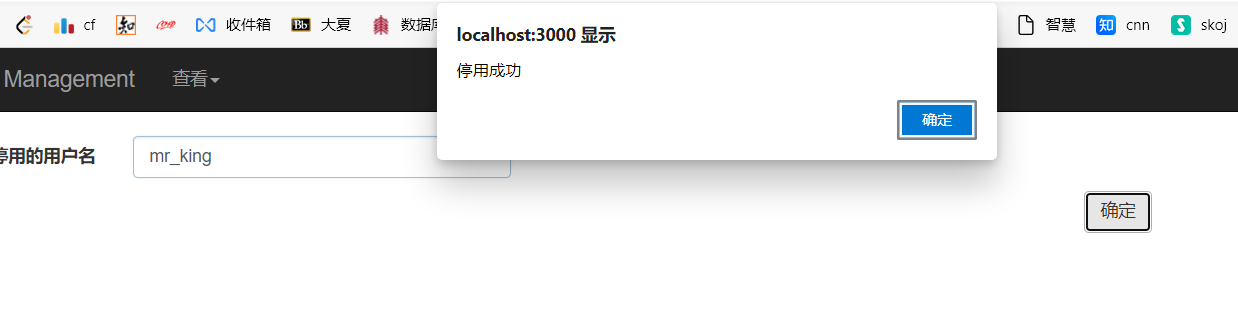
After the deactivation is successful, a pop-up window will be alert ed to tell the administrator that the deactivation is successful.
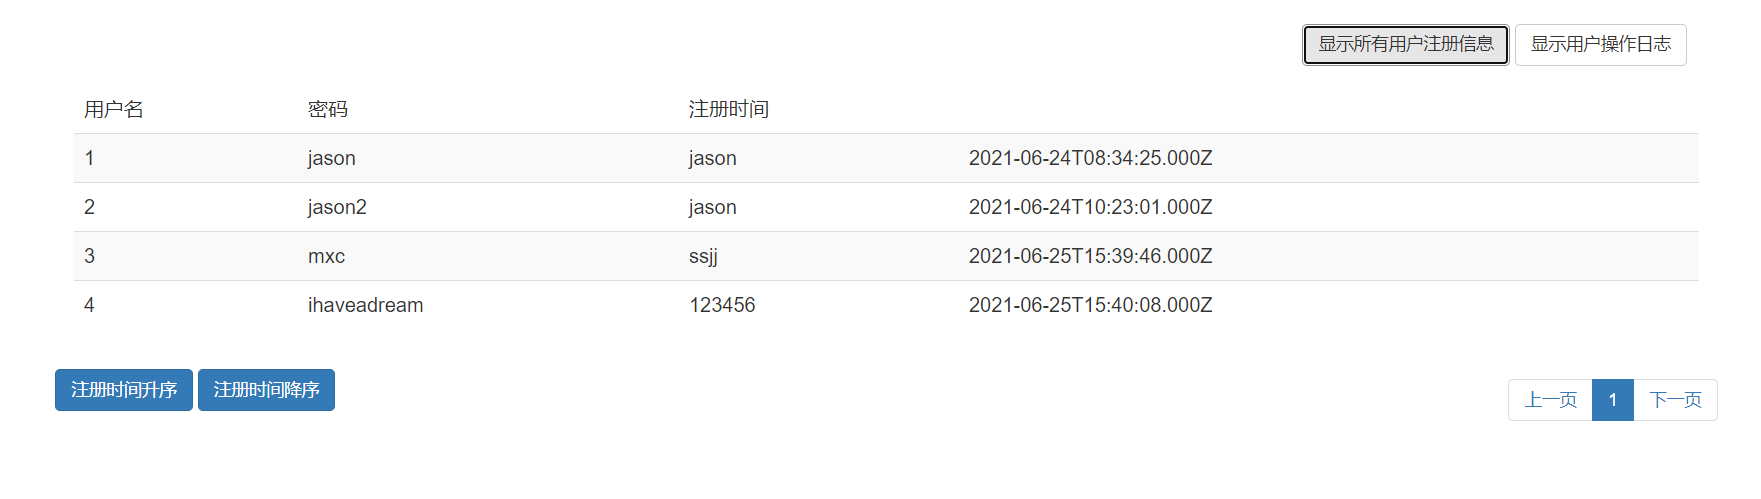
We checked the user registration information and found that there was no 'Mr'_ King's registration information.
Then go to the login interface and use mr_king's account and password can't log in.
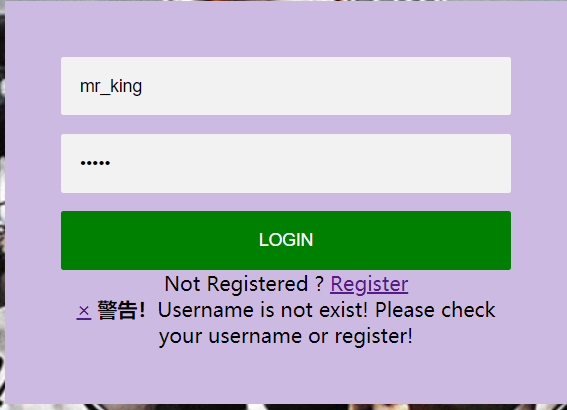
The front page shows that the user does not exist.
epilogue
I have undoubtedly gained a lot in the process of making front-end Web pages: I have learned a lot of mysql commands, used routing more skillfully to realize front-end and back-end interaction, and become more proficient in html design. I hope this page can submit a satisfactory answer for my Web programming class.