k-means algorithm
Partition based method
Given a data set D with N data objects and the number of clusters to be generated K (k < n), in the partition method D, the objects are allocated to K groups, and each group represents a cluster. Then an objective function is used to evaluate the partition quality, so that the objects in the cluster are similar but different from the objects in other clusters.
characteristic
- It is very suitable to find spherical mutually exclusive clusters in small and medium-sized data sets.
- Is based on distance
- The cluster center can be represented by mean or center point
Introduction to K-means
Because of its excellent speed and good scalability, K-means clustering algorithm is the most famous clustering method. K-means algorithm is a process of repeatedly moving the center point of the class, moving the center point of the class, also known as centroids, to the average position of its containing members, and then re dividing its internal members.
Related concepts of K-means algorithm
Distance measurement
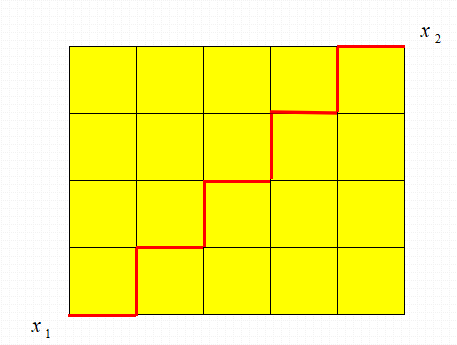
Manhattan distance
Driving from one intersection to another in Manhattan is obviously not a straight distance between two points. This actual driving distance is "Manhattan distance", also known as "city block distance".
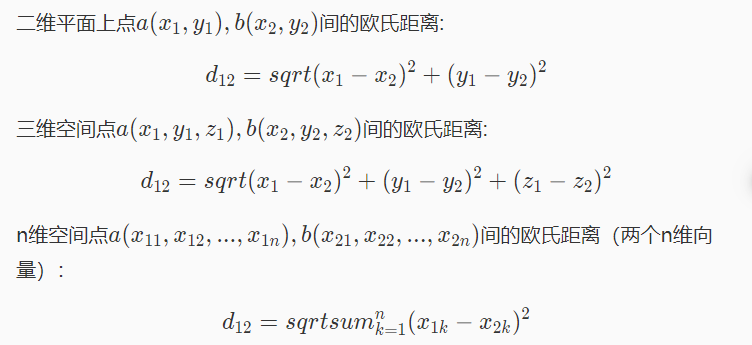
Euclidean distance
Euclidean distance is a commonly used definition of distance, which refers to the real distance between two points in m-dimensional space
cosine similarity
Cosine similarity measures the difference between two individuals by using the cosine value of the angle between two vectors in vector space. Compared with distance measurement, cosine similarity pays more attention to the difference of two vectors in direction than distance or length.
The closer the cosine value is to 1, the closer the included angle is to 0 degrees, that is, the more similar the two vectors are, which is called "cosine similarity".
Common distance code implementation
import numpy as np
def distance(x,y,p=2):
    '''
    input:x(ndarray):Coordinates of the first sample
          y(ndarray):Coordinates of the second sample
          p(int):Manhattan distance is equal to 1 and Euclidean distance is equal to 2
    output:distance(float):x reach y Distance
    '''
    if(p==1):
        return  sum(abs(x-y))
    elif(p==2):
        return (sum((x-y)**2))**(1/2)
Calculate the square of Euclidean distance between a sample and all samples in the data set
def euclidean_distance(one_sample, X):
    one_sample = one_sample.reshape(1, -1)
    distances = np.power(np.tile(one_sample, (X.shape[0], 1)) - X, 2).sum(axis=1)
    return distances
Centroid and objective function
centroid
Abbreviation of quality center. The centroid of a particle system is the average position of the mass distribution of the particle system.
The centroid may change with different data proximity measures and clustering objectives.
Proximity measure
Euclidean distance is usually used for points in Euclidean space and cosine similarity is used for documents.
Here, we use European distance
objective function
For the data whose proximity measure is Euclidean distance, we usually use the Sum of the Squared Error (SSE) as the objective function to measure the clustering quality. In other words, calculate the error of each data point, that is, the Euclidean distance from it to the nearest centroid, and then calculate the sum of the squares of the errors.
K-means algorithm flow
python class initialization
class MyKmeans():
    """Kmeans clustering algorithm .
    Parameters:
    -----------
    k: int
        Number of clusters.
    max_iterations: int
        Maximum number of iterations.
    varepsilon: float
        Judge whether convergence, If all the last time k Cluster centers and all of this k The difference of two cluster centers is less than varepsilon,
        Then the algorithm has converged
    """
    def __init__(self, k=5, max_iterations=300, varepsilon=0.0001, random_state=2):
        self.k = k
        self.max_iterations = max_iterations
        self.varepsilon = varepsilon
        np.random.seed(random_state)
Select initial centroid
    # Select self at random from all samples K-sample is used as the initial clustering center
    def init_random_centroids(self, X):
        n_samples, n_features = np.shape(X)
        centroids = np.zeros((self.k, n_features))
        for i in range(self.k):
            centroid = X[np.random.choice(range(n_samples))]
            centroids[i] = centroid
        return centroids
Assign each object to the most similar cluster
    # Returns the nearest central index [0, self.k) to the sample
    def _closest_centroid(self, sample, centroids):
        distances = euclidean_distance(sample, centroids)
        closest_i = np.argmin(distances)
        return closest_i

    # Classify all samples. The classification rule is to classify the sample to its nearest center
    def create_clusters(self, centroids, X):
        n_samples = np.shape(X)[0]
        clusters = [[] for _ in range(self.k)]
        for sample_i, sample in enumerate(X):
            centroid_i = self._closest_centroid(sample, centroids)
            clusters[centroid_i].append(sample_i)
        return clusters
Update the centroid of the cluster
    # Update the center
    def update_centroids(self, clusters, X):
        n_features = np.shape(X)[1]
        centroids = np.zeros((self.k, n_features))
        for i, cluster in enumerate(clusters):
            centroid = np.mean(X[cluster], axis=0)
            centroids[i] = centroid
        return centroids
Calculate the label and centroid
    # All samples are classified, and the index of their category is their category label
    def get_cluster_labels(self, clusters, X):
        y_pred = np.zeros(np.shape(X)[0])
        for cluster_i, cluster in enumerate(clusters):
            for sample_i in cluster:
                y_pred[sample_i] = cluster_i
        return y_pred

    # For clusters, return the centroid of its clustering result
    def get_cluster_centroids(self, clusters, X):
        centroids = np.zeros((self.k,np.shape(X)[1]))
        for i, cluster in enumerate(clusters):
            centroid = np.mean(X[cluster], axis=0)
            centroids[i] = centroid
        return centroids
clustering
    # Perform Kmeans clustering on the whole data set X and return the clustered label
    def predict(self, X):

        # Select self at random from all samples K-sample is used as the initial clustering center
        centroids = self.init_random_centroids(X)

        # Iterate until the algorithm converges (the cluster center of the last time almost coincides with the cluster center of this time) or reaches the maximum number of iterations
        for _ in range(self.max_iterations):
            # Classify all samples. The classification rule is to classify the sample to its nearest center
            clusters = self.create_clusters(centroids, X)
            former_centroids = centroids

            # Calculate the new cluster center
            centroids = self.update_centroids(clusters, X)

            # If there is almost no change in the cluster center, it indicates that the algorithm has converged and exits the iteration
            diff = centroids - former_centroids
            if diff.any() < self.varepsilon:
                break

        return self.get_cluster_labels(clusters, X),self.get_cluster_centroids(clusters, X)
K-means actual combat
requirement
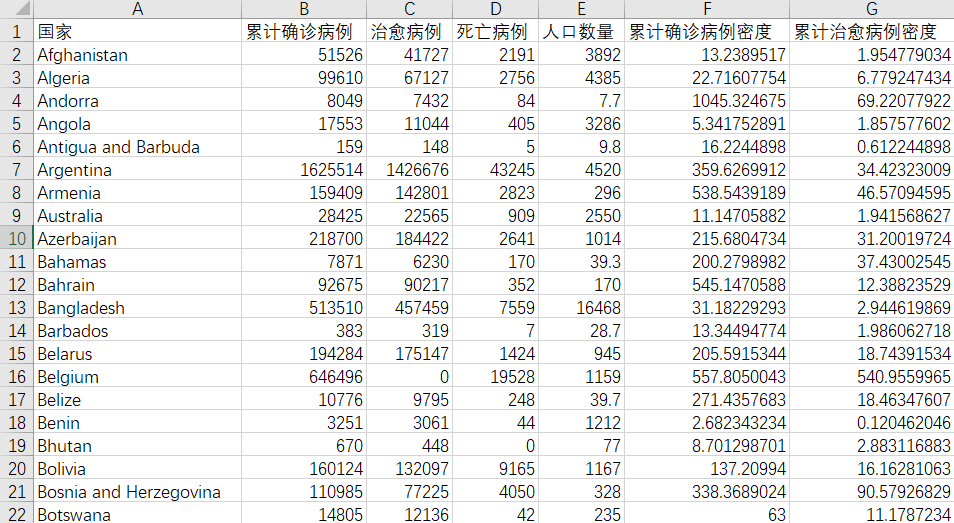
The epidemic situation of each country in the data is different, and some even vary greatly. Therefore, we want to cluster 78 countries first to judge the epidemic prevention effect of each country.
data set
Data source: https://github.com/datasets/covid-19
Through data cleaning and integration, some data are as follows
data reduction
Cumulative confirmed case density = cumulative confirmed cases / total population; Density of existing confirmed cases = number of existing confirmed cases / total population
Therefore, the column of total population belongs to redundant data, so this column of data will be deleted during k-means algorithm.
data conversion
Data normalization is a basic operation of data mining. In reality, the dimensions of different features in the data may be inconsistent, and the differences between values may be very large. Without processing, it may affect the results of data analysis. Therefore, it is necessary to scale the data according to a certain proportion to make it fall in a specific area for comprehensive analysis.
Data normalization can effectively improve the accuracy and effectiveness of algorithms involving distance measurement. For the classification algorithm and clustering algorithm using distance measurement, data normalization is a particularly important step.
method
- Min max normalization
- z-score normalization (zero mean normalization) StandardScaler
- Normalization by decimal scaling
Introduction to sklearn preprocessing in python
There is a StandardScaler function in sklearn preprocessing that can be used for zero mean normalization
scaler = StandardScaler()
scaler.fit(data)
data = scaler.transform(data)
Practical k-means algorithm code
import pandas as pd
from sklearn.cluster import KMeans
from sklearn.preprocessing import StandardScaler
from My_KMeans import MyKmeans

df = pd.read_csv('Test\\77 Country clustering.csv',header=0,index_col='country')
data = df.iloc[:,:-1]

scaler = StandardScaler()
scaler.fit(data)
data = scaler.transform(data)

mykm = MyKmeans()
label,centroids = mykm.predict(data)
print(label)
result_centroid = scaler.inverse_transform(centroids)
# pd.DataFrame(result_centroid).to_csv('Test\\centroids.csv')
print(result_centroid)
# km = KMeans(5,random_state=2) #The KMeans Library in sklearn is used here (the same effect can be achieved)
# res = km.fit(data)
# print(res.labels_+1)

# result = scaler.inverse_transform(res.cluster_centers_)
# print(result)