Same series of articles
Article catalogue
catalogue
preface
I have written the code to climb the University QS ranking and visualize it with pygal before, but the execution speed of the series structure is too slow and the use experience is not very good. So I try to rewrite the code with multithreading, and show the advantages of multithreading in a visual way.
1, Imported Libraries
Compared with the previous article, four more libraries are imported
multiprocessing (multithreading Library)
Time (time base)
matplotlib (classic drawing library)
Random (random extraction Library)
2, Rewrite code rendering
This time, I'll write the code first, and then explain the reason for my handling
# This is a py file to crawl the ranks of your university in QS.
import requests
import re
import pygal
import time
from multiprocessing.dummy import Pool

def getJson(url):
    r=requests.post(url,headers=headers).json()
    return r

def getSign(url):
    sign=int(re.findall('https://www.qschina.cn/sites/default/files/qs-rankings-data/cn/(.*?)_indicators.txt',url)[0])
    return sign

def parse(dict,sign):
    reg=re.compile('[\u4E00-\u9FA5]+')
   # This line is to find the Chinese characters, so the university's name should be in Chinese, then you can get the QS rank of it.
    count=0
    for d in dict['data']:
        try:
            name=re.search(reg,d['uni']).group()
            # If the uni name is in English, it will return None. Use the group() to None will get an error.
            if name in uName:
                dataDict[name][Info[sign]]=int(d['overall_rank'])
                count+=1
            if count==nOfUniversity:
                break
        except:
            pass

def getuName():
    global inputTime
    inputStart=time.time()
    s=input("Please enter the name of the university you want to check in Chinese (in the middle)','(separate):")
    inputEnd=time.time()
    inputTime=inputEnd-inputStart
    L=s.split(',')
    return L

def darwLine():
    line=pygal.Line()
    for i in uName:
        line.add(i,dataDict[i])
    line.x_labels=year
    line.y_title="QS ranking"
    line.x_title="particular year"
    line.title="Nearly four years QS ranking"
    line.legend_at_bottom=True
    line.render_to_file('Query results.svg')
    # Before you run this file, you should change the above line to your path.

def main():
    global uName
    uName=getuName()
    global nOfUniversity
    nOfUniversity=len(uName)
    global dataDict
    dataDict={}
    for i in uName:
        dataDict[i]=[None,None,None,None]
    pool=Pool(4)
    pool.map(lambda x: parse(getJson(x),getSign(x)),url)
    darwLine()

if __name__ == '__main__':
    startTime=time.time()
    url=['https://www.qschina.cn/sites/default/files/qs-rankings-data/cn/397863_indicators.txt',
         'https://www.qschina.cn/sites/default/files/qs-rankings-data/cn/914824_indicators.txt',
         'https://www.qschina.cn/sites/default/files/qs-rankings-data/cn/2057712_indicators.txt',
         'https://www.qschina.cn/sites/default/files/qs-rankings-data/cn/2122636_indicators.txt',
         ]
    headers={
        'user-agent': you need to add it
    }
    year=[2019,2020,2021,2022]
    Info={397863:0,914824:1,2057712:2,2122636:3}
    main()
    endTime=time.time()
    runTime=endTime-startTime-inputTime
    print(runTime)
My rewriting idea is to replace the previous D with dataDict, eliminating the need to centralize the data through the for loop.
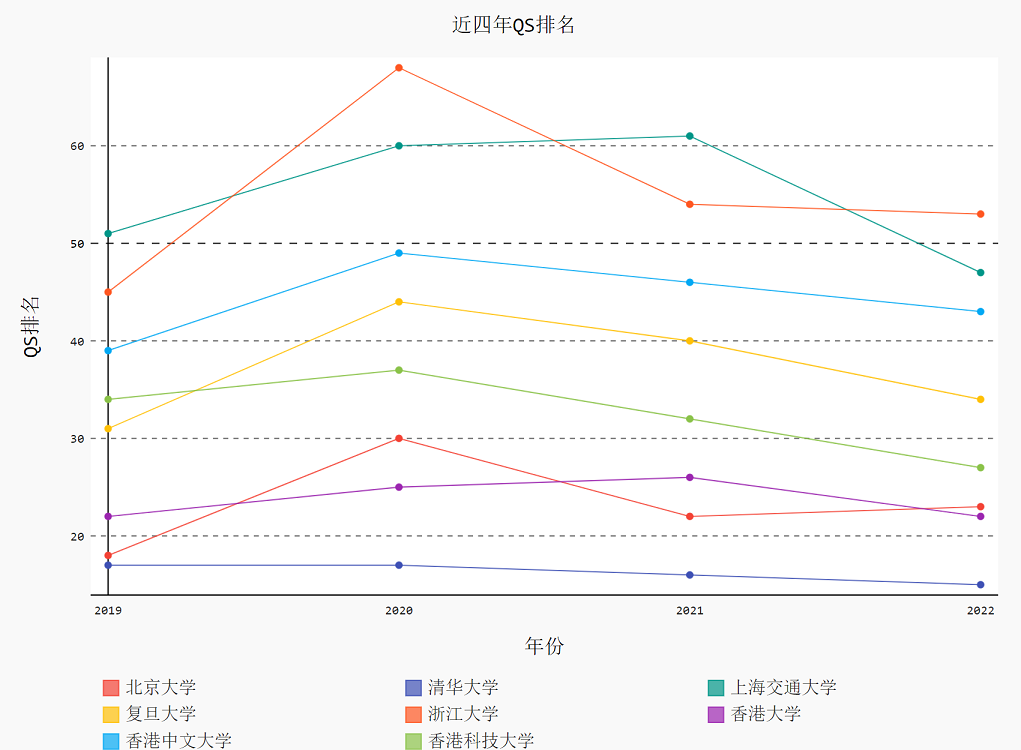
One of the biggest bug s is that the execution time of multiple threads is different. The result is as follows:

The ranking of each school has no string, but the time string.
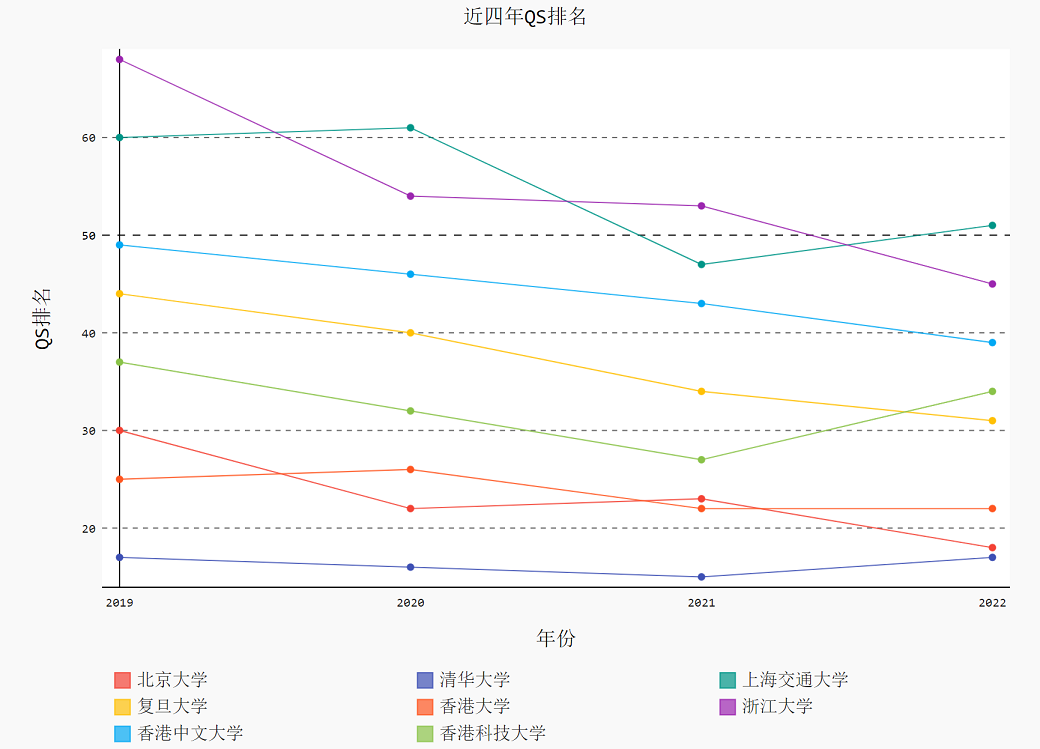
The correct figure is attached here:

Therefore, sign is required to specify the order of data.
3, Runtime visualization
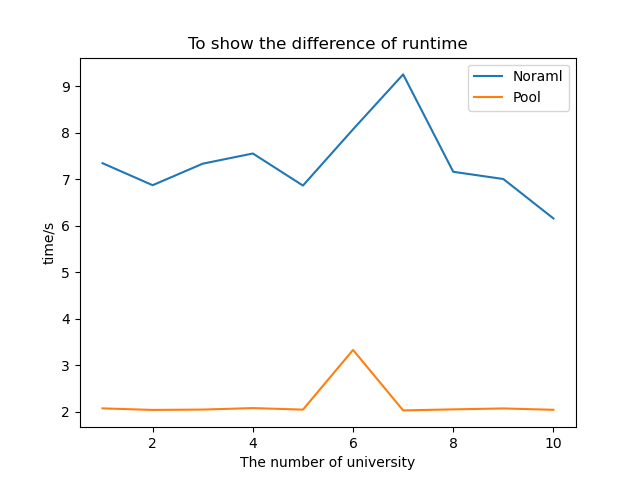
Requesting the same url in a short time is easy to be blocked, so I tested 10 groups (the number of universities queried ranges from 1 to 10), randomly sampled 5 in each group, and calculated the average time with the update() user-defined function.
The mainNormal() method is different from the processing in the first article in order to control variables (only the multithreading part is different).
The test and visualization code is as follows:
import requests
import re
import time
import random
import matplotlib.pyplot as plt
from multiprocessing.dummy import Pool
import pygal

def getJson(url):
    r=requests.post(url,headers=headers).json()
    return r

def parseForName(dict):
    global name
    name=[]
    reg=re.compile('[\u4E00-\u9FA5]+')
   # This line is to find the Chinese characters, so the university's name should be in Chinese, then you can get the QS rank of it.
    for d in dict['data'][:499]:
        try:
            name.append(re.search(reg,d['uni']).group())
        except:
            pass

def getSign(url):
    sign=int(re.findall('https://www.qschina.cn/sites/default/files/qs-rankings-data/cn/(.*?)_indicators.txt',url)[0])
    return sign

def parse(dict,sign):
    reg=re.compile('[\u4E00-\u9FA5]+')
   # This line is to find the Chinese characters, so the university's name should be in Chinese, then you can get the QS rank of it.
    count=0
    for d in dict['data']:
        try:
            name=re.search(reg,d['uni']).group()
            # If the uni name is in English, it will return None. Use the group() to None will get an error.
            if name in uName:
                dataDict[name][Info[sign]]=int(d['overall_rank'])
                count+=1
            if count==nOfUniversity:
                break
        except:
            pass

def darwLine():
    line=pygal.Line()
    for i in uName:
        line.add(i,dataDict[i])
    line.x_labels=year
    line.y_title="QS ranking"
    line.x_title="particular year"
    line.title="Nearly four years QS ranking"
    line.legend_at_bottom=True
    line.render_to_file('Query results.svg')
    # Before you run this file, you should change the above line to your path.

def mainPool():
    global nOfUniversity
    nOfUniversity=len(uName)
    global dataDict
    dataDict={}
    for i in uName:
        dataDict[i]=[None,None,None,None]
    pool.map(lambda x: parse(getJson(x),getSign(x)),url)
    darwLine()

def mainNormal():
    global nOfUniversity
    nOfUniversity=len(uName)
    global dataDict
    dataDict={}
    for i in uName:
        dataDict[i]=[None,None,None,None]
    for link in url:
        parse(getJson(link),getSign(link))
    darwLine()

def update(L,v,count):
    if count==0:
        L.append(v)
    else:
        L[-1]=(L[-1]*count+v)/(count+1)

def takeSamplesToTest(maxNum):
    for n in range(1,maxNum+1):
        for i in range(5):
            global uName
            uName=random.sample(name,n)
            startTime=time.time()
            mainNormal()
            endTime=time.time()
            runTime=endTime-startTime
            update(timeListForNormal,runTime,i)
            startTime=time.time()
            mainPool()
            endTime=time.time()
            runTime=endTime-startTime
            update(timeListForPool,runTime,i)
        print(n)

if __name__ == '__main__':
    headers={
        'user-agent': you need to add it
    }
    url=['https://www.qschina.cn/sites/default/files/qs-rankings-data/cn/397863_indicators.txt',
         'https://www.qschina.cn/sites/default/files/qs-rankings-data/cn/914824_indicators.txt',
         'https://www.qschina.cn/sites/default/files/qs-rankings-data/cn/2057712_indicators.txt',
         'https://www.qschina.cn/sites/default/files/qs-rankings-data/cn/2122636_indicators.txt',
         ]
    year=[2019,2020,2021,2022]
    Info={397863:0,914824:1,2057712:2,2122636:3}
    parseForName(getJson('https://www.qschina.cn/sites/default/files/qs-rankings-data/cn/397863_indicators.txt'))
    timeListForNormal=[]
    timeListForPool=[]
    pool=Pool(4)
    takeSamplesToTest(10)
    X=range(1,11)
    fig, ax = plt.subplots()
    ax.plot(X, timeListForNormal, label='Noraml')
    ax.plot(X, timeListForPool, label='Pool')
    ax.set_xlabel('The number of university')
    ax.set_ylabel('time/s')
    ax.set_title('To show the difference of runtime')
    ax.legend()
    plt.show()
4, Visualization results

It can be seen that the running time of multithreading is almost stable at 2s, which is about 5s compared with the ordinary series structure, which shows its advantages.
summary
This paper adds multithreading to the crawler code in the previous article to improve the running efficiency, and visualizes its improvement effect.
 https://blog.csdn.net/m0_61168705/article/details/122699759?spm=1001.2014.3001.5501