This blog is only for simple cluster configuration. For more information, please refer to Official documents.
1, Preparation before installation
The environment is as follows:
| System version | IP | role |
|---|---|---|
| centos 7.5 | 192.168.20.2 | ES 01,logstash,ES-Head,logstash,kibana |
| centos 7.5 | 192.168.20.7 | ES 02 |
| centos 7.5 | 192.168.20.8 | ES 03 |
Note: all software packages used in this article can be found in my network disk link download Or go es Chinese community Download es related components.
1. Configure domain name resolution
[root@node01 src]# cat > /etc/hosts << EOF
> 192.168.20.2    node01
> 192.168.20.7    node02
> 192.168.20.8    node03
> EOF
> #Send hosts file to other nodes
[root@node01 src]# scp /etc/hosts root@node02:/etc/hosts
[root@node01 src]# scp /etc/hosts root@node03:/etc/hosts
2. Configuring the java environment
Note: the following operations need to be configured on all nodes.
Official download address of JDK
#Uninstall the native java environment
[root@node01 src]# rpm -qa | grep jdk
java-1.8.0-openjdk-headless-1.8.0.161-2.b14.el7.x86_64
copy-jdk-configs-3.3-2.el7.noarch
java-1.8.0-openjdk-1.8.0.161-2.b14.el7.x86_64
java-1.7.0-openjdk-headless-1.7.0.171-2.6.13.2.el7.x86_64
java-1.7.0-openjdk-1.7.0.171-2.6.13.2.el7.x86_64
[root@node01 src]# rpm -e java-1.8.0-openjdk-headless --nodeps
[root@node01 src]# rpm -e java-1.7.0-openjdk-headless --nodeps
#Configure the jdk environment
[root@node01 src]# tail -4 /etc/profile   #The additional contents are as follows
export JAVA_HOME=/usr/local/jdk1.8.0_241
export JRE_HOME=/usr/local/jdk1.8.0_241/jre
export CLASSPATH=$JAVA_HOME/lib/tools.jar:$JAVA_HOME/lib/dt.jar
export PATH=$JAVA_HOME/bin:$JRE_HOME/bin:$PATH
#Refresh the configuration and see if the configuration is correct
[root@node01 src]# . /etc/profile
[root@node01 src]# java -version
java version "1.8.0_241"
Java(TM) SE Runtime Environment (build 1.8.0_241-b07)
Java HotSpot(TM) 64-Bit Server VM (build 25.241-b07, mixed mode)
2, Configure ELK cluster
1. Download the rpm installation package of es
Note: Download and install operations need to be performed on all nodes
#Download and install elastic search
[root@node01 src]# wget https://artifacts.elastic.co/downloads/elasticsearch/elasticsearch-7.5.1-x86_64.rpm
[root@node01 src]# rpm -ivh elasticsearch-7.5.1-x86_64.rpm
#Set power on self start
[root@node01 src]# systemctl daemon-reload
[root@node01 src]# systemctl enable elasticsearch.service
2. Optimize es (skip)
1) Modify the default memory size
#View the profile directory of elastic search
[root@node01 elasticsearch]# pwd
/etc/elasticsearch
[root@node01 elasticsearch]# ls
elasticsearch.keystore  jvm.options        role_mapping.yml  users
elasticsearch.yml       log4j2.properties  roles.yml         users_roles
#The default memory usage of elasticsearch is 1G. You can change the following configuration to modify the default memory usage
[root@node01 elasticsearch]# cat jvm.options
-Xms1g
-Xmx1g
2) Change the size of the number of open files
If the number of server files goes online and the thread goes online is low, the following exceptions will occur:
1. max file descriptors [4096] for elasticsearch process is too low, increase to at least [65536] the maximum number of files opened at the same time for each process is too small

2. max number of threads [3818] for user [es] is too low, increase to at least [4096]
You can make the following changes to change the size of the number of files that can be opened
[root@node01 elasticsearch]# vim /etc/security/limits.conf
*               soft    nofile          65536
*               hard    nofile          65536
*               soft    nproc           4096
*               hard    nproc           4096
#Note: after the above configuration is modified, you need to exit the current user and log in again to take effect
#After you log in again, you can use the following command to see if it works
#View the maximum number of threads
[root@node01 elasticsearch]# ulimit -Hu
4096
[root@node01 elasticsearch]# ulimit -Su
4096
#View the maximum number of files opened at the same time per process
[root@node01 elasticsearch]# ulimit -Sn
65536
[root@node01 elasticsearch]# ulimit -Hn
65536
3. Configure es cluster
1) node01 is configured as follows
[root@node01 ~]# vim /etc/elasticsearch/elasticsearch.yml     #Modify es master profile
cluster.name: my-es       #cluster name
node.name: node01        #es node name
bootstrap.memory_lock: false      #Do not lock memory at startup
network.host: 0.0.0.0           #Monitor address
http.port: 9200                 #Monitor port
discovery.seed_hosts: ["node01", "node02", "node03"]    #The host nodes participating in the cluster are specified here
cluster.initial_master_nodes: ["node01", "node02", "node03"]     #Ditto
#Add the following at the end of the configuration file, which is required when es head connects to es cluster
http.cors.enabled: true                #Add this line to enable cross domain access support
http.cors.allow-origin: "*"            #Add this line to cross domain access the allowed domain name address
#Start the service and send the modified configuration file to other nodes
[root@node01 ~]# systemctl start elasticsearch
[root@node01 ~]# scp /etc/elasticsearch/elasticsearch.yml root@node02:/etc/elasticsearch/
[root@node01 ~]# scp /etc/elasticsearch/elasticsearch.yml root@node03:/etc/elasticsearch/
2) Configure other nodes
#node02 node configuration is as follows (just modify the node name)
[root@node02 ~]# sed -i 's#node.name: node01#node.name: node02#g' /etc/elasticsearch/elasticsearch.yml
[root@node02 ~]# systemctl start elasticsearch
#node03 node configuration is as follows
[root@node03 ~]# sed -i 's#node.name: node01#node.name: node03#g' /etc/elasticsearch/elasticsearch.yml
[root@node03 ~]# systemctl start elasticsearch
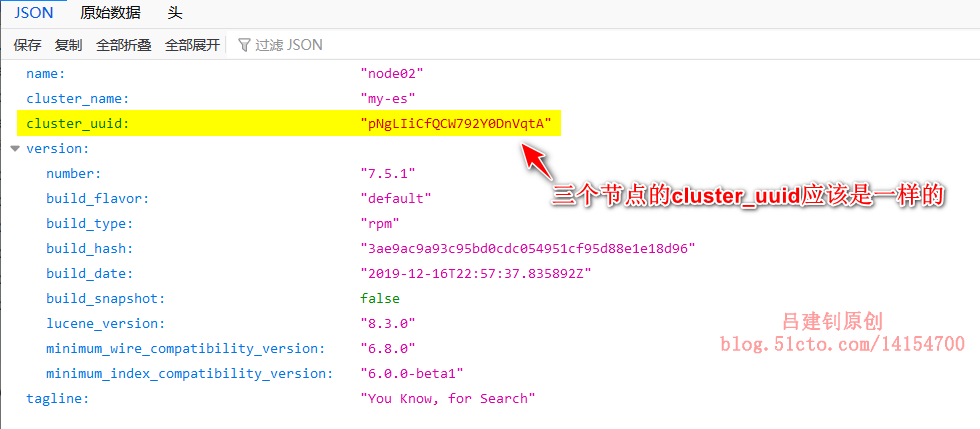
3) Check if the cluster is configured successfully
Visit port 9200 of each node, and you can see the following page:
4. Configure elasticsearch head
Google provides the elasticsearch head plug-in, which can be installed by searching in the app store as follows:
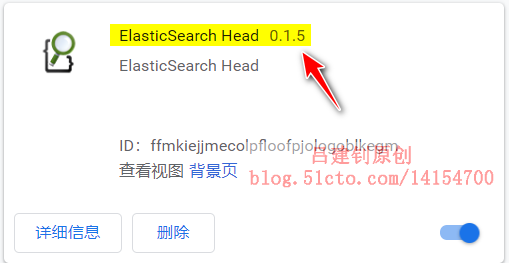
Although you can use the plug-in for chrome, every user needs to install chrome and the ElasticSearch Head plug-in. Because google is currently limited by domestic restrictions, it is difficult to install chrome. As an alternative, we can install the ElasticSearch Head application on the linux server.
The plug-in is github Yes, please refer to the installation.
Note: the following configuration can be performed at one of the nodes
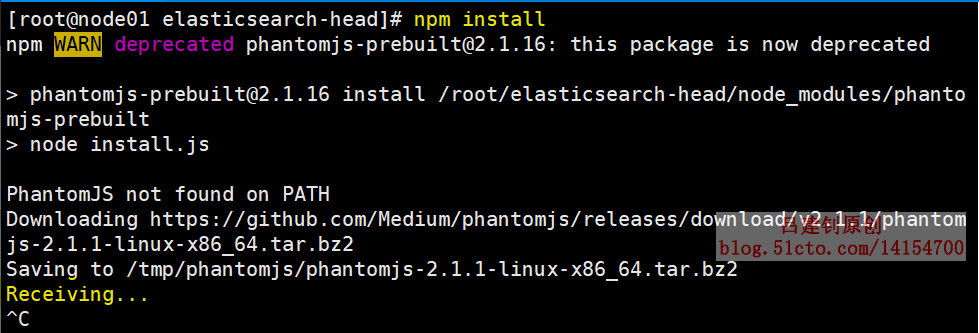
[root@node01 ~]# git clone git://github.com/mobz/elasticsearch-head.git
[root@node01 ~]# cd elasticsearch-head/
#Install epel source and update openssl
[root@node01 elasticsearch-head]# yum -y install epel-release
[root@node01 elasticsearch-head]# yum -y update openssl
#Install npm (Note: you must install epel source to install npm)
[root@node01 elasticsearch-head]# yum -y install npm
[root@node01 elasticsearch-head]# npm install
Note: when executing the npm install command, if you stay in the following interface for a long time or report an error, just run the command again after the termination of Ctrl+c.
Start elasticsearch head in the background, otherwise the current terminal will be occupied all the time:
[root@node01 elasticsearch-head]# npm run start &   #Background boot
[root@node01 ~]# ss -lnp | grep 9100          #Make sure the 9100 port is listening
The browser accesses the 9100 port of the host where the elasticsearch head is located and connects to the 9200 port of the es cluster. You can view the cluster status in the browser as follows:
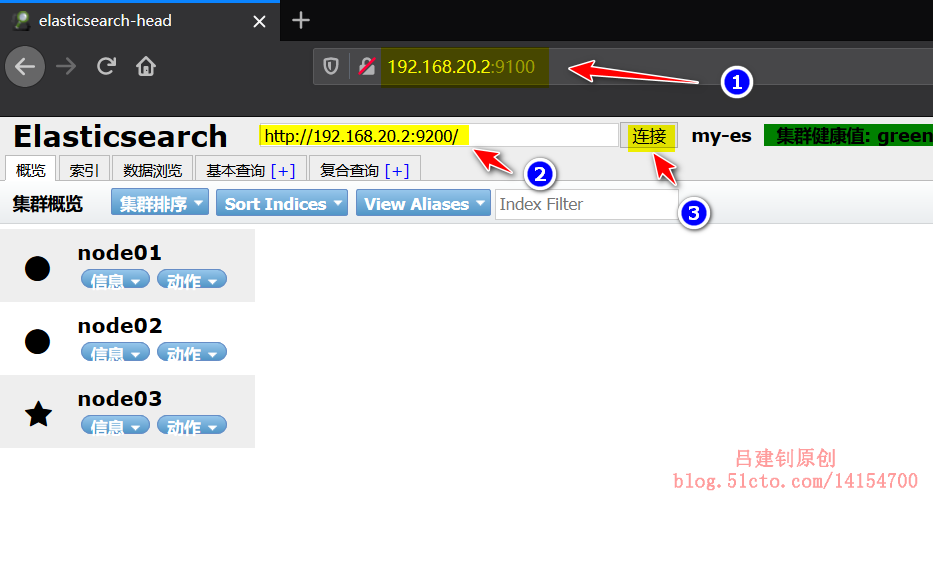
Note: Elasticsearch does not allow third-party access by default. You can modify the configuration file elasticsearch.yml of Elasticsearch and add the following configuration (I added the following configuration when I first modified the configuration file):
http.cors.enabled: true
http.cors.allow-origin: "*"
5. Install kibana
1) Download and install kibana
[root@node01 ~]# wget https://artifacts.elastic.co/downloads/kibana/kibana-7.5.1-x86_64.rpm
[root@node01 src]# rpm -ivh kibana-7.5.1-x86_64.rpm
2) Configure kibana
[root@node01 ~]# vim /etc/kibana/kibana.yml       #Edit Master profile
server.host: "0.0.0.0"         #Specify kibana listening address
elasticsearch.hosts: ["http://192.168.20.2:9200","http://192.168.20.7:9200","http://192.168.20.8:9200"]
#Specify the es listening address. You can write the listening address of a node in the cluster
kibana.index: ".kibana"             #Add. kibana index to elastic search
#Set startup and start kibana
[root@node01 ~]# systemctl enable kibana
[root@node01 ~]# systemctl start kibana
[root@node01 ~]# ss -lnp | grep 5601          #Make sure the kibana port is listening
tcp    LISTEN     0      128       *:5601                  *:*                   users:(("node",pid=2593,fd=28))
2) Chinese kibana (optional)
Due to the version before kibana 7, the official does not support Chinese, so you need to download the patch pack separately.
Address: https://github.com/anbai-inc/Kibana_Hanization
In the version of kibana 7, the Chinese option has been added officially. Only the configuration file of kibana needs to be modified, as follows:
[root@node01 bin]# sed -i 's/#i18n.locale: "en"/i18n.locale: "zh-CN"/g' /etc/kibana/kibana.yml
Note: after modifying the configuration file, remember to restart it!
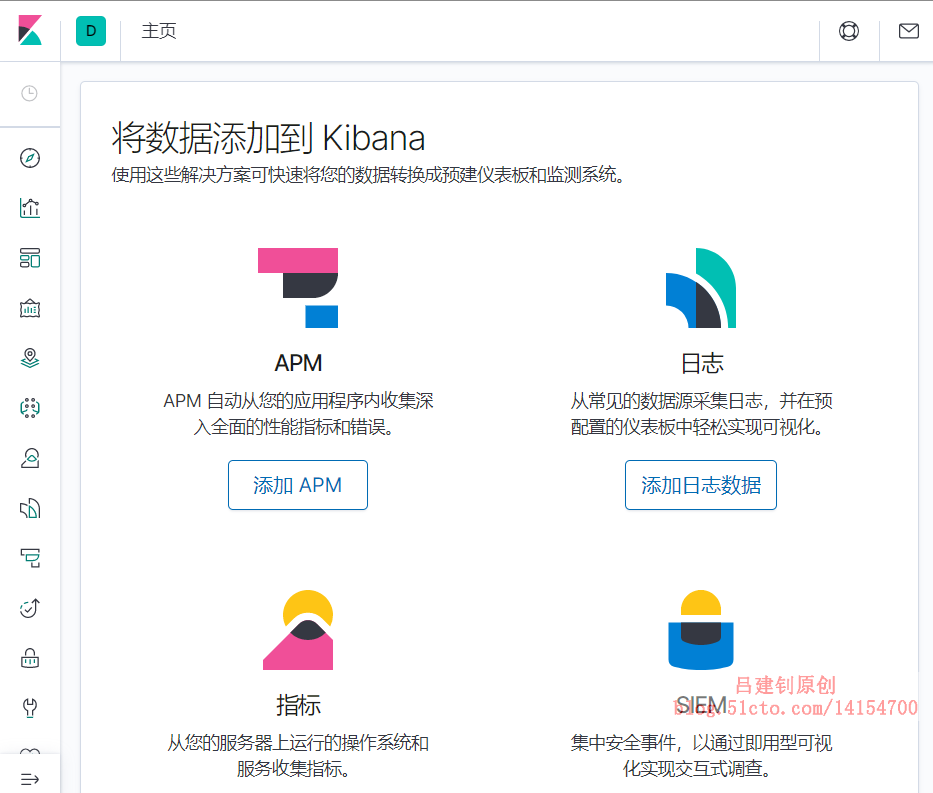
After startup, access port 5601 of the host, and you can see the following interface:
6. Install logstash to collect logs
In the actual production environment, most of the small and medium-sized architectures may be as follows: filebeat = = "kafka =", logstash = ", elastic search =", kibana. I just want to install and configure some components of the new version, so I omit the first two and use logstash to collect the host logs directly.
Note: the logs with nginx are collected below. Please configure nginx yourself.
#Download logstash and install
[root@node01 src]# wget https://artifacts.elastic.co/downloads/logstash/logstash-7.5.1.rpm
[root@node01 src]# rpm -ivh logstash-7.5.1.rpm
#Set power on self start
[root@node01 src]# systemctl daemon-reload
[root@node01 src]# systemctl enable logstash.service
#Edit profile, collect log
[root@node01 src]# cd /etc/logstash/conf.d/
[root@node01 conf.d]# vim nginx_log.conf
input {
    file{
      path => "/var/log/messages"
      type => "system"
      start_position => "beginning"
        }
    file{
       path => "/var/log/nginx/access.log"
       type => "access"
       start_position => "beginning"
        }
    file{
       path => "/var/log/nginx/error.log"
       type => "error"
       start_position => "beginning"
        }
    }

output {
    if [type] == "system" {
        elasticsearch {
            hosts => ["192.168.20.2:9200"]
            index => "system-%{+YYYY.MM.dd}"
            }
            }
    if [type] == "access" {
        elasticsearch {
            hosts => ["192.168.20.2:9200"]
            index => "access-%{+YYYY.MM.dd}"
            }
            }

    if [type] == "error" {
        elasticsearch {
            hosts => ["192.168.20.2:9200"]
            index => "error-%{+YYYY.MM.dd}"
            }
            }
}
[root@node01 conf.d]# chmod +r /var/log/messages       #Give read permission to others in the directory
[root@node01 conf.d]# ln -sf /usr/share/logstash/bin/logstash /usr/local/bin/    #Soft connect commands
[root@node01 conf.d]# systemctl start logstash     #Startup service
[root@node01 conf.d]# logstash -f nginx_log.conf &    #Put it into background operation
7. Log in to es to see if index is created
The display is as follows, indicating normal:
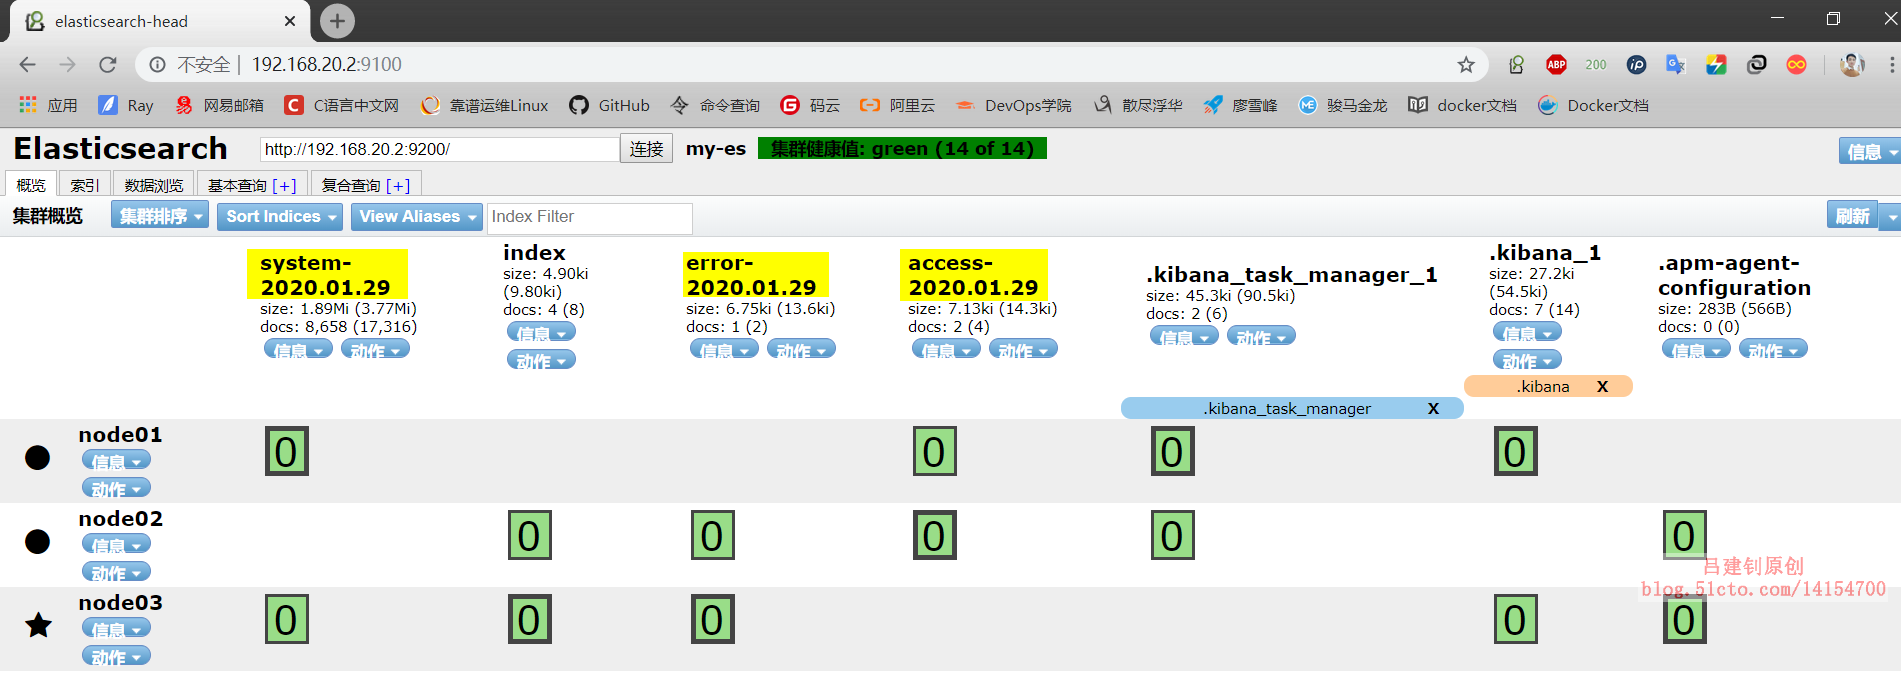
Well, as for how kibana adds indexes, do your own research. I have no patience to write. Please refer to me Previous posts To add indexes on kibana.