With more and more cloud and cluster scenarios, the demand for deploying KubeSphere in various cloud vendor environments increases. Because the cloud resource usage rules and menu navigation bar of each cloud manufacturer are different, users will spend a lot of time troubleshooting. In order to reduce the error rate in the deployment process, this tutorial uses Huawei cloud platform to deploy a set of highly available KubeSphere, hoping to help you improve the deployment experience.
1, Pre deployment preparation
The resources of the required environment can meet the following conditions:
| Huawei cloud products | quantity | purpose | remarks |
|---|---|---|---|
| ECS ECS | 6 | master,node | |
| VPC | 1 | Available area | |
| ELB | 2 | load balancing | |
| Security group | 1 | Access control | |
| Public IP | 7 | Internet access |
2, Cloud platform resource initialization
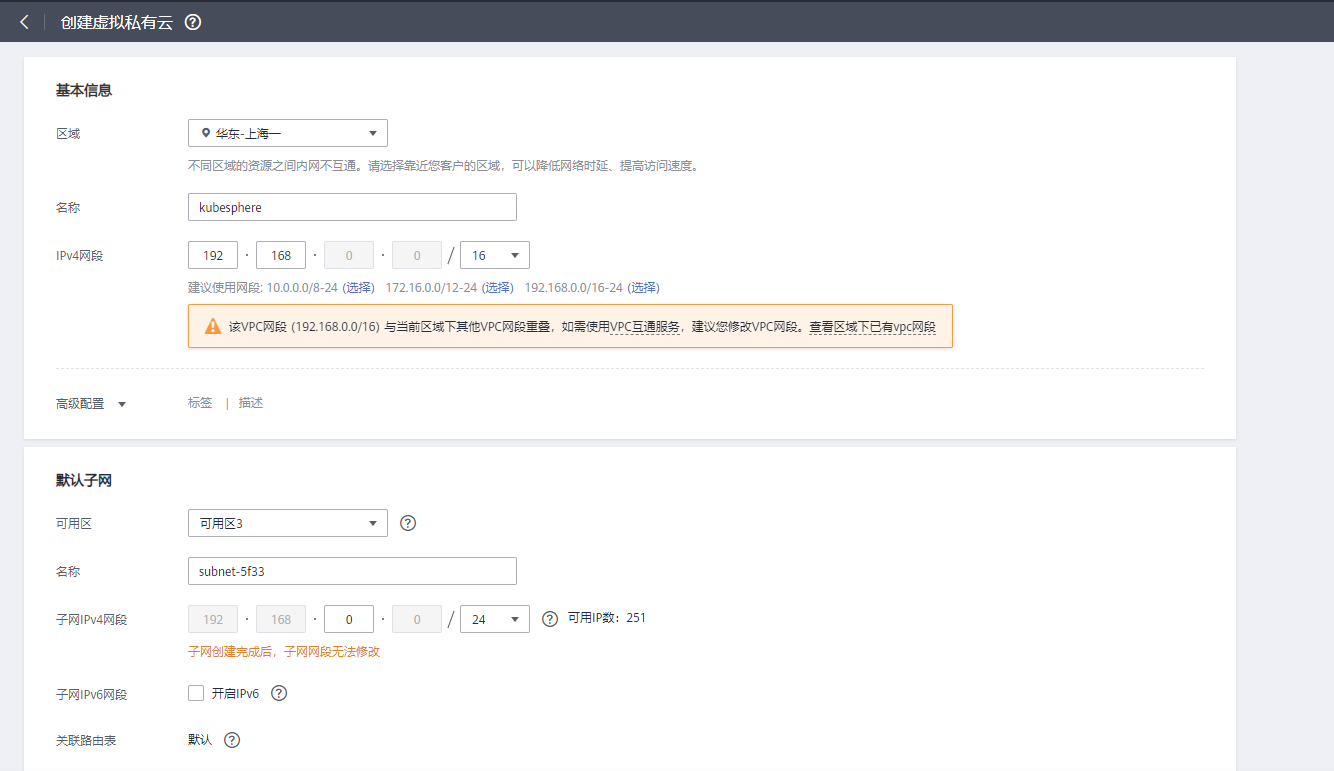
1. Create VPC
Enter Huawei cloud control, select "virtual private cloud" from the list on the left, and select "create virtual private cloud" to create a VPC. The configuration is as follows:
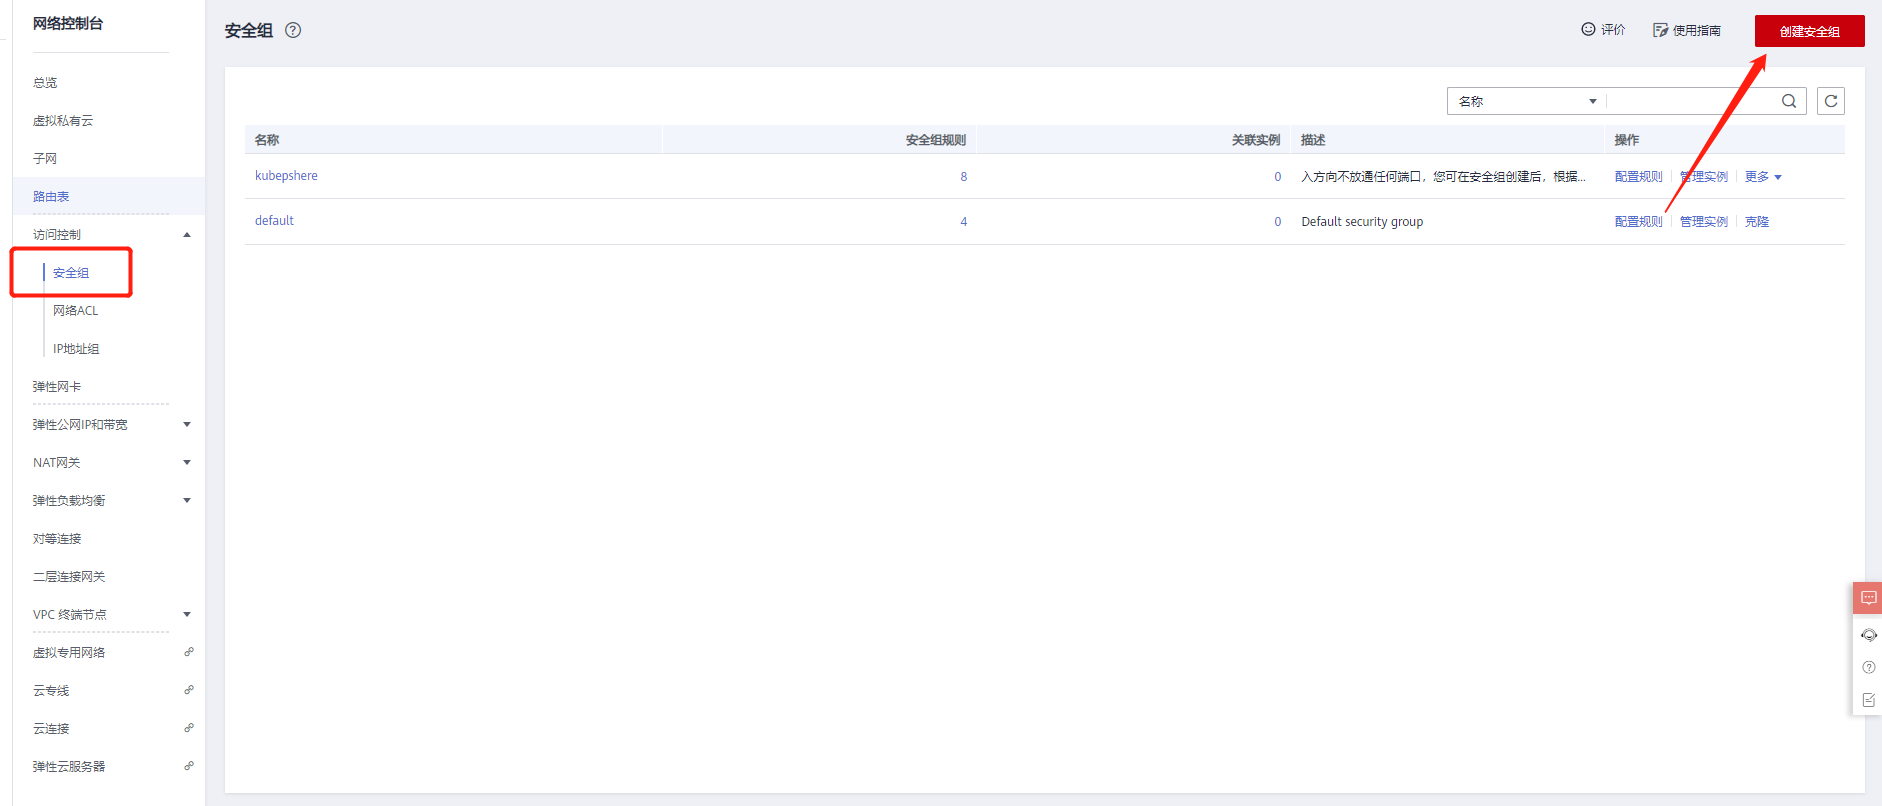
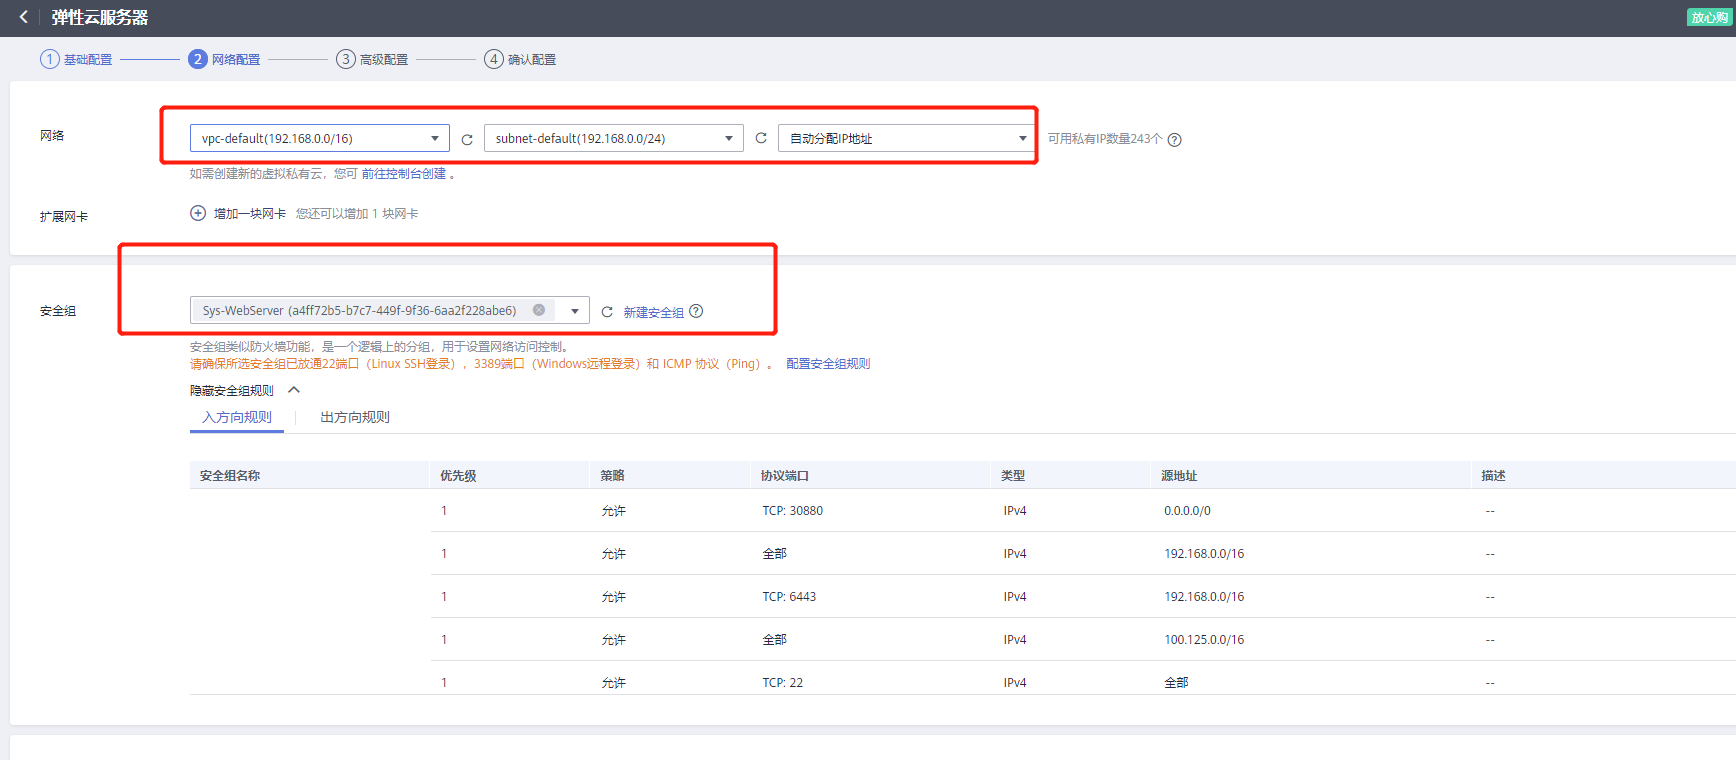
2. Create a security group
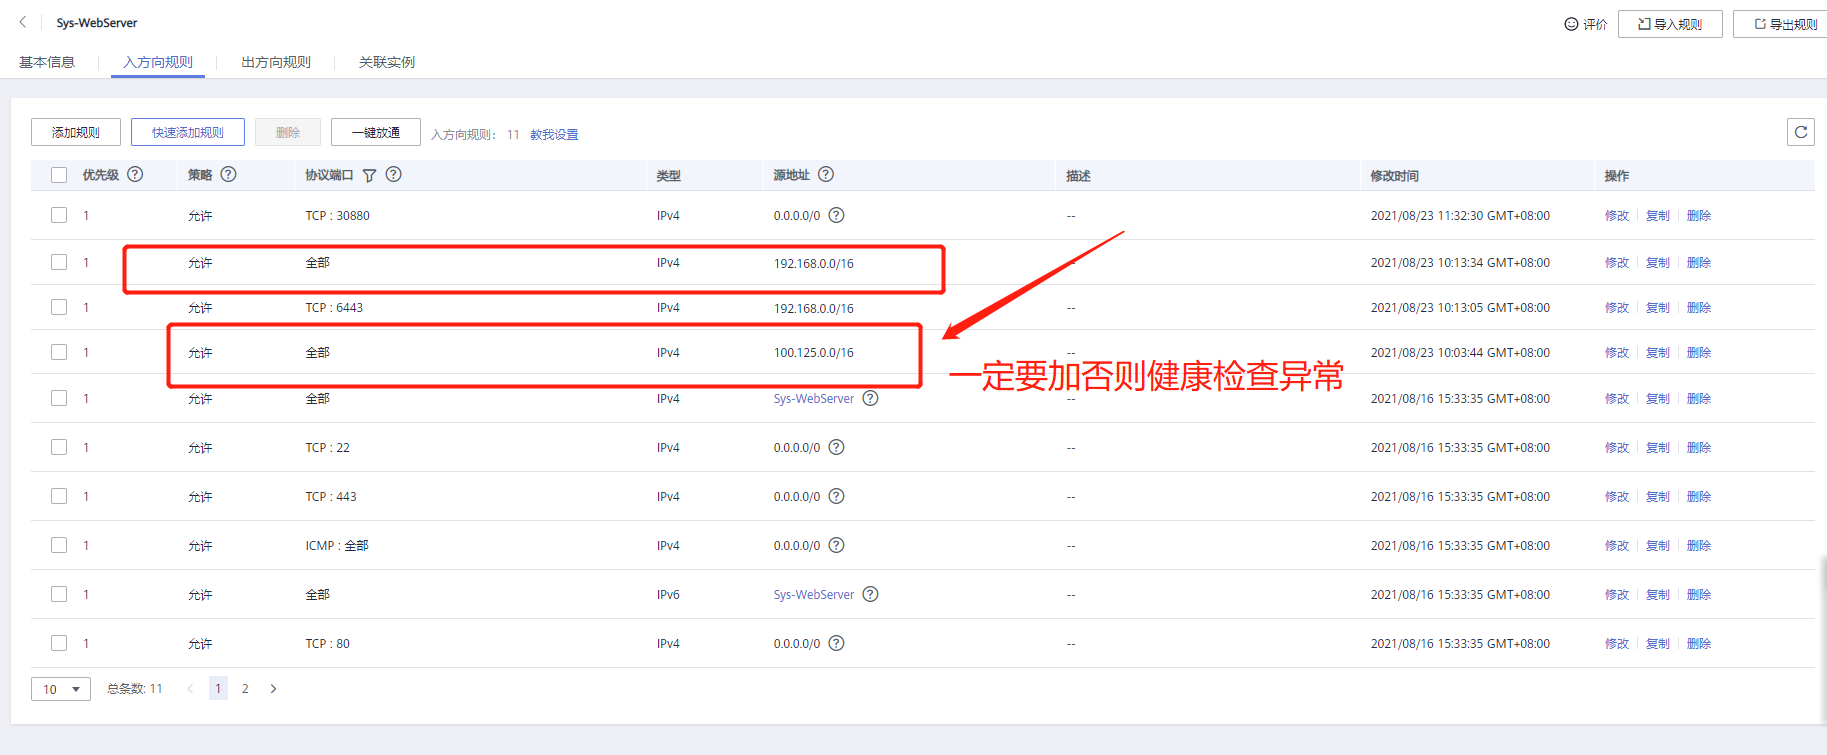
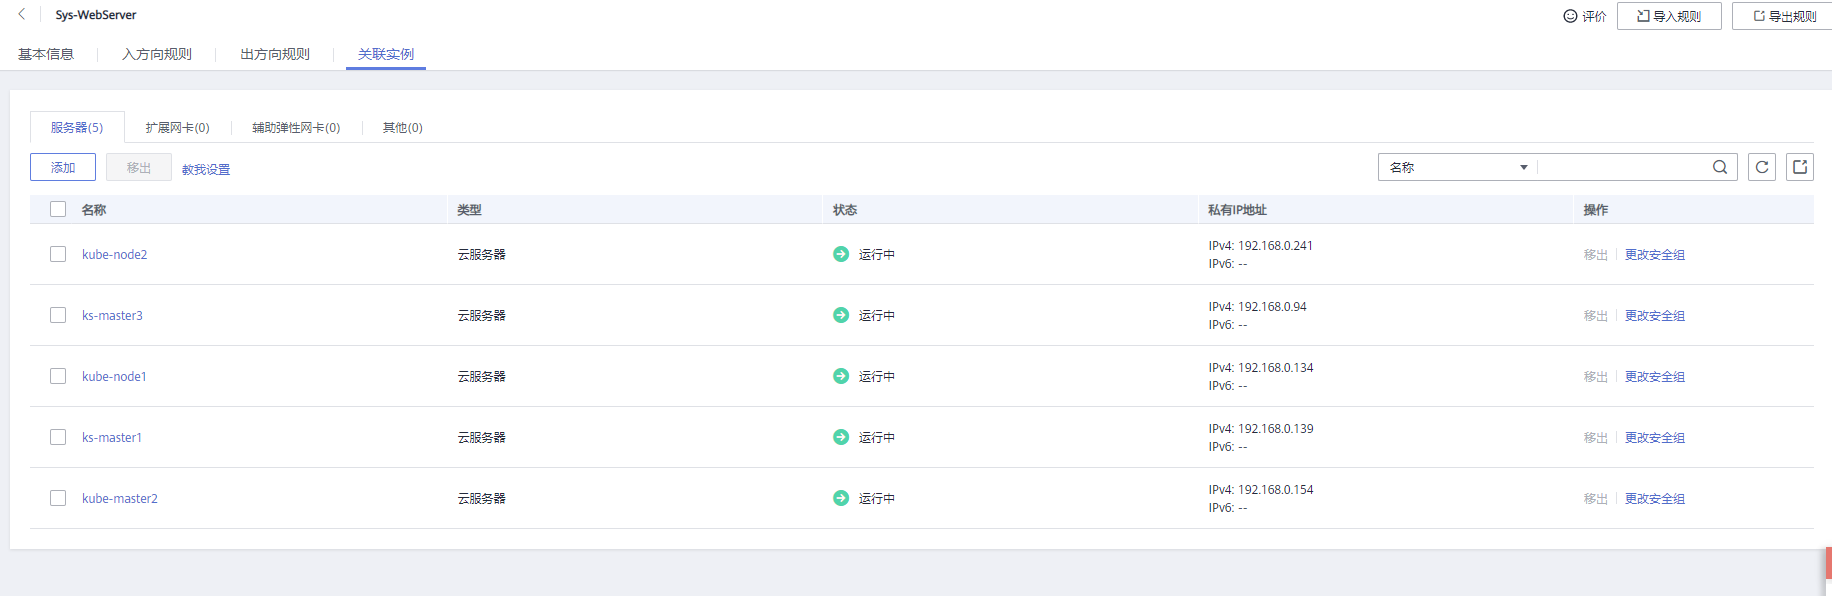
Create a security group and set the rules and association instances of the input direction. Refer to the following:
3. Create an instance
In network configuration, select the VPC and subnet created in the first step. In security groups, select the security group you created in the previous step.
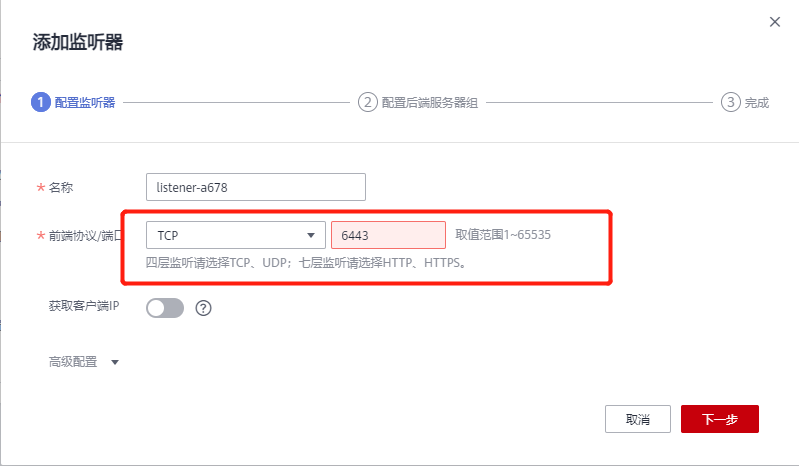
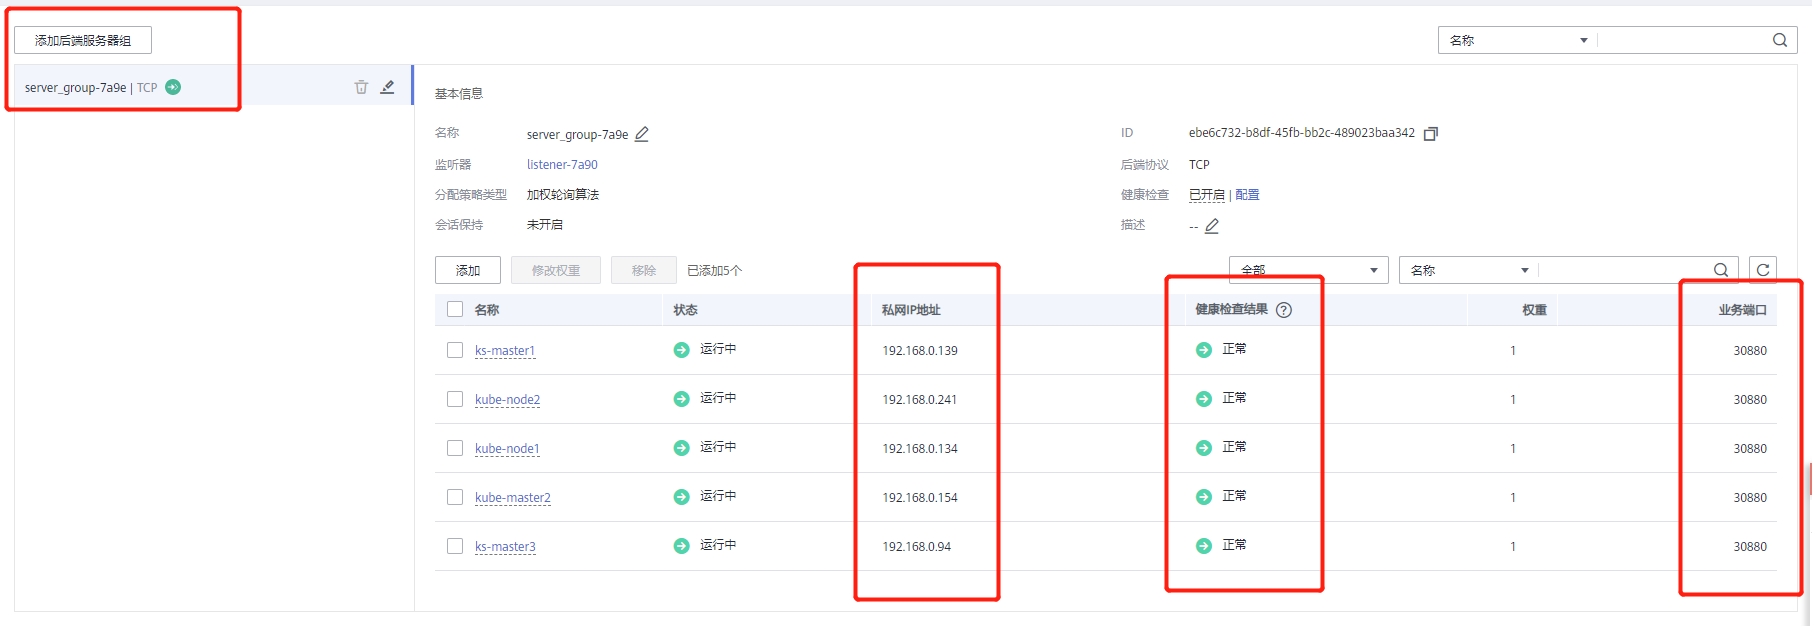
4. Create load balancer (internal and external)
Intranet ELB:
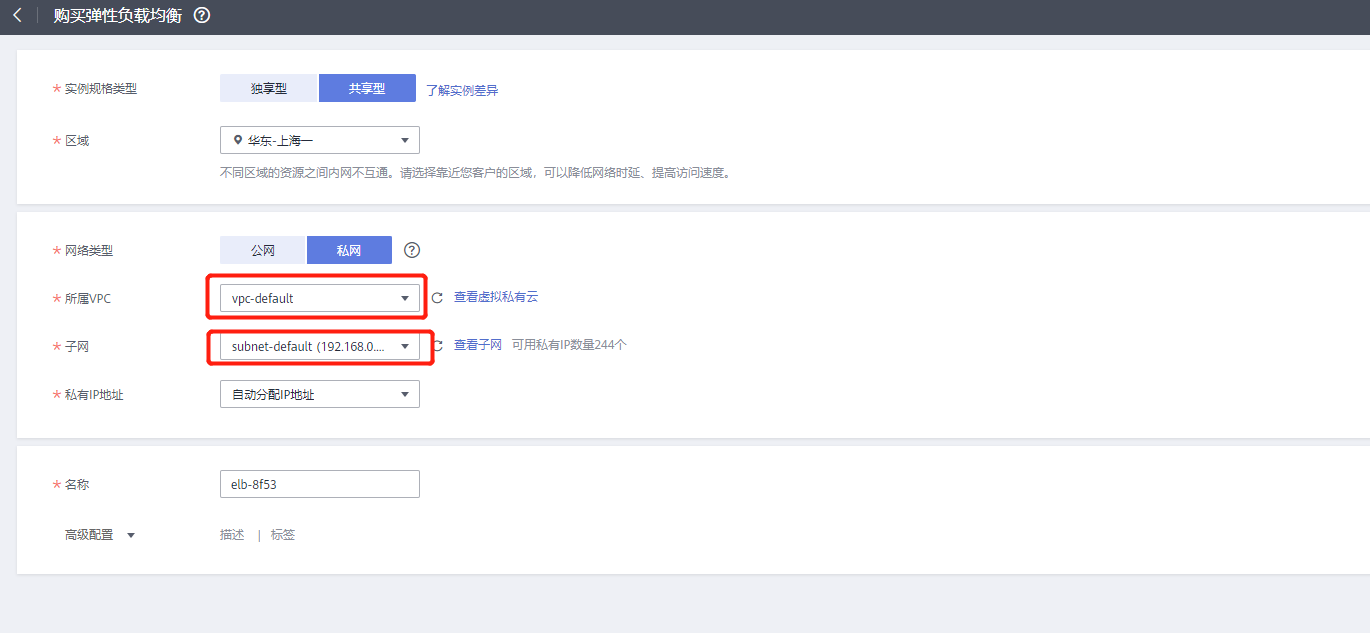
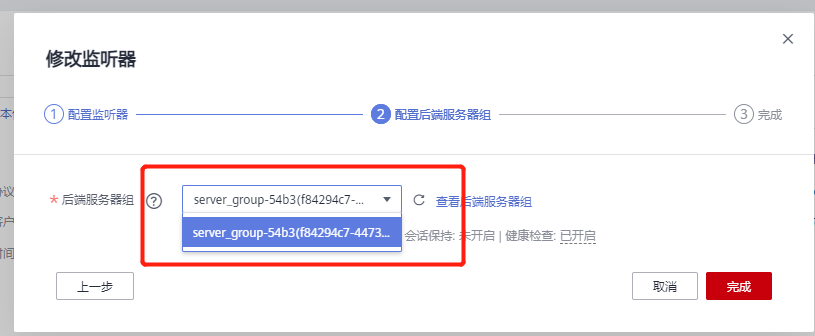
Internet ELB:
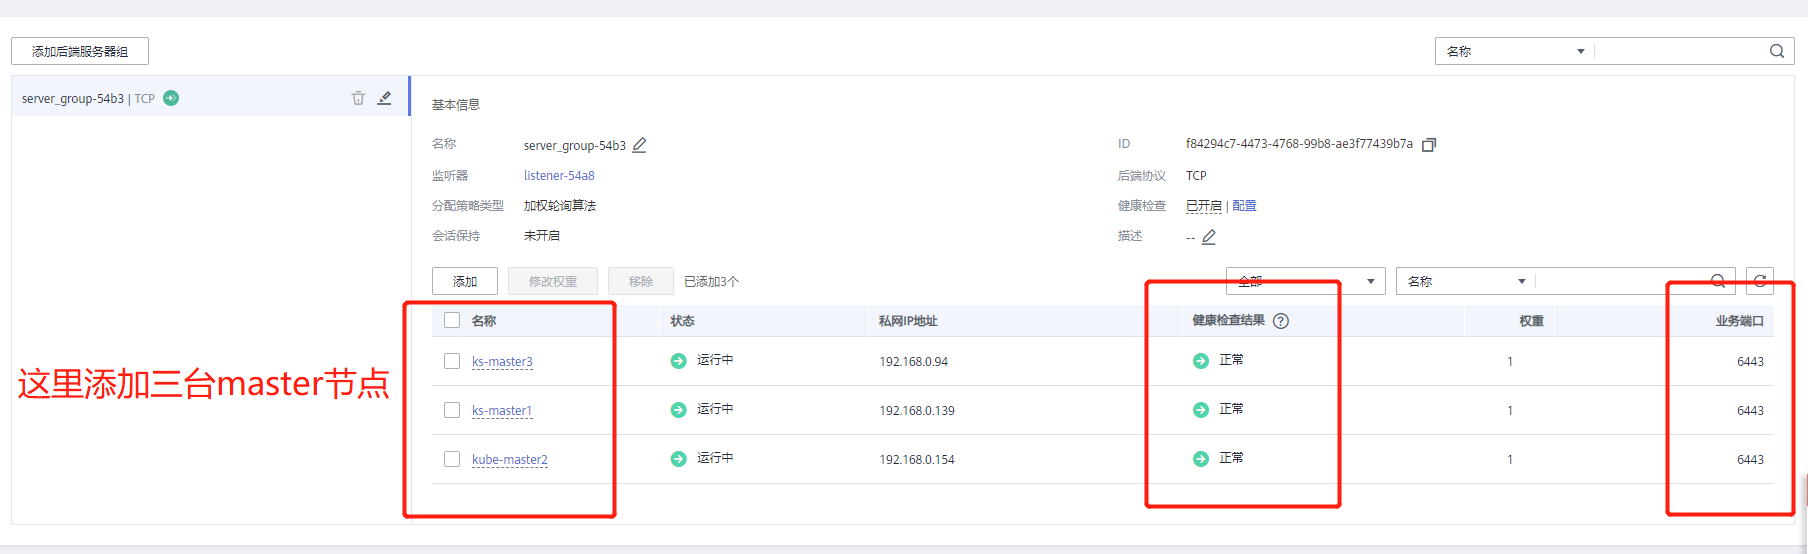
If the cluster needs to configure public network access, it needs to configure a public IP for the external network load balancer, add back-end listeners for all nodes, and the listening port is 80 (port 30880 is used in the test, and port 80 here also needs to be opened in the security group).
Configuration file config Yaml needs to configure the address (VIP) assigned by the intranet SLB created earlier
 controlPlaneEndpoint:
         domain: lb.kubesphere.local
         address: "192.168.0.205"
         port: "6443"
Deploy KubeSphere platform
1. Download KK
$ curl -sfL https://get-kk.kubesphere.io | VERSION=v1.1.1 sh -
2. Add execution permission
$ chmod +x kk
3. Deploy with kubekey
$ ./kk create config --with-kubesphere v3.1.1 --with-kubernetes v1.17.9 -f master-HA.yaml
4. Cluster configuration adjustment
apiVersion: kubekey.kubesphere.io/v1alpha1
kind: Cluster
metadata:
  name: master-HA
spec:
  hosts:
  - {name: master1, address: 192.168.1.10, internalAddress: 192.168.1.10, password: yourpassword} # Assume that the default port for SSH is 22, otherwise add the port number after the IP address as above
  - {name: master2, address: 192.168.1.11, internalAddress: 192.168.1.11, password: yourpassword} # Assume that the default port for SSH is 22, otherwise add the port number after the IP address as above
  - {name: master3, address: 192.168.1.12, internalAddress: 192.168.1.12, password: yourpassword} # Assume that the default port for SSH is 22, otherwise add the port number after the IP address as above
  - {name: node1, address:  192.168.1.13, internalAddress: 192.168.1.13, password: yourpassword} # Assume that the default port for SSH is 22, otherwise add the port number after the IP address as above
  - {name: node2, address: 192.168.1.14, internalAddress: 192.168.1.14, password: yourpassword} # Assume that the default port for SSH is 22SSH is 22, otherwise add the port number after the IP address as above
  - {name: node3, address: 192.168.1.15, internalAddress: 192.168.1.15, password: yourpassword} # Assume that the default port for SSH is 22, otherwise add the port number after the IP address as above
  roleGroups:
    etcd:
     - master[1:3]
    master:
     - master[1:3]
    worker:
     - node[1:3]
  controlPlaneEndpoint:
    domain: lb.kubesphere.local
    address: "192.168.1.8"
    port: "6443"
  kubernetes:
    version: v1.17.9
    imageRepo: kubesphere
    clusterName: cluster.local
    masqueradeAll: false  # masqueradeAll tells kube-proxy to SNAT everything if using the pure iptables proxy mode. [Default: false]
    maxPods: 110  # maxPods is the number of pods that can run on this Kubelet. [Default: 110]
    nodeCidrMaskSize: 24  # internal network node size allocation. This is the size allocated to each node on your network. [Default: 24]
    proxyMode: ipvs  # mode specifies which proxy mode to use. [Default: ipvs]
  network:
    plugin: calico
    calico:
      ipipMode: Always  # IPIP Mode to use for the IPv4 POOL created at start up. If set to a value other than Never, vxlanMode should be set to "Never". [Always | CrossSubnet | Never] [Default: Always]
      vxlanMode: Never  # VXLAN Mode to use for the IPv4 POOL created at start up. If set to a value other than Never, ipipMode should be set to "Never". [Always | CrossSubnet | Never] [Default: Never]
      vethMTU: 1440  # The maximum transmission unit (MTU) setting determines the largest packet size that can be transmitted through your network. [Default: 1440]
    kubePodsCIDR: 10.233.64.0/18
    kubeServiceCIDR: 10.233.0.0/18
  registry:
    registryMirrors: ["https://*.mirror.aliyuncs.com"] # # input your registryMirrors
    insecureRegistries: []
    privateRegistry: ""
  storage:
    defaultStorageClass: localVolume
    localVolume:
      storageClassName: local

---
apiVersion: installer.kubesphere.io/v1alpha1
kind: ClusterConfiguration
metadata:
  name: ks-installer
  namespace: kubesphere-system
  labels:
    version: v3.1.1
spec:
  local_registry: ""
  persistence:
    storageClass: ""
  authentication:
    jwtSecret: ""
  etcd:
    monitoring: true        # Whether to install etcd monitoring dashboard
    endpointIps: 192.168.1.10,192.168.1.11,192.168.1.12  # etcd cluster endpointIps
    port: 2379              # etcd port
    tlsEnable: true
  common:
    mysqlVolumeSize: 20Gi # MySQL PVC size
    minioVolumeSize: 20Gi # Minio PVC size
    etcdVolumeSize: 20Gi  # etcd PVC size
    openldapVolumeSize: 2Gi   # openldap PVC size
    redisVolumSize: 2Gi # Redis PVC size
    es:  # Storage backend for logging, tracing, events and auditing.
      elasticsearchMasterReplicas: 1   # total number of master nodes, it's not allowed to use even number
      elasticsearchDataReplicas: 1     # total number of data nodes
      elasticsearchMasterVolumeSize: 4Gi   # Volume size of Elasticsearch master nodes
      elasticsearchDataVolumeSize: 20Gi    # Volume size of Elasticsearch data nodes
      logMaxAge: 7                     # Log retention time in built-in Elasticsearch, it is 7 days by default.
      elkPrefix: logstash              # The string making up index names. The index name will be formatted as ks-<elk_prefix>-log
      # externalElasticsearchUrl:
      # externalElasticsearchPort:
  console:
    enableMultiLogin: false  # enable/disable multiple sing on, it allows an account can be used by different users at the same time.
    port: 30880
  alerting:                # Whether to install KubeSphere alerting system. It enables Users to customize alerting policies to send messages to receivers in time with different time intervals and alerting levels to choose from.
    enabled: true
  auditing:                # Whether to install KubeSphere audit log system. It provides a security-relevant chronological set of records,recording the sequence of activities happened in platform, initiated by different tenants.
    enabled: true
  devops:                  # Whether to install KubeSphere DevOps System. It provides out-of-box CI/CD system based on Jenkins, and automated workflow tools including Source-to-Image & Binary-to-Image
    enabled: true
    jenkinsMemoryLim: 2Gi      # Jenkins memory limit
    jenkinsMemoryReq: 1500Mi   # Jenkins memory request
    jenkinsVolumeSize: 8Gi     # Jenkins volume size
    jenkinsJavaOpts_Xms: 512m  # The following three fields are JVM parameters
    jenkinsJavaOpts_Xmx: 512m
    jenkinsJavaOpts_MaxRAM: 2g
  events:                  # Whether to install KubeSphere events system. It provides a graphical web console for Kubernetes Events exporting, filtering and alerting in multi-tenant Kubernetes clusters.
    enabled: true
  logging:                 # Whether to install KubeSphere logging system. Flexible logging functions are provided for log query, collection and management in a unified console. Additional log collectors can be added, such as Elasticsearch, Kafka and Fluentd.
    enabled: true
    logsidecarReplicas: 2
  metrics_server:                    # Whether to install metrics-server. IT enables HPA (Horizontal Pod Autoscaler).
    enabled: true
  monitoring:                        #
    prometheusReplicas: 1            # Prometheus replicas are responsible for monitoring different segments of data source and provide high availability as well.
    prometheusMemoryRequest: 400Mi   # Prometheus request memory
    prometheusVolumeSize: 20Gi       # Prometheus PVC size
    alertmanagerReplicas: 1          # AlertManager Replicas
  multicluster:
    clusterRole: none  # host | member | none  # You can install a solo cluster, or specify it as the role of host or member cluster
  networkpolicy:       # Network policies allow network isolation within the same cluster, which means firewalls can be set up between certain instances (Pods).
    enabled: true
  notification:        # It supports notification management in multi-tenant Kubernetes clusters. It allows you to set AlertManager as its sender, and receivers include Email, Wechat Work, and Slack.
    enabled: true
  openpitrix:          # Whether to install KubeSphere App Store. It provides an application store for Helm-based applications, and offer application lifecycle management
    enabled: true
  servicemesh:         # Whether to install KubeSphere Service Mesh (Istio-based). It provides fine-grained traffic management, observability and tracing, and offer visualization for traffic topology
    enabled: true
5. Execute the command to create a cluster
# Specify the profile to create the cluster
$ ./kk create cluster --with-kubesphere v3.1.1 -f master-HA.yaml

# Check the KubeSphere installation log -- until the access address and login account of the console appear
$ kubectl logs -n kubesphere-system $(kubectl get pod -n kubesphere-system -l app=ks-install -o jsonpath='{.items[0].metadata.name}') -f
#####################################################
### Welcome to KubeSphere! ###
#####################################################
Console: http://192.168.1.10:30880
Account: admin
Password: P@88w0rd
NOTES:
1. After you log into the console, please check the
monitoring status of service components in
the "Cluster Management". If any service is not
ready, please wait patiently until all components
are up and running.
2. Please change the default password after login.
#####################################################
https://kubesphere.io 2020-08-28 01:25:54
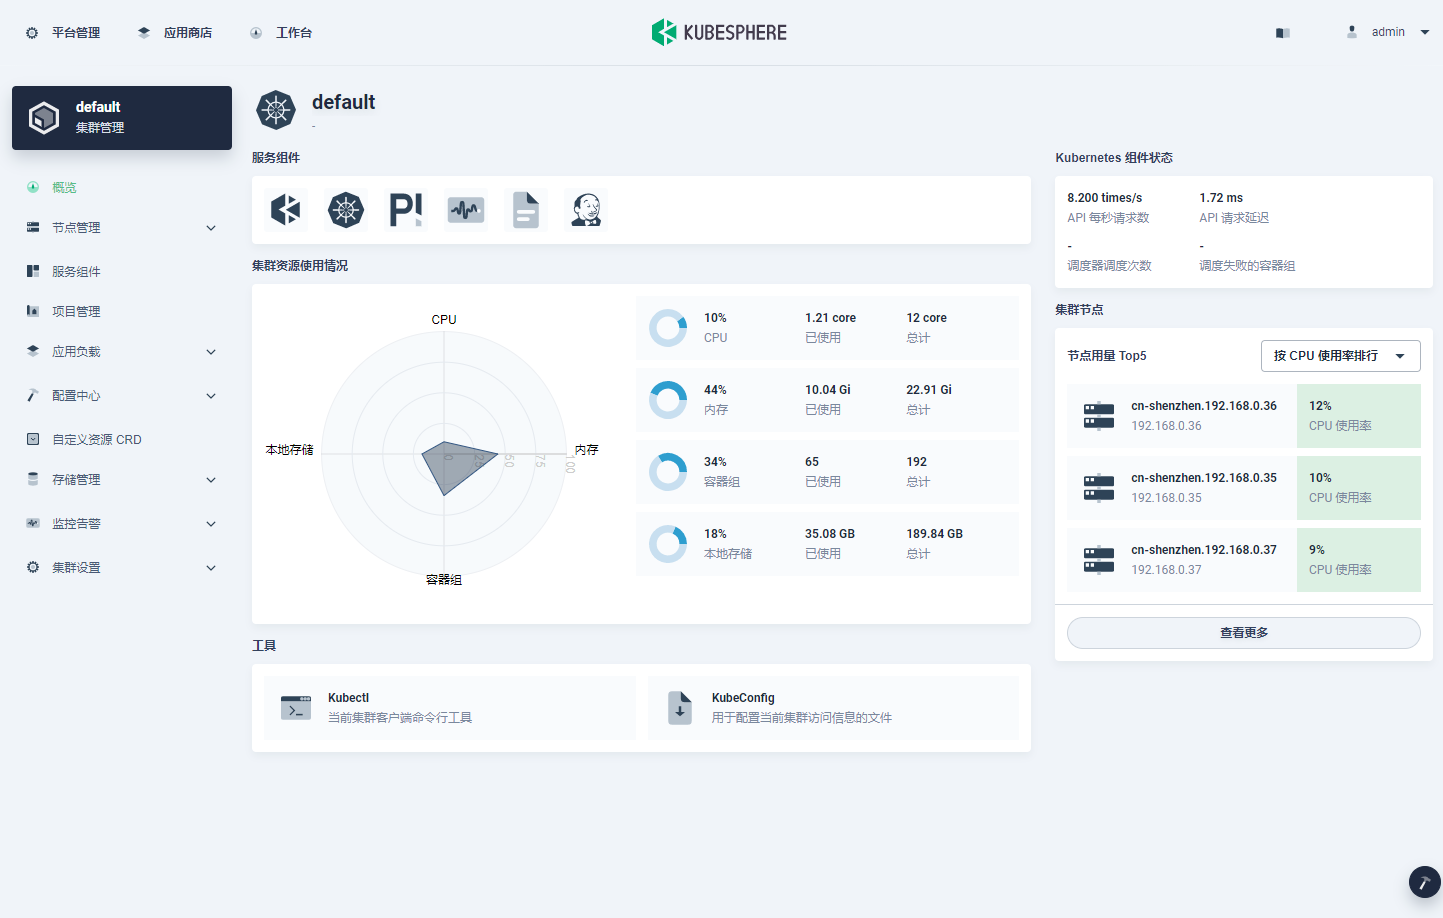
#####################################################Access public IP + Port is the usage after deployment, and the default account password (admin) is used/ P@88w0rd )In the article, the component installation is maximized. Log in and click Platform Management > cluster management to see the installed component list and machine situation in the figure below. On the cluster overview page, you can see the dashboard as shown in the following figure.
This article is composed of blog one article multi posting platform OpenWrite release!