Installation and use of Nmon

1, Download Nmon
Select and download the corresponding version according to the type of CPU:
http://nmon.sourceforge.net/pmwiki.php?n=Site.Download
wget http://sourceforge.net/projects/nmon/files/download/nmon_x86_12a.zip
2, Initialization tool
1 2 3 4 [root@mululu ~]# cd /opt [root@mululu opt]# mkdir nmon [root@mululu opt]# cd nmon [root@mululu nmon]#wget <a href="http://sourceforge.net/projects/nmon/files/download/nmon_x86_12a.zip/download">http://sourceforge.net/projects/nmon/files/download/nmon_x86_12a.zip</a>
[root@mululu nmon]# unzip nmon_x86_12a.zip
Archive:  nmon_x86_12a.zip
  inflating: nmon_x86_rhel45
  inflating: nmon_x86_rhel52
  inflating: nmon_x86_sles9
  inflating: nmon_x86_sles10
  inflating: nmon_x86_ubuntu810
  inflating: nmon_x86_fedora10
  inflating: nmon_x86_opensuse10
[root@mululu nmon]# ls
nmon1             nmon_x86_fedora10    nmon_x86_rhel45  nmon_x86_sles10  nmon_x86_ubuntu810
nmon_x86_12a.zip  nmon_x86_opensuse10  nmon_x86_rhel52  nmon_x86_sles9
[root@mululu nmon]# mv nmon_x86_ubuntu810 nmon
[root@mululu nmon]# chmod +x nmon
[root@mululu nmon]#ls
nmon nmon1 nmon_x86_12a.zip nmon_x86_fedora10 nmon_x86_opensuse10 nmon_x86_rhel45 nmon_x86_rhel52 nmon_x86_sles10 nmon_x86_sles9
Then run nmon directly. Running nmon directly can monitor the use of system resources in real time. Perform the following steps to display the report of system resource consumption for a period of time.
The following is a screenshot of real-time monitoring system resource consumption by directly executing nmon command:
[root@mululu nmon]#./nmon
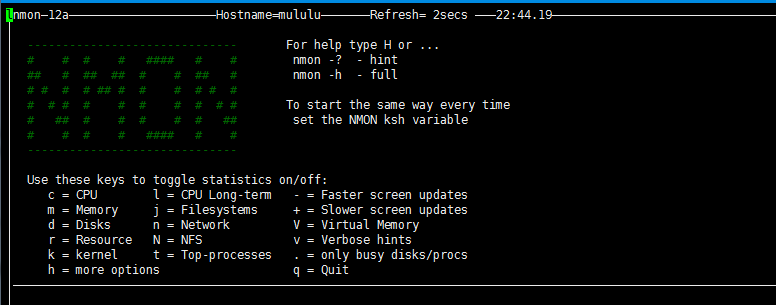
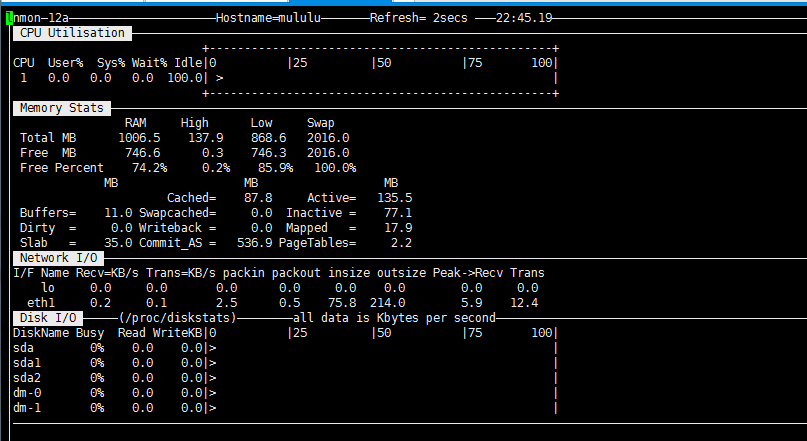
The consumption of CPU, memory, disk and network are intuitively displayed.
Press "C" to view CPU related information;
Press "D" to view disk information;
Press "T" to view the process information of the system;
"M" corresponds to memory, "N" corresponds to network, etc;
The corresponding contents of complete shortcut keys can be viewed through help (press "H").
It can display CPU, memory and process information of Linux system, including CPU user, system, waiting and idle status values, available memory, cache size, CPU consumption of process and other detailed indicators. This method has strong real-time information display, and can timely grasp the operation of the system under pressure, the utilization rate of each CPU, memory usage, network traffic, disk reading and writing... These data are refreshed in real time and clear at a glance.
3, Generate nmon report.
1) . data collection:
#./nmon -s10 -c60 -f -m /home/
Parameter interpretation:
-s10 collect data every 10 seconds.
-c60 collects 60 times, that is, collect data for ten minutes.
-f the generated data file name contains the time when the file was created.
-m the storage directory of the generated data file.
An nmon file is generated and updated every ten seconds until ten minutes later.
Generated file name, such as: _ 090824_1306.nmon, "", is the hostname of this host.
nmon -h for more help.

Solution:
Let's see which package this command belongs to:
[root@mululu ~]#  yum provides */lsb_release
Loaded plugins: fastestmirror
Loading mirror speeds from cached hostfile
* base: mirrors.psychz.net
* epel: mirrors.solfo.com
* extras: mirror.san.fastserv.com
* updates: mirror.lax.hugeserver.com
base/filelists_db                                                       | 5.1 MB     00:00
epel/filelists_db                                                       | 7.8 MB     00:00
extras/filelists_db                                                     |  31 kB     00:00
updates/filelists_db                                                    | 614 kB     00:00
vz-base/filelists                                                       |  825 B     00:00
vz-updates/filelists                                                    | 3.0 kB     00:00
redhat-lsb-core-4.0-7.el6.centos.i686 : LSB base libraries support for CentOS
Repo        : base
Matched from:
Filename    : /usr/bin/lsb_release
dkms-2.2.0.3-28.git.7c3e7c5.el6.noarch : Dynamic Kernel Module Support Framework
Repo        : epel
Matched from:
Filename    : /usr/lib/dkms/lsb_release
dkms-2.2.0.3-26.el6.noarch : Dynamic Kernel Module Support Framework
Repo        : installed
Matched from:
Filename    : /usr/lib/dkms/lsb_release
redhat-lsb-core-4.0-7.el6.centos.i686 : LSB base libraries support for CentOS
Repo        : installed
Matched from:
Filename    : /usr/bin/lsb_release

It can be seen that it belongs to redhat-lsb This package, then use it next yum To install this package:
[root@mululu ~]# yum install  -y  redhat-lsb
[root@mululu ~]#lsb_release -r
2) . generate report:
Download nmon analyzer (a free tool for generating performance reports):
https://www.ibm.com/developerworks/community/wikis/home?lang=en#!/wiki/Power%20Systems/page/nmon_analyser
Transfer the previously generated nmon data file to the Windows machine, and open the analysis tool nmon analyzer v33c.xls with Excel. Click the "Analyze nmon data" button in the excel file and select the nmon data file to generate an analyzed result file: hostname_090824_1306.nmon.xls, open the generated file with Excel and you can see the results.
If the macro cannot run, you need to do the following:
Tools - > macro - > Security - > and then open the file and allow the macro to run.
The following is a screenshot of the NMON report generated in the test environment:
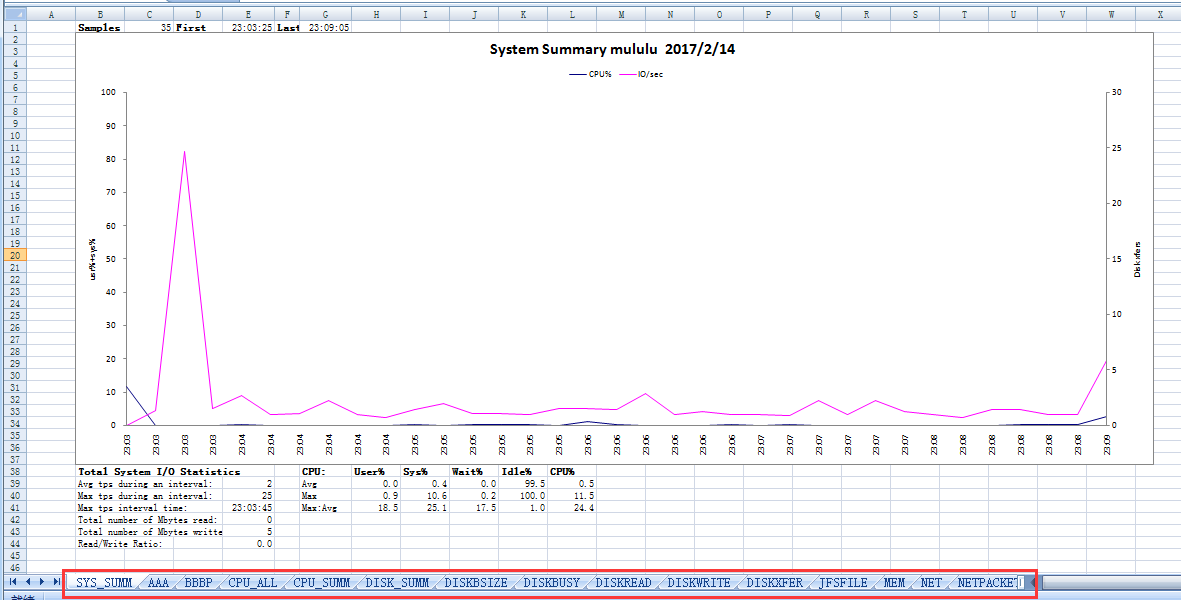
The red area is the analysis report of different indicators.
3).
Timed task
In addition to the short-term monitoring of performance test, we can also realize the regular monitoring of the system as a reference in the operation and maintenance stage. The realization of regular monitoring is as follows:
1) Execute command: #crontab – e
2) Add the following command on the last line:
0 8 * * 1,2,3,4,5 /nmon/nmon_x86_rhel5 -f -N -m /nmon/log -s 30 -c 1200
express:
From Monday to Friday, from 08:00 a.m., monitor for 10 hours (until 18:00 sharp), and output to / nmon/log
Automatic data collection by day:
Add a record in crontab:
0 0 * * * root nmon -s300 -c288 -f -m /home/ > /dev/null 2>&1
300 * 288 = 86400 seconds, just one day's data.