We use Apache Flume to collect data and store it in Kafka, and finally show it in ELK. reach http://flume.apache.org/ Download Apache Flume from the address of and deploy it to the log server after downloading. After downloading, unzip and configure it into environment variables. The overall idea is to search "test development engineer" on the dragline, store the obtained result information in Kafka's system, and finally display it in ELK. Configure these information in detail below. Edit the file in the directory of conf. the contents of the file are:
#Set agent name
agent.sources=s1
agent.channels=c1
agent.sinks=k1

#Set collection method
agent.sources.s1.type=exec
agent.sources.s1.command=tail -F  /Applications/devOps/bigData/ELK/apache-flume/logs/apps.log
agant.sources.s1.channels=c1
agent.channels.c1.type=memory
agent.channels.c1.capacity=10000
apage.channels.c1.transactionCapacity=100
#Set up kafka receiver
agent.sinks.k1.type=org.apache.flume.sink.kafka.KafkaSink
#Set the broker and port number of kafka
agent.sinks.k1.brokerList=localhost:9092
#Set topic of kafka
agent.sinks.k1.topic=laGou
#Set serialization
agent.sinks.k1.serializer.class=kafka.serializer.StringEncoder
#Specify the pipe name
agent.sinks.k1.channel=c1
The theme used here is laGou. Remember to start Kafka at this time. Next, start Apache Flume. Execute the following command in Apache Flume / bin to start it. The command is:
flume-ng agent -n agent --conf conf --conf-file ../conf/flume-kafka.properties -Dflume.root.logger=DEBUG,CONSOLE
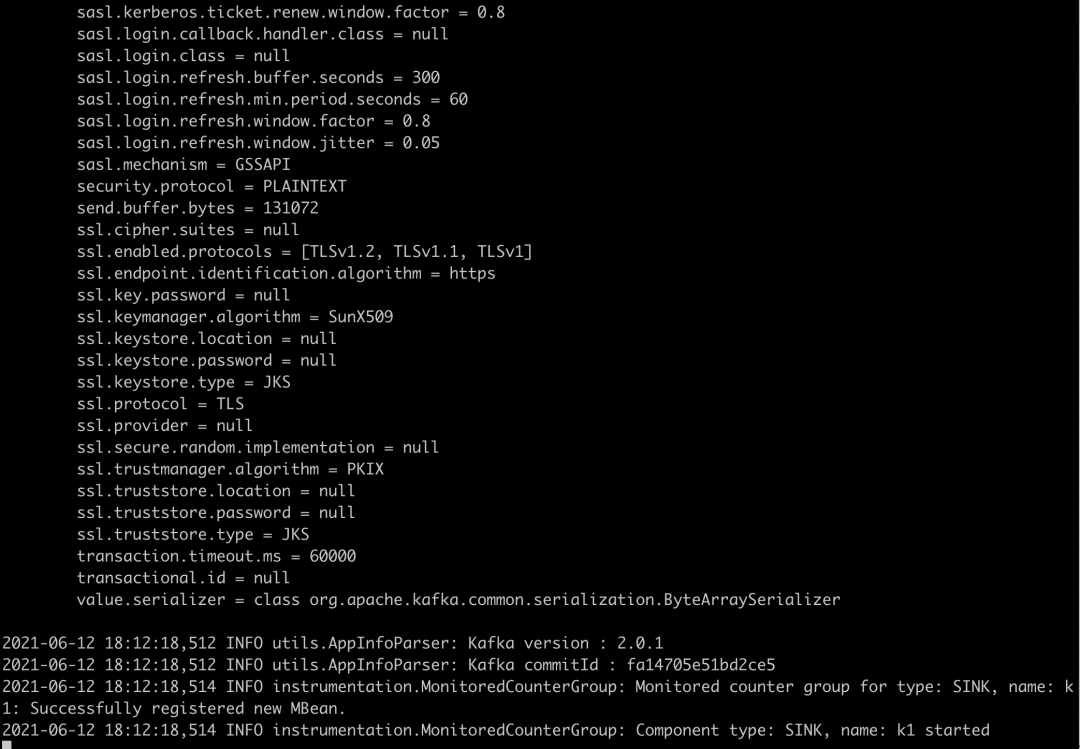
After execution, the following information is output:
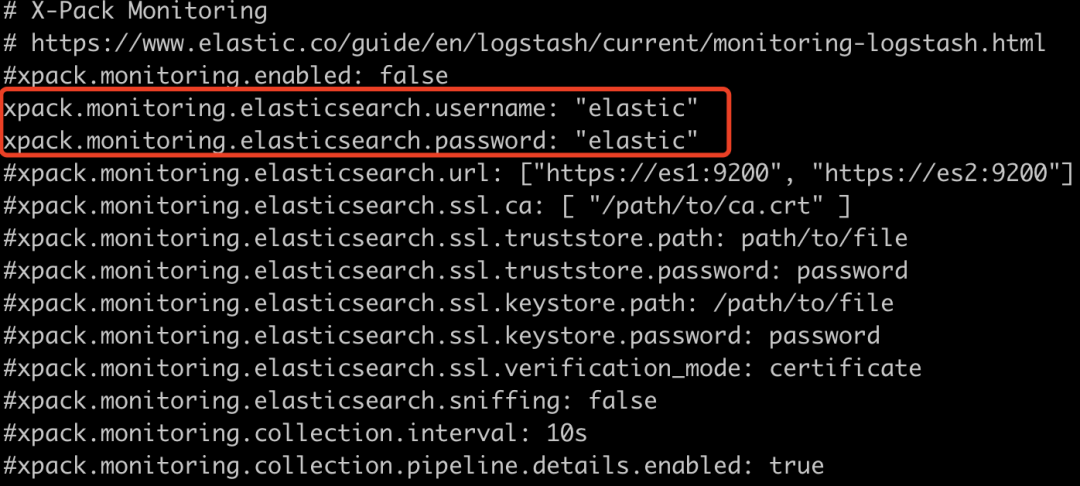
Next, use the method of shunting data to display the data. Specifically, it can be understood as storing the collected data in Kafka system, then using logstack to consume the data stored in Kafka, and storing the consumed data in ElasticSearch. Next, configure LogStash YML file to configure LogStash account and password, as follows:
Configure kafka_laGou.conf, specifically:

After the configuration is completed, use logstack in the console to consume the data with the theme of laGou in Kafka cluster, and execute it in the bin directory of logstack:
./logstash -f ../config/kafka_laGou.conf
After execution, the Agent of LogStash will normally start and consume the data in Kafka cluster, and then store the consumed data in ElasticSearch cluster. After execution, the following information will be output:
Sending Logstash's logs to /Applications/devOps/bigData/ELK/logstash/logs which is now configured via log4j2.properties
[2021-06-12T18:39:43,175][WARN ][logstash.config.source.multilocal] Ignoring the 'pipelines.yml' file because modules or command line options are specified
[2021-06-12T18:39:43,210][FATAL][logstash.runner ] Logstash could not be started because there is already another instance using the configured data directory. If you wish to run multiple instances, you must change the "path.data" setting.
[2021-06-12T18:39:43,221][ERROR][org.logstash.Logstash ] java.lang.IllegalStateException: Logstash stopped processing because of an error: (SystemExit) exit
localhost:bin liwangping$ clear
localhost:bin liwangping$ ./logstash -f ../config/kafka_laGou.conf
Sending Logstash's logs to /Applications/devOps/bigData/ELK/logstash/logs which is now configured via log4j2.properties
[2021-06-12T18:40:31,712][WARN ][logstash.config.source.multilocal] Ignoring the 'pipelines.yml' file because modules or command line options are specified
[2021-06-12T18:40:32,136][INFO ][logstash.runner ] Starting Logstash {"logstash.version"=>"6.3.2"}
[2021-06-12T18:40:33,674][INFO ][logstash.pipeline ] Starting pipeline {:pipeline_id=>"main", "pipeline.workers"=>8, "pipeline.batch.size"=>125, "pipeline.batch.delay"=>50}
[2021-06-12T18:40:34,092][INFO ][logstash.outputs.elasticsearch] Elasticsearch pool URLs updated {:changes=>{:removed=>[], :added=>[http://elastic:xxxxxx@localhost:9200/]}}
[2021-06-12T18:40:34,111][INFO ][logstash.outputs.elasticsearch] Running health check to see if an Elasticsearch connection is working {:healthcheck_url=>http://elastic:xxxxxx@localhost:9200/, :path=>"/"}
[2021-06-12T18:40:34,426][WARN ][logstash.outputs.elasticsearch] Restored connection to ES instance {:url=>"http://elastic:xxxxxx@localhost:9200/"}
[2021-06-12T18:40:34,505][INFO ][logstash.outputs.elasticsearch] ES Output version determined {:es_version=>6}
[2021-06-12T18:40:34,508][WARN ][logstash.outputs.elasticsearch] Detected a 6.x and above cluster: the `type` event field won't be used to determine the document _type {:es_version=>6}
[2021-06-12T18:40:34,528][INFO ][logstash.outputs.elasticsearch] New Elasticsearch output {:class=>"LogStash::Outputs::ElasticSearch", :hosts=>["//localhost:9200"]}
[2021-06-12T18:40:34,544][INFO ][logstash.outputs.elasticsearch] Using mapping template from {:path=>nil}
[2021-06-12T18:40:34,561][INFO ][logstash.outputs.elasticsearch] Attempting to install template {:manage_template=>{"template"=>"logstash-*", "version"=>60001, "settings"=>{"index.refresh_interval"=>"5s"}, "mappings"=>{"_default_"=>{"dynamic_templates"=>[{"message_field"=>{"path_match"=>"message", "match_mapping_type"=>"string", "mapping"=>{"type"=>"text", "norms"=>false}}}, {"string_fields"=>{"match"=>"*", "match_mapping_type"=>"string", "mapping"=>{"type"=>"text", "norms"=>false, "fields"=>{"keyword"=>{"type"=>"keyword", "ignore_above"=>256}}}}}], "properties"=>{"@timestamp"=>{"type"=>"date"}, "@version"=>{"type"=>"keyword"}, "geoip"=>{"dynamic"=>true, "properties"=>{"ip"=>{"type"=>"ip"}, "location"=>{"type"=>"geo_point"}, "latitude"=>{"type"=>"half_float"}, "longitude"=>{"type"=>"half_float"}}}}}}}}
[2021-06-12T18:40:34,584][INFO ][logstash.pipeline ] Pipeline started successfully {:pipeline_id=>"main", :thread=>"#<Thread:0x53f09319 run>"}
[2021-06-12T18:40:34,670][INFO ][logstash.outputs.elasticsearch] Installing elasticsearch template to _template/logstash
[2021-06-12T18:40:34,676][INFO ][logstash.agent ] Pipelines running {:count=>1, :running_pipelines=>[:main], :non_running_pipelines=>[]}
[2021-06-12T18:40:34,691][INFO ][org.apache.kafka.clients.consumer.ConsumerConfig] ConsumerConfig values:
auto.commit.interval.ms = 5000
auto.offset.reset = latest
bootstrap.servers = [localhost:9092]
check.crcs = true
client.id = logstash-0
connections.max.idle.ms = 540000
enable.auto.commit = true
exclude.internal.topics = true
fetch.max.bytes = 52428800
fetch.max.wait.ms = 500
fetch.min.bytes = 1
group.id = console-consumer-83756
heartbeat.interval.ms = 3000
interceptor.classes = []
internal.leave.group.on.close = true
isolation.level = read_uncommitted
key.deserializer = class org.apache.kafka.common.serialization.StringDeserializer
max.partition.fetch.bytes = 1048576
max.poll.interval.ms = 300000
max.poll.records = 500
metadata.max.age.ms = 300000
metric.reporters = []
metrics.num.samples = 2
metrics.recording.level = INFO
metrics.sample.window.ms = 30000
partition.assignment.strategy = [class org.apache.kafka.clients.consumer.RangeAssignor]
receive.buffer.bytes = 65536
reconnect.backoff.max.ms = 1000
reconnect.backoff.ms = 50
request.timeout.ms = 305000
retry.backoff.ms = 100
sasl.jaas.config = null
sasl.kerberos.kinit.cmd = /usr/bin/kinit
sasl.kerberos.min.time.before.relogin = 60000
sasl.kerberos.service.name = null
sasl.kerberos.ticket.renew.jitter = 0.05
sasl.kerberos.ticket.renew.window.factor = 0.8
sasl.mechanism = GSSAPI
security.protocol = PLAINTEXT
send.buffer.bytes = 131072
session.timeout.ms = 10000
ssl.cipher.suites = null
ssl.enabled.protocols = [TLSv1.2, TLSv1.1, TLSv1]
ssl.endpoint.identification.algorithm = null
ssl.key.password = null
ssl.keymanager.algorithm = SunX509
ssl.keystore.location = null
ssl.keystore.password = null
ssl.keystore.type = JKS
ssl.protocol = TLS
ssl.provider = null
ssl.secure.random.implementation = null
ssl.trustmanager.algorithm = PKIX
ssl.truststore.location = null
ssl.truststore.password = null
ssl.truststore.type = JKS
value.deserializer = class org.apache.kafka.common.serialization.StringDeserializer
[2021-06-12T18:40:34,797][INFO ][org.apache.kafka.common.utils.AppInfoParser] Kafka version : 1.1.0
[2021-06-12T18:40:34,798][INFO ][org.apache.kafka.common.utils.AppInfoParser] Kafka commitId : fdcf75ea326b8e07
[2021-06-12T18:40:35,011][INFO ][org.apache.kafka.clients.Metadata] Cluster ID: E0qvXyu_T_Wr_vZgZUV80w
[2021-06-12T18:40:35,024][INFO ][org.apache.kafka.clients.consumer.internals.AbstractCoordinator] [Consumer clientId=logstash-0, groupId=console-consumer-83756] Discovered group coordinator localhost:9092 (id: 2147483647 rack: null)
[2021-06-12T18:40:35,029][INFO ][org.apache.kafka.clients.consumer.internals.ConsumerCoordinator] [Consumer clientId=logstash-0, groupId=console-consumer-83756] Revoking previously assigned partitions []
[2021-06-12T18:40:35,029][INFO ][org.apache.kafka.clients.consumer.internals.AbstractCoordinator] [Consumer clientId=logstash-0, groupId=console-consumer-83756] (Re-)joining group
[2021-06-12T18:40:35,047][INFO ][logstash.agent ] Successfully started Logstash API endpoint {:port=>9600}
[2021-06-12T18:40:35,149][INFO ][org.apache.kafka.clients.consumer.internals.AbstractCoordinator] [Consumer clientId=logstash-0, groupId=console-consumer-83756] Successfully joined group with generation 1
[2021-06-12T18:40:35,151][INFO ][org.apache.kafka.clients.consumer.internals.ConsumerCoordinator] [Consumer clientId=logstash-0, groupId=console-consumer-83756] Setting newly assigned partitions [laGou-0, laGou-1, laGou-2, laGou-3, laGou-4, laGou-5]
[2021-06-12T18:40:35,168][INFO ][org.apache.kafka.clients.consumer.internals.Fetcher] [Consumer clientId=logstash-0, groupId=console-consumer-83756] Resetting offset for partition laGou-0 to offset 1.
[2021-06-12T18:40:35,169][INFO ][org.apache.kafka.clients.consumer.internals.Fetcher] [Consumer clientId=logstash-0, groupId=console-consumer-83756] Resetting offset for partition laGou-1 to offset 1.
[2021-06-12T18:40:35,169][INFO ][org.apache.kafka.clients.consumer.internals.Fetcher] [Consumer clientId=logstash-0, groupId=console-consumer-83756] Resetting offset for partition laGou-2 to offset 1.
[2021-06-12T18:40:35,169][INFO ][org.apache.kafka.clients.consumer.internals.Fetcher] [Consumer clientId=logstash-0, groupId=console-consumer-83756] Resetting offset for partition laGou-3 to offset 1.
[2021-06-12T18:40:35,169][INFO ][org.apache.kafka.clients.consumer.internals.Fetcher] [Consumer clientId=logstash-0, groupId=console-consumer-83756] Resetting offset for partition laGou-4 to offset 1.
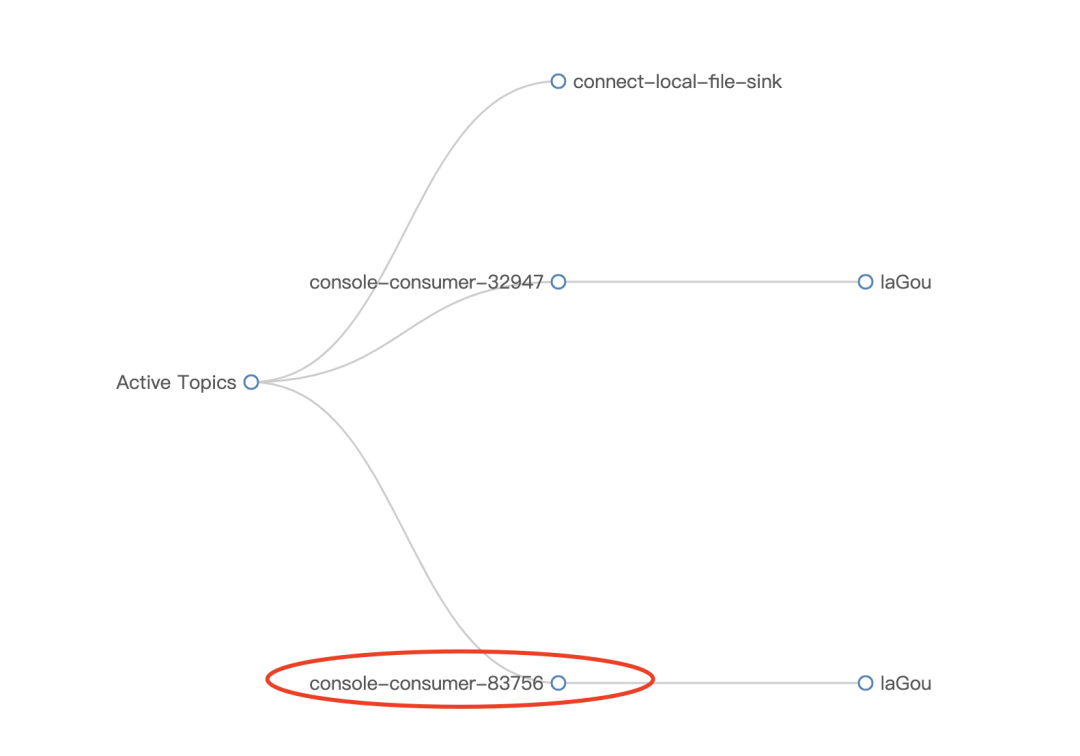
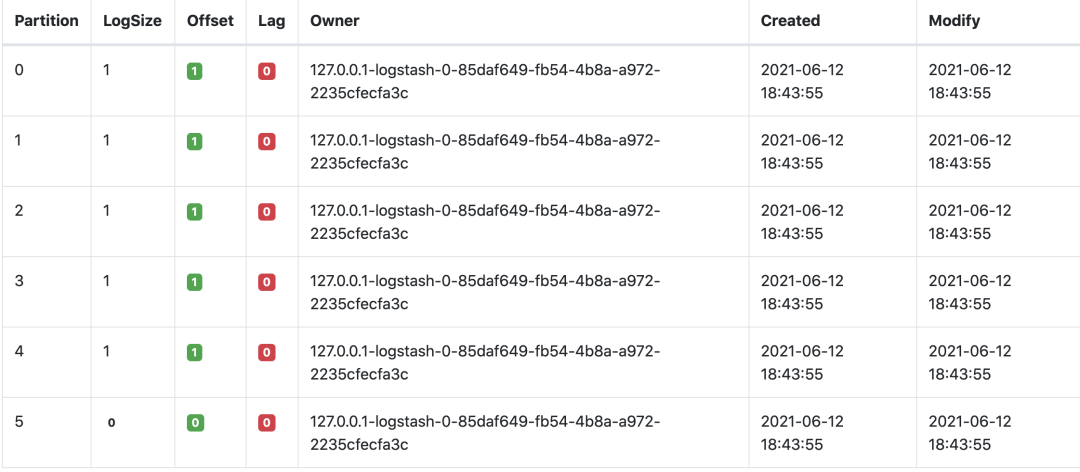
[2021-06-12T18:40:35,169][INFO ][org.apache.kafka.clients.consumer.internals.Fetcher] [Consumer clientId=logstash-0, groupId=console-consumer-83756] Resetting offset for partition laGou-5 to offset 0.At this time, the details of the subject laGou consumption can be seen in Kafka's monitoring system, as shown below:
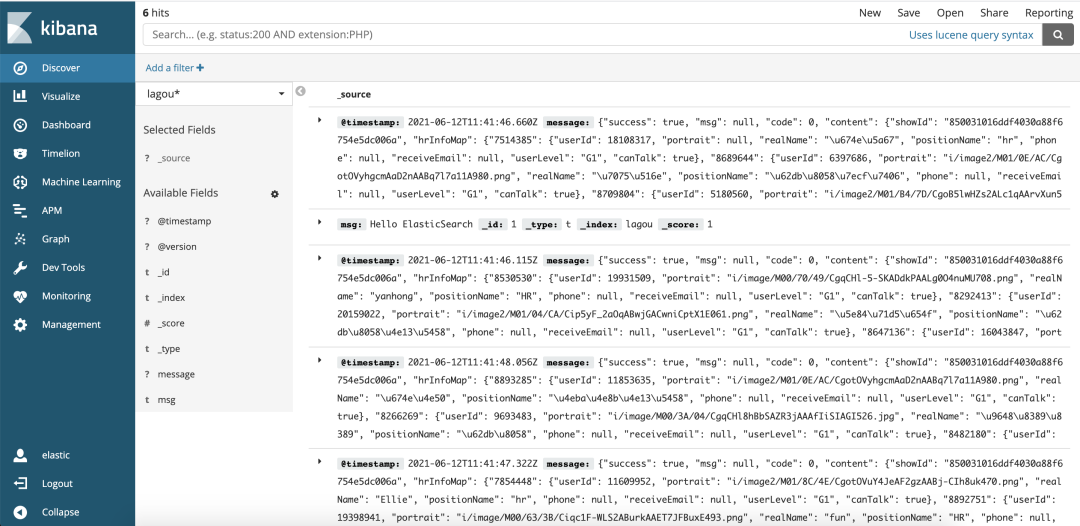
After the data is stored in the ElasticSearch cluster, you can query and analyze the data through Kibana. After creating the index in ManageMent, click the Discover module, and then the data of the test and development positions of dragnet consumed will be displayed, as shown below:
You can use different indexes to query, such as message, and the following information will be displayed:
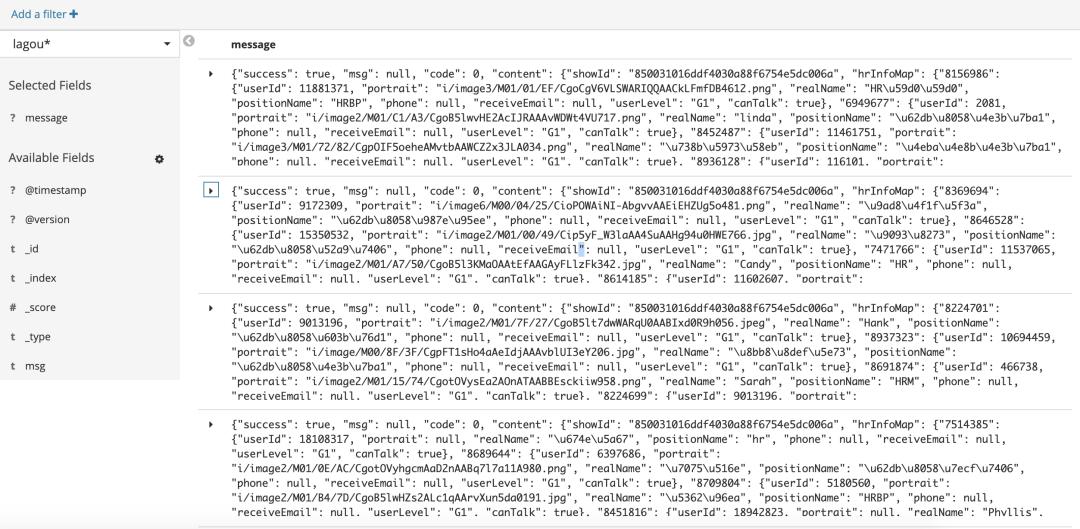
Of course, you can also click to view the complete data. Click the right arrow to display the specific data in table format and JSON format.