Collect nginx logs and indicator data using Beat
Project requirements
Nginx is a very excellent web server. Often, nginx service will be used as the access entrance of the project, so the performance guarantee of nginx becomes very important. If there is a problem in the operation of nginx, it will have a great impact on the project. Therefore, we need to take monitoring measures for the operation of nginx and master the operation of nginx in real time, Then you need to collect the running indicators of nginx and analyze the running logs of nginx.
operation flow
explain:
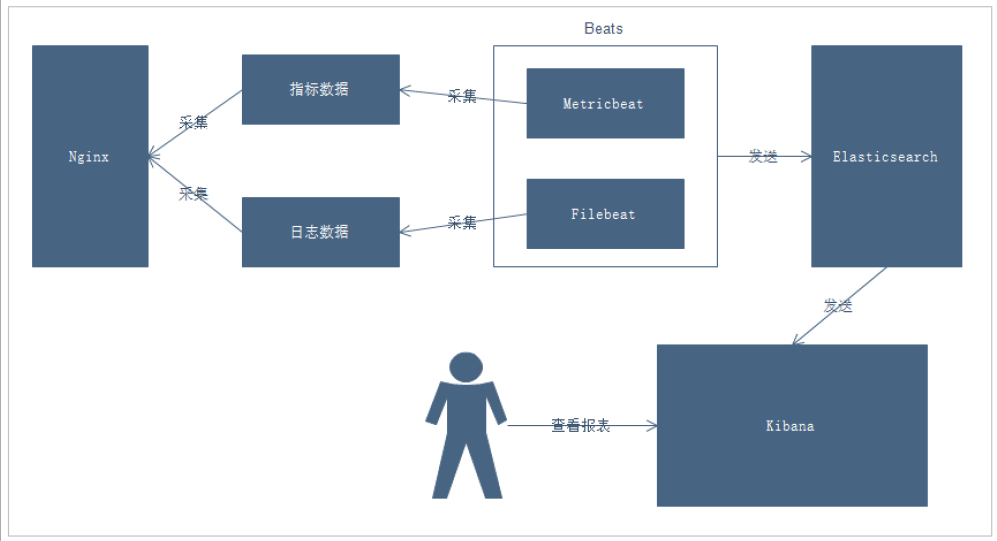
- Collect index data and log data of Nginx through Beats
- Beats collects data and sends it to Elasticsearch
- Kibana reads the data for analysis
- Users can view the analysis report through Kibana
Deploy Nginx
For deployment tutorial, please refer to this blog: How to install Nginx under CentOS?
After deployment, we can start nginx
After startup, we can get the content in nginx through the following command
tail -f /var/log/nginx/access.log
Introduction to Beats
By viewing ElasticStack, you can find that Beats is mainly used to collect data
Official website address: https://www.elastic.co/cn/beats/
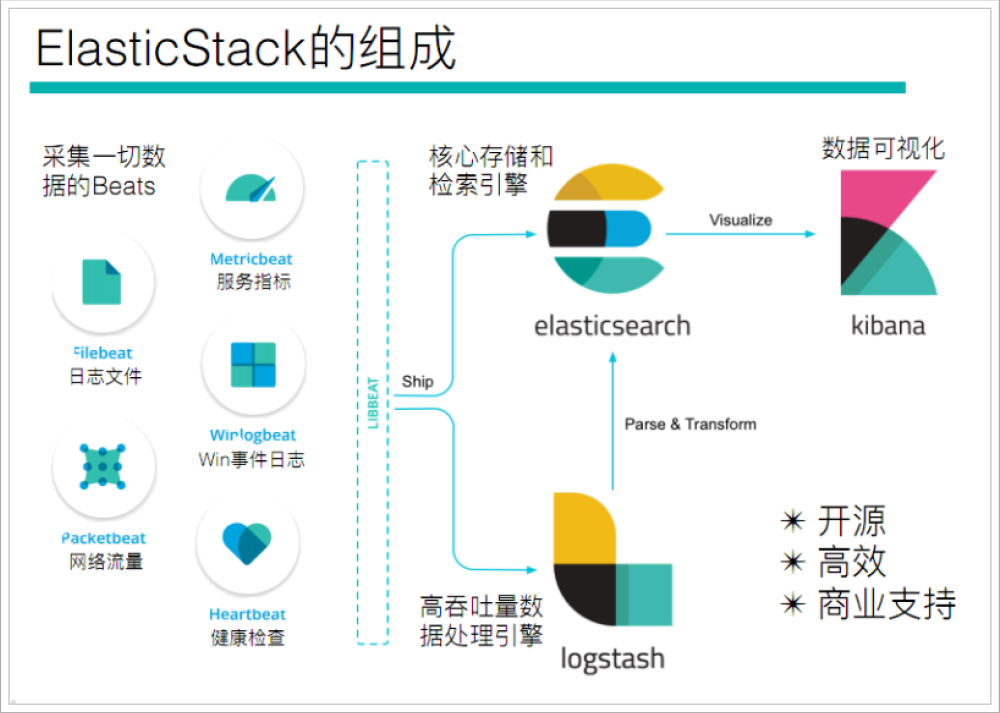
Beats platform is actually a lightweight data collector, which sends data from hundreds of machines to Logstash or ElasticSearch by collecting a variety of single-purpose collectors.

Beats includes the following data collection functions
- Filebeat: collect log files
- Metricbeat: Collection Index
- Packetbeat: collect network data

If our data does not need any processing, it can be sent directly to ElasticSearch
If your data needs some processing, you can send it to Logstash, and then send it to ElasticSearch after processing
Finally, a series of visual displays of our data are carried out through Kibana
Filebeat
introduce
Filebeat is a lightweight log collector
-
Why use Filebeat?
When you face hundreds or even thousands of servers, virtual machines and logs generated by dissolved gas, please say goodbye to SSH! Filebeat will provide you with a lightweight method for forwarding and summarizing logs and files, so that simple things are no longer busy. Remember the following two points about filebeat:
- Lightweight log collector
- It is sent to ElasticSearch or Logstash to realize visualization in Kibana
framework
Used to monitor and collect server log files
-
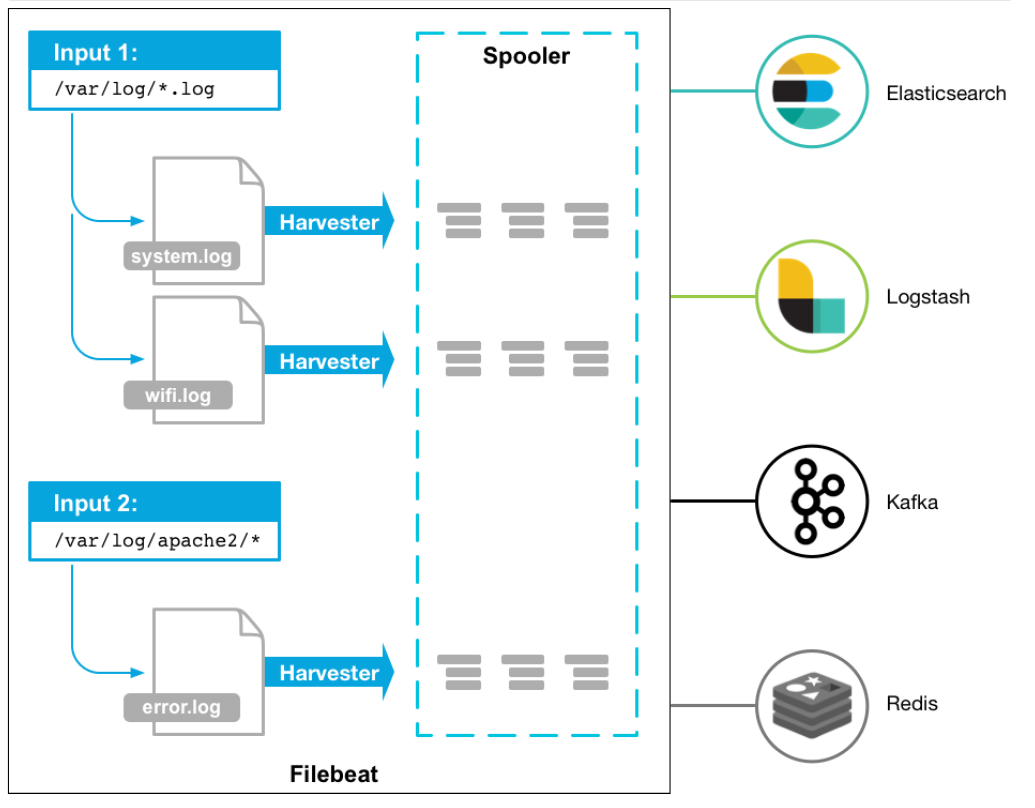
The process is as follows:
- The first is input. We can specify multiple data input sources, and then match the log files through wildcards
- After matching the log, the Harvester will be used to read the log continuously
- Then the logs harvested by the harvester are transferred to the Spooler, and then the spool is transferring them to the corresponding place
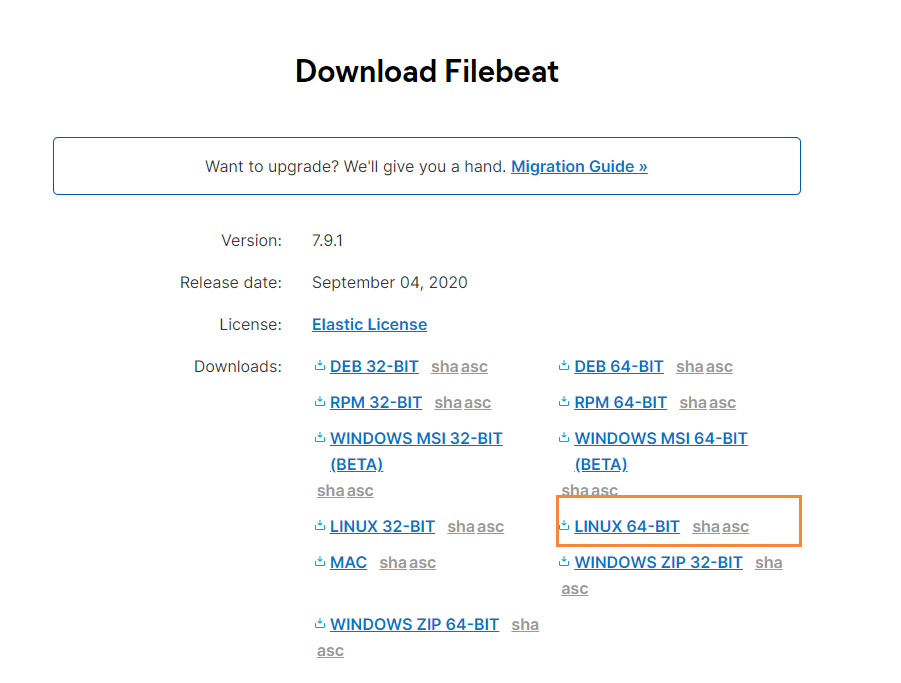
download
Official website address: https://www.elastic.co/cn/downloads/beats/filebeat
Select the corresponding version of Filebeat. I deployed Centos here, so download the Linux version
-
After downloading, we upload it to the server and create a folder
# create folder
mkdir -p /soft/beats
# Unzip file
tar -zxvf filebeat-7.9.1-linux-x86_64.tar.gz
# rename
mv filebeat-7.9.1-linux-x86_64/ filebeat
Then we go to the filebeat directory and create the corresponding configuration file
# Enter folder
cd filebeats
# create profile
vim mogublog.yml
Add the following
filebeat.inputs: # filebeat input
- type: stdin    # Standard input
  enabled: true  # Enable standard input
setup.template.settings:
  index.number_of_shards: 3 # Specify the number of downloads
output.console:  # console output
  pretty: true   # Enable beautification
  enable: true
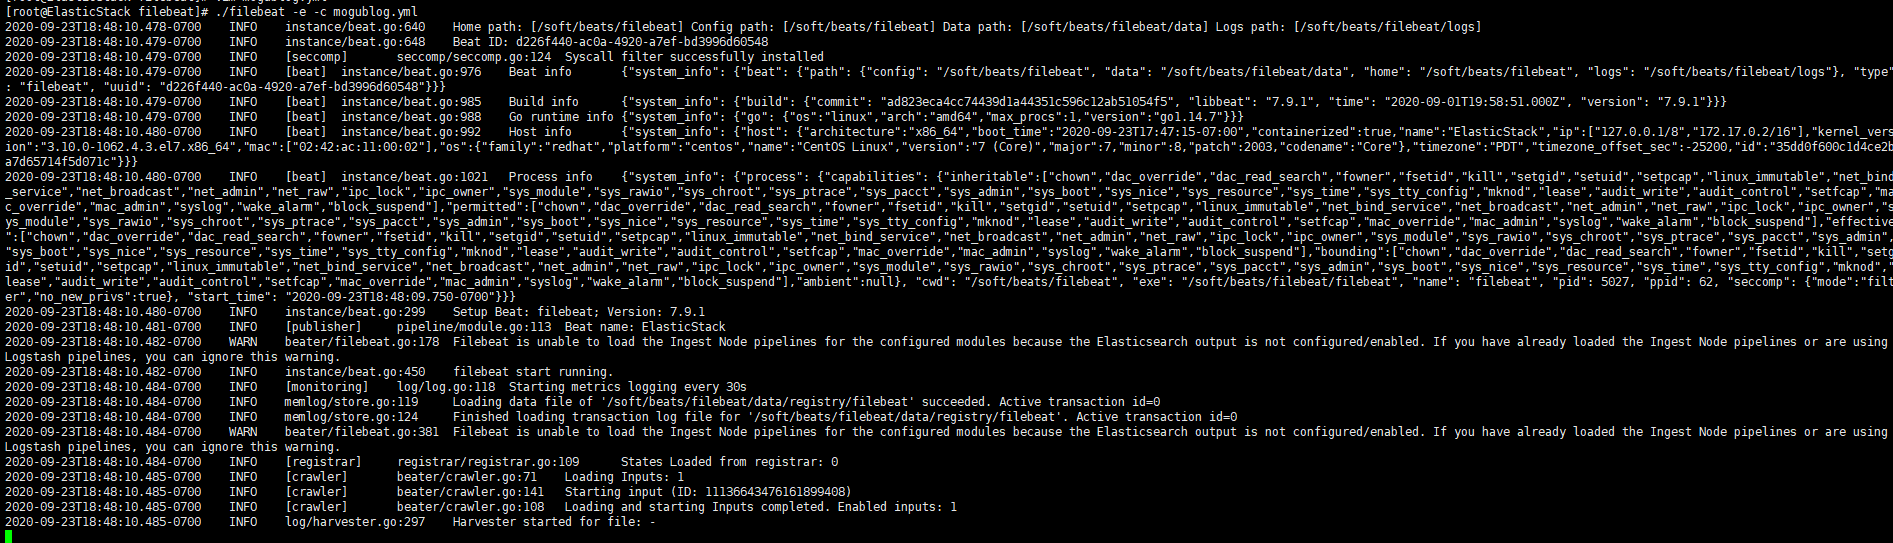
start-up
After we have added the configuration file, we can start filebeat
./filebeat -e -c mogublog.yml
Then we enter hello on the console, and we can see that we will have a json output, which is output after reading the content of our console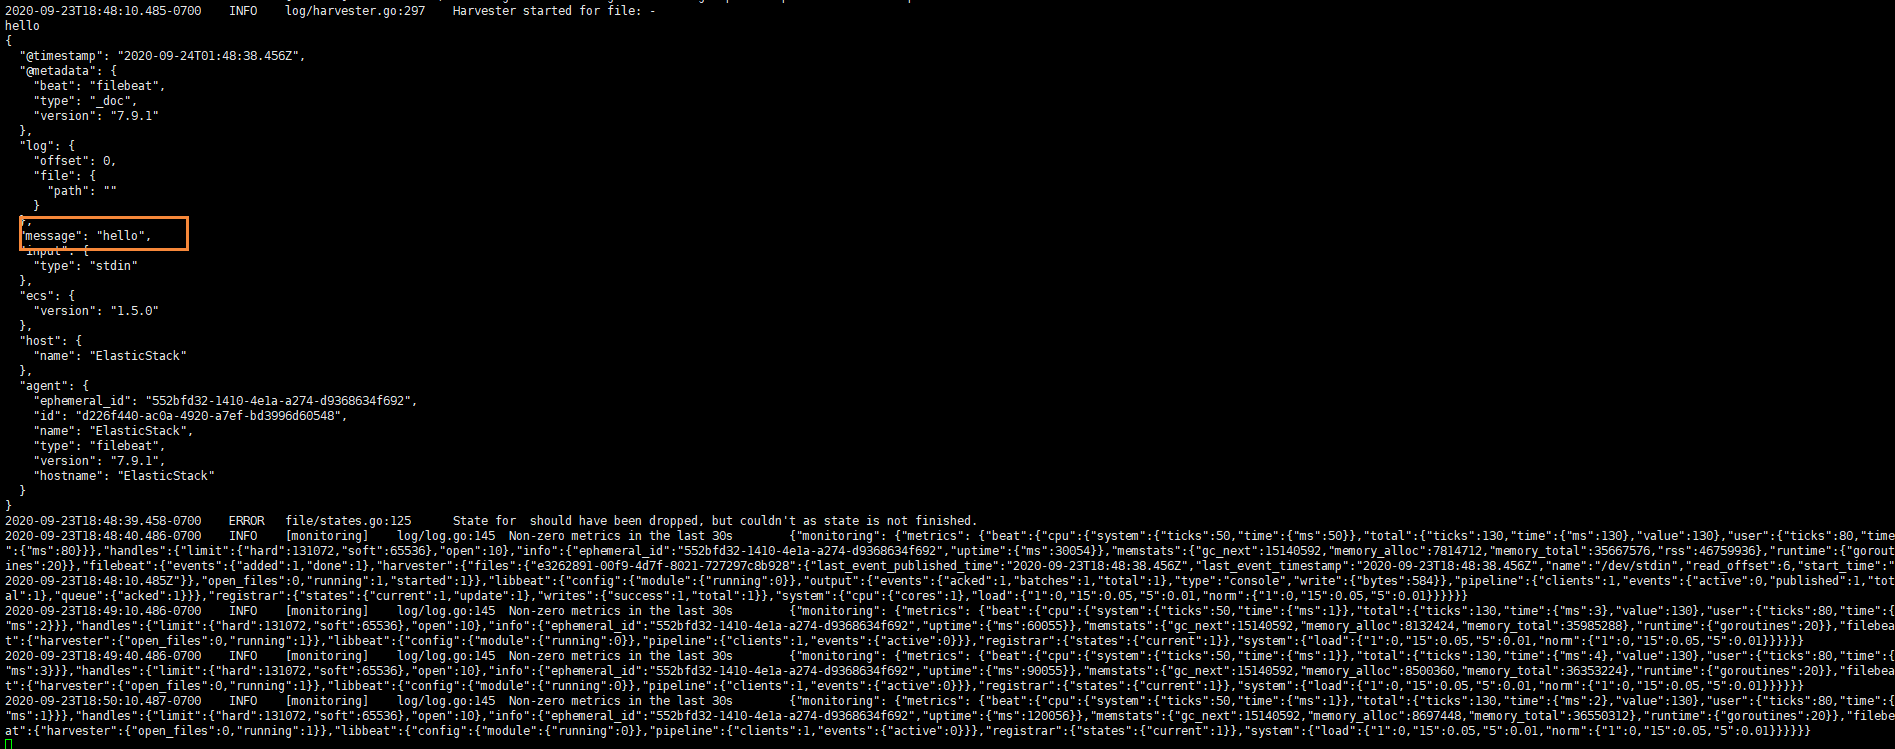
The contents are as follows
{
    "@timestamp":"2019-01-12T12:50:03.585Z",
    "@metadata":{ #Metadata information
        "beat":"filebeat",
        "type":"doc",
        "version":"6.5.4"
    },
    "source":"",
    "offset":0,
    "message":"hello", #Metadata information
    "prospector":{
        "type":"stdin" #Metadata information
    },
    "input":{ #console input
        "type":"stdin"
    },
    "beat":{  #beat version and host information
        "name":"itcast01",
        "hostname":"ElasticStack",
        "version":"6.5.4"
    },
    "host":{
        "name":"ElasticStack"
    }
}
read file
We need to create a file again, called mogublog log YML, and then add the following content to the file
filebeat.inputs:
- type: log
  enabled: true
  paths:
    - /soft/beats/logs/*.log
setup.template.settings:
  index.number_of_shards: 3
output.console:
  pretty: true
  enable: true
After adding, we create a log file in the following directory
# create folder
mkdir -p /soft/beats/logs

# Enter folder
cd /soft/beats/logs

# Additional content
echo "hello" >> a.log
Then we start filebeat again
./filebeat -e -c mogublog-log.yml
It can be found that it has been successfully loaded into our log file a.log

At the same time, we can continue to add content to the file
echo "are you ok ?" >> a.log
After adding, we check filebeat again, and we can also see the content we just added
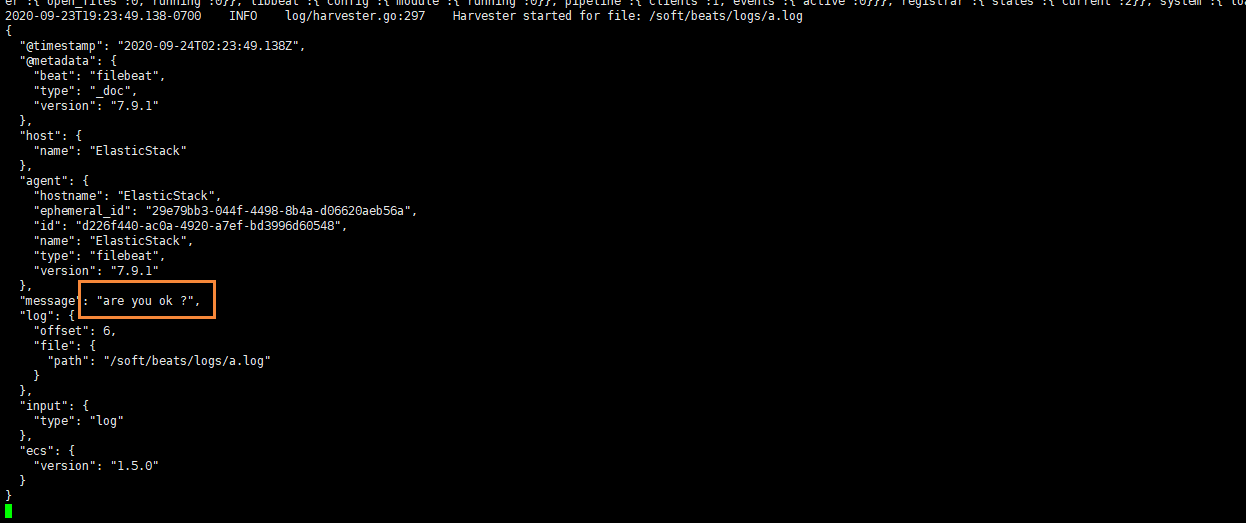
It can be seen that if the log file has been detected to be updated, the updated content will be read immediately and output to the console.
Custom field
However, when our metadata cannot support our business, we can also add some custom fields
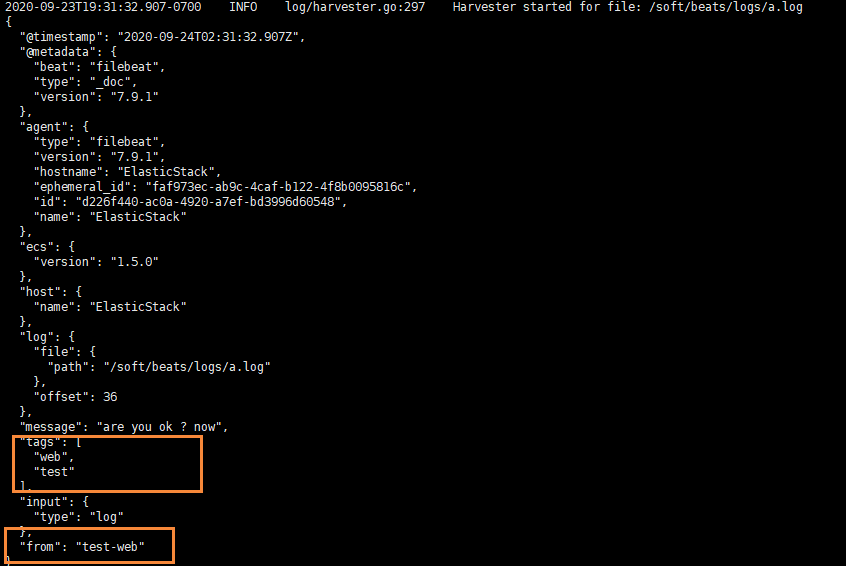
filebeat.inputs:
- type: log
  enabled: true
  paths:
    - /soft/beats/logs/*.log
  tags: ["web", "test"]  #Add a custom tag to facilitate subsequent processing
  fields:  #Add custom field
    from: test-web
  fields_under_root: true #true means to add to the root node and false means to add to the child node
setup.template.settings:
  index.number_of_shards: 3
output.console:
  pretty: true
  enable: true
After adding, we restart filebeat
./filebeat -e -c mogublog-log.yml
Then add new data to a.log
echo "test-web" >> a.log
We can see that two fields have been added to the original one
Output to ElasticSearch
We can modify it to the following through configuration
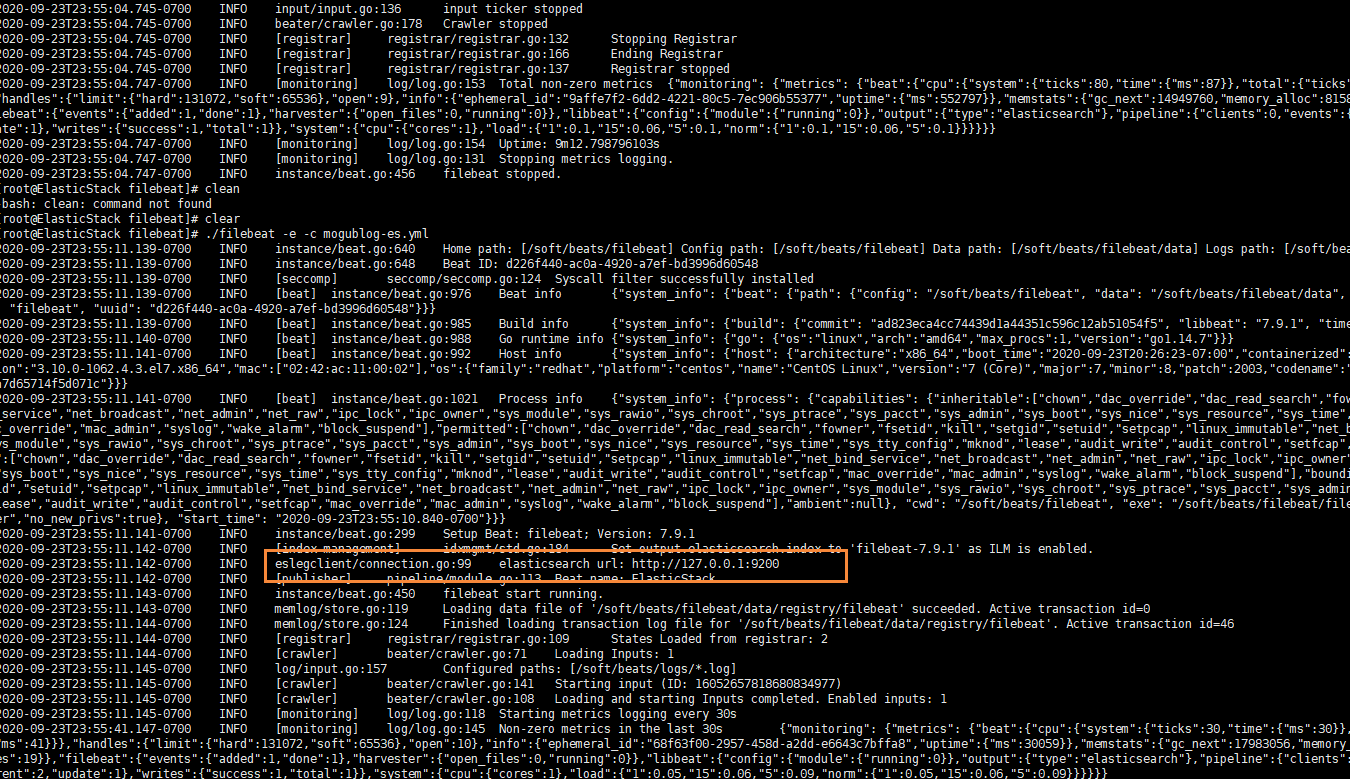
filebeat.inputs:
- type: log
  enabled: true
  paths:
    - /soft/beats/logs/*.log
  tags: ["web", "test"]
  fields:
    from: test-web
  fields_under_root: false
setup.template.settings:
  index.number_of_shards: 1
output.elasticsearch:
  hosts: ["127.0.0.1:9200"]
After successful startup, we can see that it has successfully connected to es
Then we go to the logs folder just now and add content to the a.log file
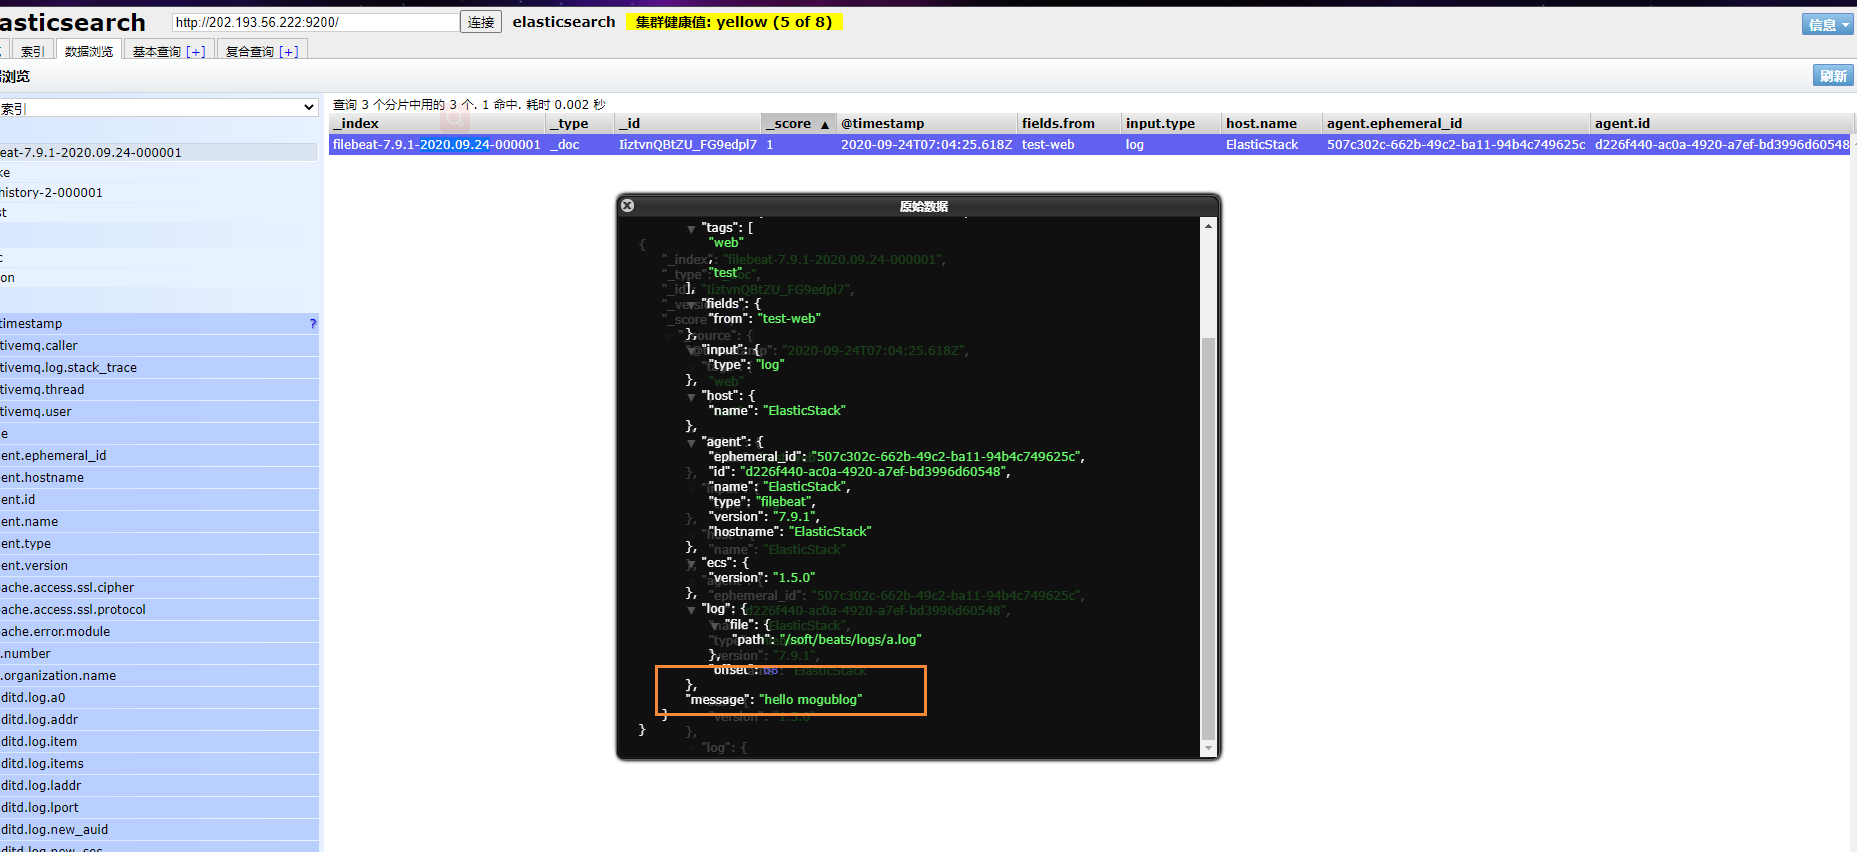
echo "hello mogublog" >> a.log
In ES, we can see that there is an additional index library of filebeat
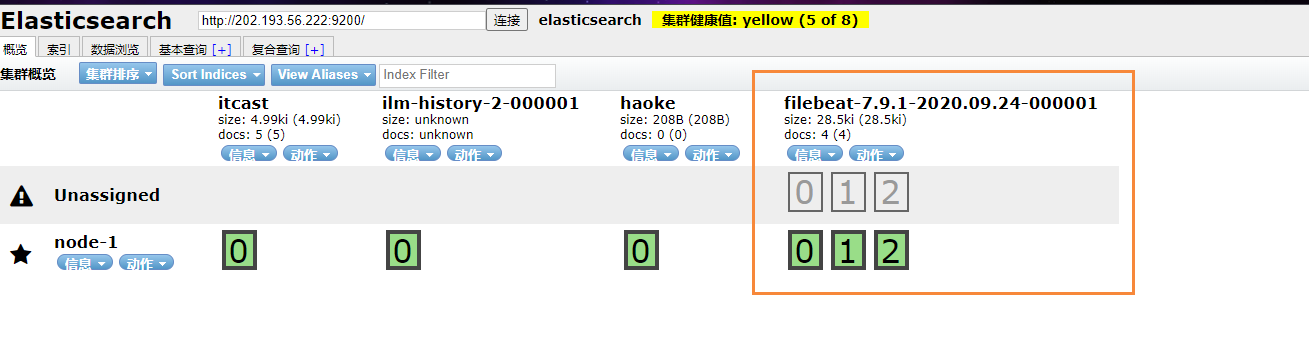
Then we browse the corresponding data to see if there is any inserted data content