Jellyfish is a lightweight, Java written, distributed microservice real-time monitoring system that can seamlessly connect Spring Boot or Spring Cloud projects
The monitoring function provided by Jellyfish is mainly divided into two parts:
- Unified collection and query of application logs
- Count and monitor three indicators of HTTP interface of SpringBoot application: request time-consuming, error rate and concurrency
Jellyfish deployment method
Jellyfish is divided into server and agent
The server is usually an independent SpringBoot application or cluster. The cluster mode is through another micro service distributed collaboration framework tridenter The Jellyfish server also needs to deploy Redis and ElasticSearch
The Agent side is usually another group of SpringBoot applications or clusters with jellyfish related jar packages. They send data packets to the server in real time.
Jellyfish features:
- The Jellyfish server is based on the streaming computing framework vortex (Netty4 at the bottom), with low latency and high concurrency, and supports two transmission protocols: TCP and HTTP
- The network communication layer of Jellyfish server relies on the vortex framework to support dynamic horizontal expansion and final data consistency
- Jellyfish's application interface statistics are quasi real-time and pure memory calculation. The default statistical time window is 1 minute (customizable), but the increase in the number of statistical interfaces may affect the real-time performance. After testing, the maximum delay is maintained within 1 minute and the average delay is seconds.
Jellyfish series has four sub projects:
- jellyfish-console
Jellyfish Web console can run independently, usually as a server. Of course, you can also customize the server by using the annotation @ enable jellyfishserver - jellyfish-http-spring-boot-starter
jar package, the Agent package for the Jellyfish monitoring application interface for indicator statistics - jellyfish-slf4j
jar package, Jellyfish docking slf4j (only logback docking is implemented at present), and unified application of log collection
agent package
4. Jellyfish spring boot starter jellyfish core jar package realizes all core functions
Install
<dependency>
      <artifactId>jellyfish-spring-boot-starter</artifactId>
     <groupId>com.github.paganini2008.atlantis</groupId>
     <version>1.0-RC2</version>
</dependency>
Jellyfish console instructions
How to connect slf4j and collect logs uniformly:
Your application needs:
- pom.xml add dependency
<dependency>
      <artifactId>jellyfish-slf4j</artifactId>
     <groupId>com.github.paganini2008.atlantis</groupId>
     <version>1.0-RC2</version>
</dependency>
- Modify logback xml
<?xml version="1.0" encoding="utf-8" ?>
<configuration>
<appender name="logTracker" class="indi.atlantis.framework.jellyfish.slf4j.logback.HttpTransportClientAppender">
<applicationName>tester5</applicationName> <!-- Change it to yours applicationName -->
<brokerUrl>http://192.168.159.1:10010</brokerUrl> <!--  Modify Jellyfish console address -- >
</appender>
<!-- omit other configuration -->
<root level="info">
<appender-ref ref="STDOUT" />
<appender-ref ref="INFO" />
<appender-ref ref="ERROR" />
<appender-ref ref="logTracker" />  <!-- Quote your definition appender -->
</root>
</configuration>
At present, only logback is supported, and more will be supported in the future
-
Start jellyfish console first
Start command: java -jar} jellyfish-console-1.0-rc1 jar
Default port: 6100 address: http://localhost:6100/jellyfish/log/
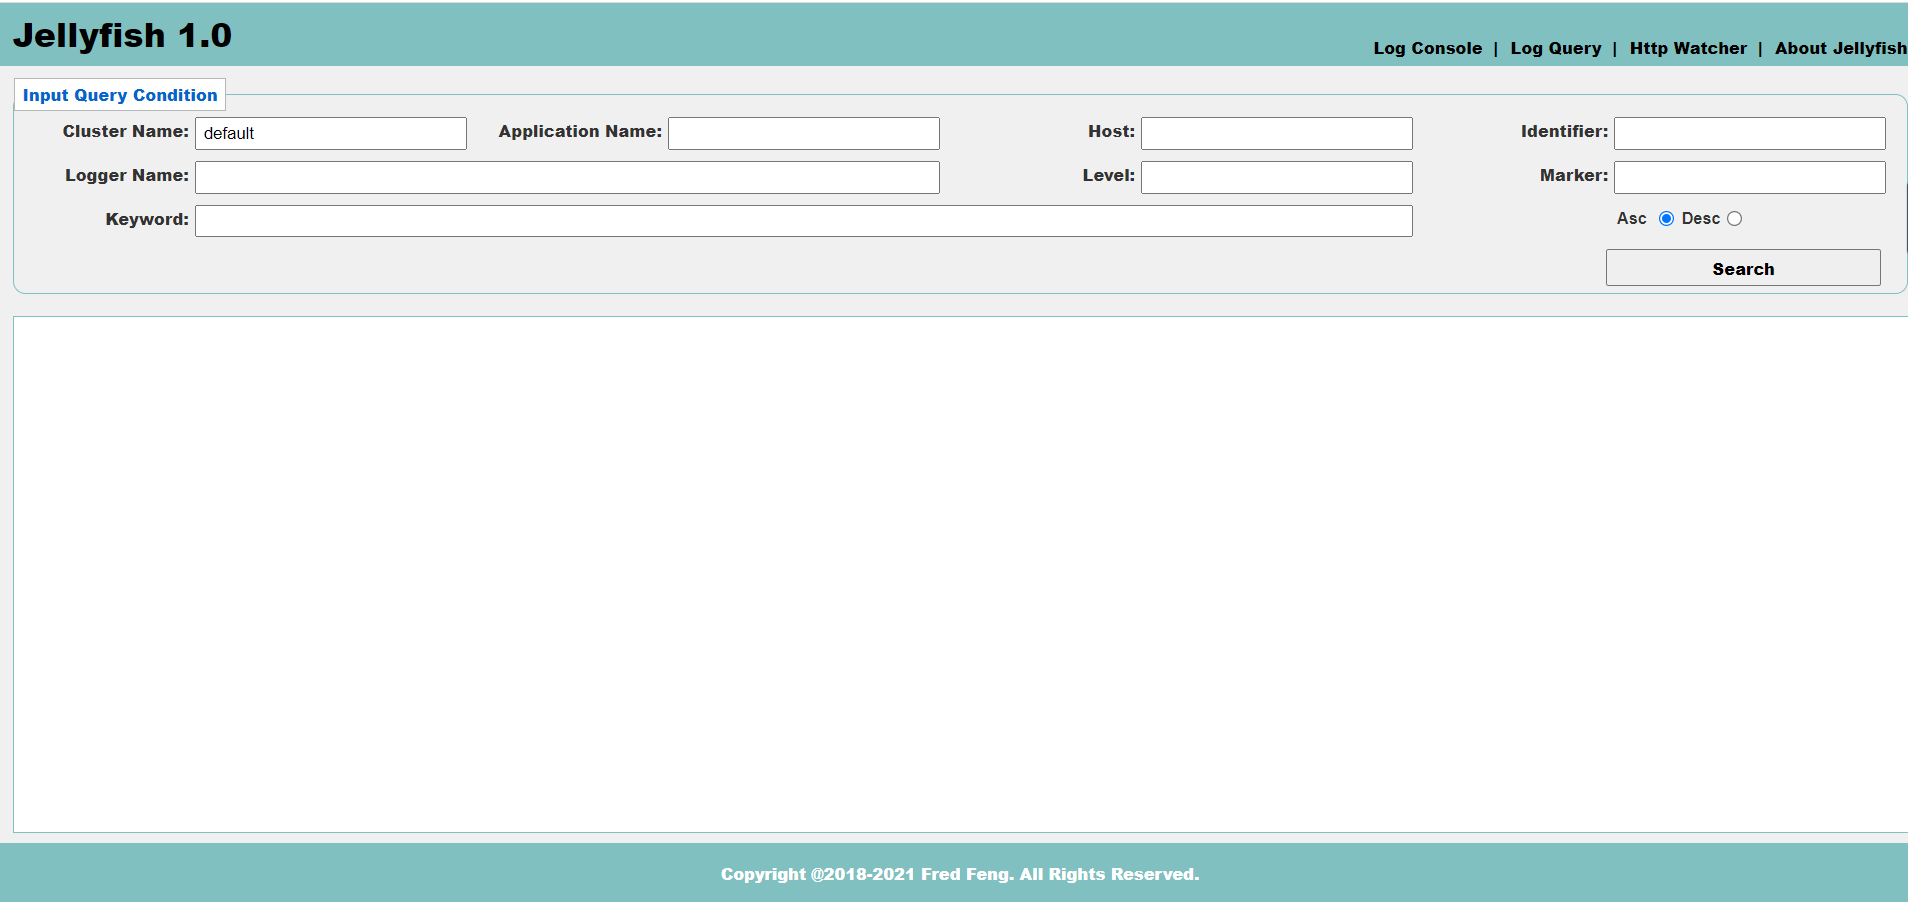
-
Start your application again, and the logs will flow into the Jellyfish Console:
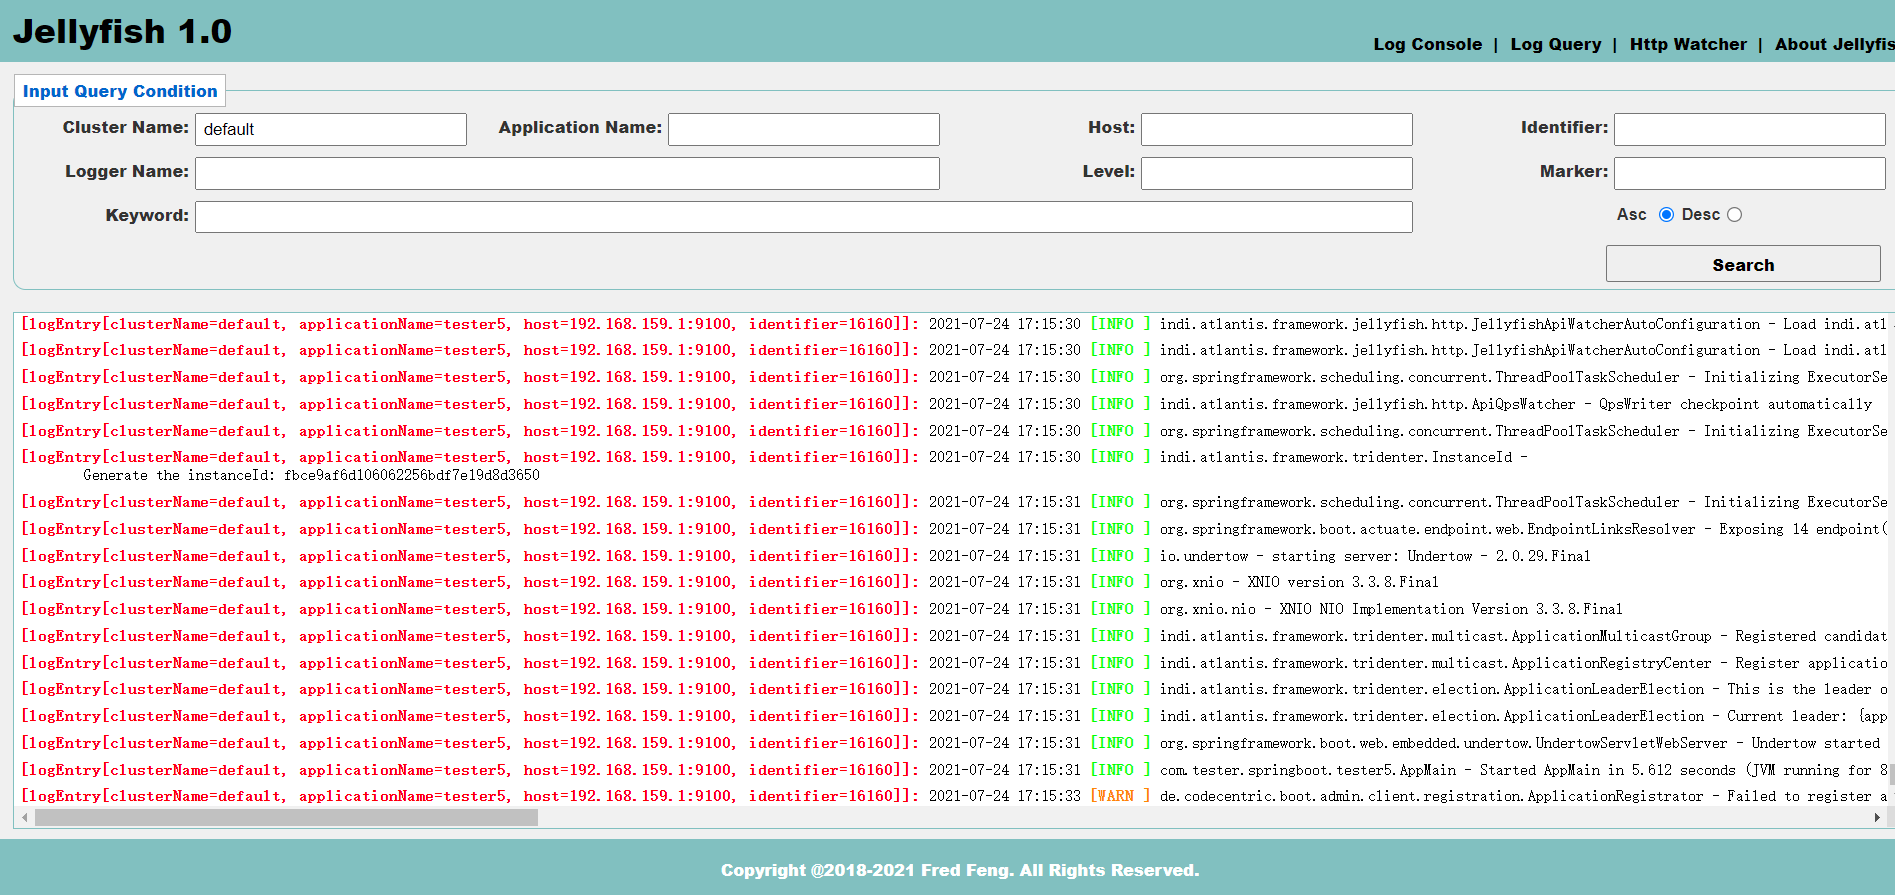
explain:
Each line of log data received by the jellyfish server from the agent side will be saved in es.
How to connect Spring Boot or Spring Cloud projects and count HTTP interface indicators?
Your app needs:
- Modify your POM XML, add:
<dependency>
<artifactId>jellyfish-http-spring-boot-starter</artifactId>
<groupId>com.github.paganini2008.atlantis</groupId>
<version>1.0-RC2</version>
</dependency>
- In application Properties add:
atlantis.framework.jellyfish.brokerUrl=http://localhost:6100 # Jellyfish console address
- Use the pressure measuring tool to test an interface, as shown in the figure:
Interface list:
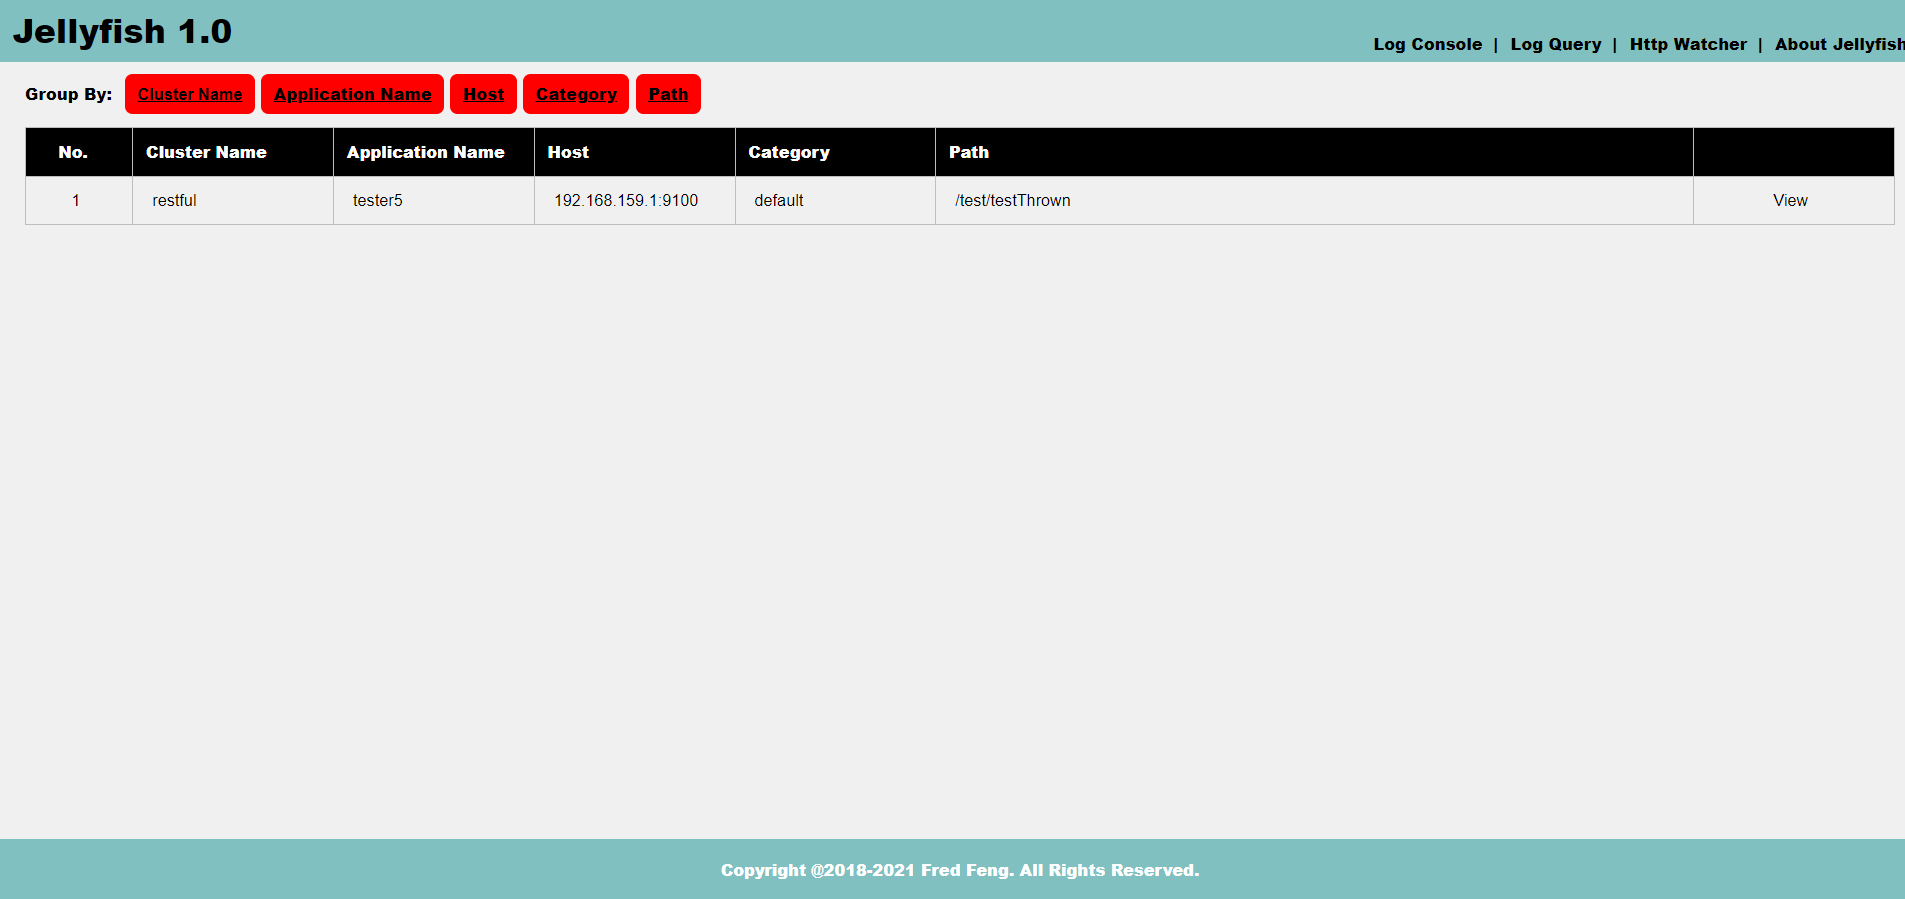
Click View to open the statistics details page, which is relatively long
First, at the top, you will see the interface overview and some statistics

Then you will see some Dashboards:

The dashboard in the figure above shows the current concurrency, QPS and average response time respectively, followed by two pie charts to monitor the http status code and interface execution results respectively
Then turn down and you will see several large pictures, which are counted by minute
Response time statistics and QPS statistics

Finally, the statistics of interface calls and Http status codes are displayed

Press F12 to view the returned json data:
{
"msg": "ok",
"data": {
"20:05:00": {
"rt": {
"middleValue": 0,
"count": 0,
"highestValue": 0,
"lowestValue": 0,
"timestamp": 1623585900737
}
},
"20:06:00": {
"rt": {
"middleValue": 0,
"count": 0,
"highestValue": 0,
"lowestValue": 0,
"timestamp": 1623585960737
}
},
"20:07:00": {
"rt": {
"middleValue": 0,
"count": 0,
"highestValue": 0,
"lowestValue": 0,
"timestamp": 1623586020737
}
},
"20:08:00": {
"rt": {
"middleValue": 0,
"count": 0,
"highestValue": 0,
"lowestValue": 0,
"timestamp": 1623586080737
}
},
"20:09:00": {
"rt": {
"middleValue": 0,
"count": 0,
"highestValue": 0,
"lowestValue": 0,
"timestamp": 1623586140737
}
},
"20:10:00": {
"rt": {
"middleValue": 0,
"count": 0,
"highestValue": 0,
"lowestValue": 0,
"timestamp": 1623586200737
}
},
"20:11:00": {
"rt": {
"middleValue": 0,
"count": 0,
"highestValue": 0,
"lowestValue": 0,
"timestamp": 1623586260737
}
},
"20:12:00": {
"rt": {
"middleValue": 0,
"count": 0,
"highestValue": 0,
"lowestValue": 0,
"timestamp": 1623586320737
}
},
"20:13:00": {
"rt": {
"middleValue": 0,
"count": 0,
"highestValue": 0,
"lowestValue": 0,
"timestamp": 1623586380737
}
},
"20:14:00": {
"rt": {
"middleValue": 0,
"count": 0,
"highestValue": 0,
"lowestValue": 0,
"timestamp": 1623586440737
}
},
"20:15:00": {
"rt": {
"middleValue": 0,
"count": 0,
"highestValue": 0,
"lowestValue": 0,
"timestamp": 1623586500737
}
},
"20:16:00": {
"rt": {
"middleValue": 0,
"count": 0,
"highestValue": 0,
"lowestValue": 0,
"timestamp": 1623586560737
}
},
"20:17:00": {
"rt": {
"middleValue": 0,
"count": 0,
"highestValue": 0,
"lowestValue": 0,
"timestamp": 1623586620737
}
},
"20:18:00": {
"rt": {
"middleValue": 0,
"count": 0,
"highestValue": 0,
"lowestValue": 0,
"timestamp": 1623586680737
}
},
"20:19:00": {
"rt": {
"middleValue": 0,
"count": 0,
"highestValue": 0,
"lowestValue": 0,
"timestamp": 1623586740737
}
},
"20:20:00": {
"rt": {
"middleValue": 0,
"count": 0,
"highestValue": 0,
"lowestValue": 0,
"timestamp": 1623586800737
}
},
"20:21:00": {
"rt": {
"middleValue": 0,
"count": 0,
"highestValue": 0,
"lowestValue": 0,
"timestamp": 1623586860737
}
},
"20:22:00": {
"rt": {
"middleValue": 0,
"count": 0,
"highestValue": 0,
"lowestValue": 0,
"timestamp": 1623586920737
}
},
"20:23:00": {
"rt": {
"middleValue": 0,
"count": 0,
"highestValue": 0,
"lowestValue": 0,
"timestamp": 1623586980737
}
},
"20:24:00": {
"rt": {
"middleValue": 0,
"count": 0,
"highestValue": 0,
"lowestValue": 0,
"timestamp": 1623587040737
}
},
"20:25:00": {
"rt": {
"middleValue": 0,
"count": 0,
"highestValue": 0,
"lowestValue": 0,
"timestamp": 1623587100737
}
},
"20:26:00": {
"rt": {
"middleValue": 0,
"count": 0,
"highestValue": 0,
"lowestValue": 0,
"timestamp": 1623587160737
}
},
"20:27:00": {
"rt": {
"middleValue": 0,
"count": 0,
"highestValue": 0,
"lowestValue": 0,
"timestamp": 1623587220737
}
},
"20:28:00": {
"rt": {
"middleValue": 0,
"count": 0,
"highestValue": 0,
"lowestValue": 0,
"timestamp": 1623587280737
}
},
"20:29:00": {
"rt": {
"middleValue": 0,
"count": 0,
"highestValue": 0,
"lowestValue": 0,
"timestamp": 1623587340737
}
},
"20:30:00": {
"rt": {
"middleValue": 0,
"count": 0,
"highestValue": 0,
"lowestValue": 0,
"timestamp": 1623587400737
}
},
"20:31:00": {
"rt": {
"middleValue": 0,
"count": 0,
"highestValue": 0,
"lowestValue": 0,
"timestamp": 1623587460737
}
},
"20:32:00": {
"rt": {
"middleValue": 0,
"count": 0,
"highestValue": 0,
"lowestValue": 0,
"timestamp": 1623587520737
}
},
"20:33:00": {
"rt": {
"middleValue": 0,
"count": 0,
"highestValue": 0,
"lowestValue": 0,
"timestamp": 1623587580737
}
},
"20:34:00": {
"rt": {
"middleValue": 0,
"count": 0,
"highestValue": 0,
"lowestValue": 0,
"timestamp": 1623587640737
}
},
"20:35:00": {
"rt": {
"middleValue": 0,
"count": 0,
"highestValue": 0,
"lowestValue": 0,
"timestamp": 1623587700737
}
},
"20:36:00": {
"rt": {
"middleValue": 0,
"count": 0,
"highestValue": 0,
"lowestValue": 0,
"timestamp": 1623587760737
}
},
"20:37:00": {
"rt": {
"middleValue": 0,
"count": 0,
"highestValue": 0,
"lowestValue": 0,
"timestamp": 1623587820737
}
},
"20:38:00": {
"rt": {
"middleValue": 0,
"count": 0,
"highestValue": 0,
"lowestValue": 0,
"timestamp": 1623587880737
}
},
"20:39:00": {
"rt": {
"middleValue": 0,
"count": 0,
"highestValue": 0,
"lowestValue": 0,
"timestamp": 1623587940737
}
},
"20:40:00": {
"rt": {
"middleValue": 0,
"count": 0,
"highestValue": 0,
"lowestValue": 0,
"timestamp": 1623588000737
}
},
"20:41:00": {
"rt": {
"middleValue": 0,
"count": 0,
"highestValue": 0,
"lowestValue": 0,
"timestamp": 1623588060737
}
},
"20:42:00": {
"rt": {
"middleValue": 0,
"count": 0,
"highestValue": 0,
"lowestValue": 0,
"timestamp": 1623588120737
}
},
"20:43:00": {
"rt": {
"middleValue": 0,
"count": 0,
"highestValue": 0,
"lowestValue": 0,
"timestamp": 1623588180737
}
},
"20:44:00": {
"rt": {
"middleValue": 0,
"count": 0,
"highestValue": 0,
"lowestValue": 0,
"timestamp": 1623588240737
}
},
"20:45:00": {
"rt": {
"middleValue": 0,
"count": 0,
"highestValue": 0,
"lowestValue": 0,
"timestamp": 1623588300737
}
},
"20:46:00": {
"rt": {
"middleValue": 0,
"count": 0,
"highestValue": 0,
"lowestValue": 0,
"timestamp": 1623588360737
}
},
"20:47:00": {
"rt": {
"middleValue": 0,
"count": 0,
"highestValue": 0,
"lowestValue": 0,
"timestamp": 1623588420737
}
},
"20:48:00": {
"rt": {
"middleValue": 0,
"count": 0,
"highestValue": 0,
"lowestValue": 0,
"timestamp": 1623588480737
}
},
"20:49:00": {
"rt": {
"middleValue": 0,
"count": 0,
"highestValue": 0,
"lowestValue": 0,
"timestamp": 1623588540737
}
},
"20:50:00": {
"rt": {
"middleValue": 0,
"count": 0,
"highestValue": 0,
"lowestValue": 0,
"timestamp": 1623588600737
}
},
"20:51:00": {
"rt": {
"middleValue": 0,
"count": 0,
"highestValue": 0,
"lowestValue": 0,
"timestamp": 1623588660737
}
},
"20:52:00": {
"rt": {
"middleValue": 2158,
"count": 68,
"highestValue": 4941,
"lowestValue": 1,
"timestamp": 1623588778333
}
},
"20:53:00": {
"rt": {
"middleValue": 2252,
"count": 1815,
"highestValue": 4996,
"lowestValue": 0,
"timestamp": 1623588839757
}
},
"20:54:00": {
"rt": {
"middleValue": 2233,
"count": 2680,
"highestValue": 5000,
"lowestValue": 0,
"timestamp": 1623588899641
}
},
"20:55:00": {
"rt": {
"middleValue": 2306,
"count": 2605,
"highestValue": 4994,
"lowestValue": 0,
"timestamp": 1623588959700
}
},
"20:56:00": {
"rt": {
"middleValue": 2224,
"count": 2669,
"highestValue": 5422,
"lowestValue": 0,
"timestamp": 1623589019949
}
},
"20:57:00": {
"rt": {
"middleValue": 2239,
"count": 2678,
"highestValue": 4997,
"lowestValue": 0,
"timestamp": 1623589079640
}
},
"20:58:00": {
"rt": {
"middleValue": 2233,
"count": 2678,
"highestValue": 4998,
"lowestValue": 0,
"timestamp": 1623589139980
}
},
"20:59:00": {
"rt": {
"middleValue": 2305,
"count": 2601,
"highestValue": 4998,
"lowestValue": 0,
"timestamp": 1623589199745
}
},
"21:00:00": {
"rt": {
"middleValue": 2227,
"count": 2678,
"highestValue": 5000,
"lowestValue": 0,
"timestamp": 1623589259579
}
},
"21:01:00": {
"rt": {
"middleValue": 2243,
"count": 2677,
"highestValue": 4998,
"lowestValue": 0,
"timestamp": 1623589319569
}
},
"21:02:00": {
"rt": {
"middleValue": 2255,
"count": 2656,
"highestValue": 5000,
"lowestValue": 0,
"timestamp": 1623589378556
}
},
"21:03:00": {
"rt": {
"middleValue": 2288,
"count": 2616,
"highestValue": 5000,
"lowestValue": 0,
"timestamp": 1623589439666
}
},
"21:04:00": {
"rt": {
"middleValue": 1272,
"count": 152,
"highestValue": 4271,
"lowestValue": 0,
"timestamp": 1623589441456
}
}
},
"success": true,
"statusCode": 200
}
The statistics part of the Jellyfish interface calls the sdk of the metric module of vortex, so it is based on time series. The default statistical time window is 1 minute. Scroll to save the first 60 data. The historical data does not fall by default, but can be extended by implementing the MetricEvictionHandler and MetricSequencerFactory interfaces. Refer to vortex metrics
Finally, the reference configuration of Jellyfish server:
server.port=6100

spring.application.name=jellyfish-console
spring.application.cluster.name=jellyfish-console-cluster

#management.endpoints.web.exposure.include=*
#management.endpoint.health.show-details=always
#management.security.enabled=false
#spring.boot.admin.client.url=http://localhost:10081

atlantis.framework.vortex.bufferzone.collectionName=jellyfish
atlantis.framework.vortex.bufferzone.pullSize=100

#Elasticsearch Configuration
spring.data.elasticsearch.cluster-name=es
spring.data.elasticsearch.cluster-nodes=localhost:9300
spring.data.elasticsearch.repositories.enabled=true
spring.data.elasticsearch.properties.transport.tcp.connect_timeout=60s

#Redis Configuration
spring.redis.host=localhost
spring.redis.port=6379
spring.redis.password=123456
spring.redis.dbIndex=0
For more detailed parameter settings, please refer to: https://github.com/paganini2008/jellyfish