Experimental principle
Python programs can run / execute in two different ways.
Method 1:
- Open IDLE3 through the desktop icon or start menu
- IDE loading may take some time
- After the IDE is loaded, a Python shell window is displayed
- In the Python shell window, type the following command
print("Hello World") - Press enter and you will see Hello World output below
Method 2: - Open IDLE3 through the desktop icon or start menu
- IDE loading may take some time
- After the IDE is loaded, a Python shell window is displayed
- In the Python shell window, click the menu item "file" and click "file" in the drop-down menu
New window option - Enter the following code in the new window that appears in 4
print("Hello World") - Save the file and name it HelloWorld py
- Open LXTerminal and enter the following command to execute the program in the file
python HelloWorld.py
II. Programming
The examples and codes given in the experiment are based on Python 2, but the version we use is Python 3, so the program will be changed
[program 1] input three integers x, y and Z. please output these three numbers from small to large.
1.1 program analysis: we try to put the smallest number on X and compare x with y first. If
x> Y, then exchange the values of X and y, and then compare x with z. if x > z, then compare x with z
To minimize x.
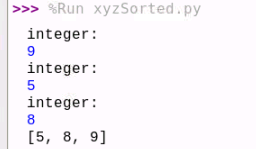
1.2 program code:
l = []
for i in range(3):
 x = int(raw_input('integer:\n'))
 l.append(x)
l.sort()
print l
Code after change:
#xzySorted.py
l = []
for i in range(3):
 x = int(input('integer:\n'))
 l.append(x)
l.sort()
print (l)
Operation results:
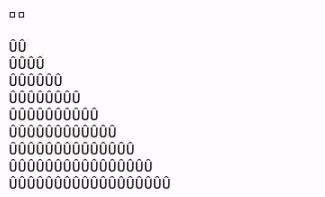
[procedure 2] print the stairs, and print two smiling faces above the stairs at the same time.
2.1 program analysis: use i to control the row and j to control the column, and j to control the output of black square according to the change of i
number.
2.2 program code:
import sys
sys.stdout.write(chr(1))
sys.stdout.write(chr(1))
print ''
for i in range(1,11):
 for j in range(1,i):
 sys.stdout.write(chr(219))
 sys.stdout.write(chr(219))
 print ''
Code after change:
#PrintStairs.py
import sys
sys.stdout.write(chr(1))
sys.stdout.write(chr(1))
print ('')
for i in range(1,11):
	for j in range(1,i):
		sys.stdout.write(chr(219))
		sys.stdout.write(chr(219))
 print ('')
Operation results:
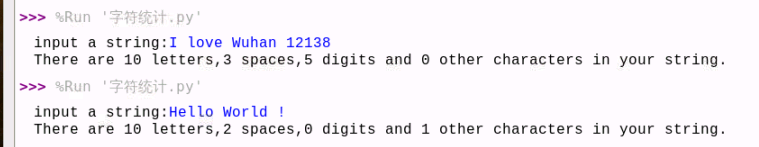
[program 3] input a line of characters and count the number of English letters, spaces, numbers and other characters.
import string
def main():
 s = raw_input('input a string:')
 letter = 0
 space = 0
 digit = 0
 other = 0
 for c in s:
 if c.isalpha():
 letter+=1
 elif c.isspace():
 space+=1
 elif c.isdigit():
 digit+=1
 else:
 other+=1
 print 'There are %d letters,%d spaces,%d digits and %d
other characters in your string.'%(letter,space,digit,other)
if __name__ == '__main__':
 main()
Result after change:
#Character statistics py
import string
def main():
    s = input('input a string:')
    letter = 0
    space = 0
    digit = 0
    other = 0
    for c in s:
        if c.isalpha():
            letter+=1
        elif c.isspace():
            space+=1
        elif c.isdigit():
            digit+=1
        else:
            other+=1
    print ('There are %d letters,%d spaces,%d digits and %d other characters in your string.'%(letter,space,digit,other))
if __name__ == '__main__':
    main()
Operation results:
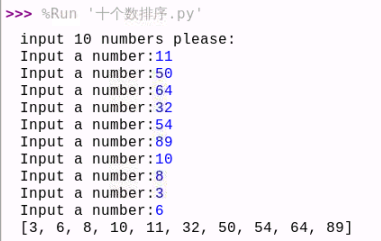
[procedure 4] sort 10 numbers.
print 'input 10 numbers please:'
 l = []
 for i in range(10):
 l.append(int(raw_input('Input a number:')))
#You can use the sort function directly: l.sort()
#You can also write your own sorting code (select sorting)
for i in range(9):
 for j in range(i+1,10):
 if l[j]<l[i]:
 temp = l[j]
 l[j] = l[i]
 l[i] = temp
print l
Code after change:
print('input 10 numbers please:')
l = []
for i in range(10):
    l.append(int(input('Input a number:')))
#You can use the sort function directly: l.sort()
#You can also write your own sorting code (select sorting)
for i in range(9):
    for j in range(i+1,10):
        if l[j]<l[i]:
            temp = l[j]
            l[j] = l[i]
            l[i] = temp
print(l)
Operation results:
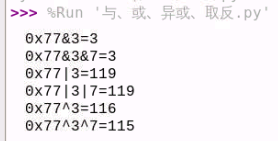
[procedure 5] 1) learn to use bitwise AND&
Program analysis: 0 & 0 = 0; 0&1=0; 1&0=0; 1&1=1
2) Learn to use bitwise or 𞓜.
Program analysis: 0|0 = 0; 0|1=1; 1|0=1; 1|1=1
3) Learn to use bitwise XOR ^.
Program analysis: 0 ^ 0 = 0; 0^1=1; 1^0=1; 1^1=0
4) Learn to use bitwise negation ~.
Program analysis: ~ 0 = 1~ 1=0
a = 077 #Octal
b = a&3
print '077&3=%d'%b
b &= 7
print '077&3&7=%d'%b
a = 077
b = a | 3
print '077|3=%d' % b
b |= 7
print '077|3|7=%d' % b
a = 077
b = a ^ 3
print '077^3=%d' % b
b ^= 7
print '077^3^7=%d' % b
Operation results:
[procedure 6] use matplotlib to draw
Install and configure matplotlib environment, debug and pass the following procedures.
sudo apt-get install python3-matplotlib
import matplotlib.pyplot as plt
import numpy as np
values = [0.09,-0.05,0.20,-0.02,0.08,0.09,0.03,0.027]
x = np.linspace(0,2*np.pi,9)[:-1]
c = np.random.random(size=(8,3))
fig = plt.figure()
plt.axes(polar=True)
#Get the current axes
print(plt.gca())
#mapping
plt.bar(x,values,width=0.5,color=c,align='center')
plt.scatter(x,values,marker='o',c='black')
#Add text
plt.figtext(0.03,0.7,s='Land area growth index',fontproperties='KaiTi',fontsize=22,rotation='vertical',verticalalignment='center',horizontalalignment='center')
plt.ylim(-0.05, 0.25)
labels = np.array(['Province 1','Province 2','Province 3','Province 4','Province 5','Province 6','Province 7','Study area'])
dataLength = 8
angles = np.linspace(0, 2*np.pi, dataLength, endpoint=False)
plt.thetagrids(angles * 180/np.pi,labels,fontproperties='KaiTi',fontsize=18)
#Add comments
# plt.annotate(s = 'province', xy=(0,0.09),xytext=(0,0.28),fontproperties='KaiTi',fontsize=18)
# plt.annotate(s = 'province', xy=(0,-0.05),xytext=(np.pi/4,0.28),fontproperties='KaiTi',fontsize=18)
# plt.annotate(s = 'province', xy=(0,0.20),xytext=(np.pi/2,0.28),fontproperties='KaiTi',fontsize=18)
# plt.annotate(s = 'province', xy=(0,-0.02),xytext=(3*np.pi/4,0.33),fontproperties='KaiTi',fontsize=18)
# plt.annotate(s = 'province', xy=(0,0.08),xytext=(np.pi,0.38),fontproperties='KaiTi',fontsize=18)
# plt.annotate(s = 'province', xy=(0,0.09),xytext=(np.pi*5/4,0.35),fontproperties='KaiTi',fontsize=18)
# plt.annotate(s = 'Qianjiang province', xy=(0,0.03),xytext=(np.pi*3/2,0.30),fontproperties='KaiTi',fontsize=18)
# plt.annotate(s = 'study area', xy=(0,0.027),xytext=(np.pi*7/4,0.28),fontproperties='KaiTi',fontsize=18)
#Style gridlines
plt.grid(c='gray',linestyle='--',)
# y1 = [-0.05,0.0,0.05,0.10,0.15,0.20,0.25]
# lai=fig.add_axes([0.12,0.01,0.8,0.98])
# lai.patch.set_alpha(0.25)
# lai.set_ylim(-0.05, 0.25)
#display
plt.show()
Code after change:
import matplotlib.pyplot as plt
import numpy as np
values = [0.09,-0.05,0.20,-0.02,0.08,0.09,0.03,0.027]
x = np.linspace(0,2*np.pi,9)[:-1]
c = np.random.random(size=(8,3))
fig = plt.figure()
plt.axes(polar=True)
#Get the current axes
print(plt.gca())
#mapping
plt.bar(x,values,width=0.5,color=c,align='center')
plt.scatter(x,values,marker='o',c='black')
#Add text
plt.figtext(0.03,0.7,s='Land area growth index',fontproperties='KaiTi',fontsize=22,rotation='vertical',verticalalignment='center',horizontalalignment='center')
plt.ylim(-0.05, 0.25)
labels = np.array(['Province 1','Province 2','Province 3','Province 4','Province 5','Province 6','Province 7','Study area'])
dataLength = 8
angles = np.linspace(0, 2*np.pi, dataLength, endpoint=False)
plt.thetagrids(angles * 180/np.pi,labels,fontproperties='KaiTi',fontsize=18)
#Add comments
# plt.annotate(s = 'province', xy=(0,0.09),xytext=(0,0.28),fontproperties='KaiTi',fontsize=18)
# plt.annotate(s = 'province', xy=(0,-0.05),xytext=(np.pi/4,0.28),fontproperties='KaiTi',fontsize=18)
# plt.annotate(s = 'province', xy=(0,0.20),xytext=(np.pi/2,0.28),fontproperties='KaiTi',fontsize=18)
# plt.annotate(s = 'province', xy=(0,-0.02),xytext=(3*np.pi/4,0.33),fontproperties='KaiTi',fontsize=18)
# plt.annotate(s = 'province', xy=(0,0.08),xytext=(np.pi,0.38),fontproperties='KaiTi',fontsize=18)
# plt.annotate(s = 'province', xy=(0,0.09),xytext=(np.pi*5/4,0.35),fontproperties='KaiTi',fontsize=18)
# plt.annotate(s = 'Qianjiang province', xy=(0,0.03),xytext=(np.pi*3/2,0.30),fontproperties='KaiTi',fontsize=18)
# plt.annotate(s = 'study area', xy=(0,0.027),xytext=(np.pi*7/4,0.28),fontproperties='KaiTi',fontsize=18)
#Style gridlines
plt.grid(c='gray',linestyle='--',)
# y1 = [-0.05,0.0,0.05,0.10,0.15,0.20,0.25]
# lai=fig.add_axes([0.12,0.01,0.8,0.98])
# lai.patch.set_alpha(0.25)
# lai.set_ylim(-0.05, 0.25)
#display
plt.show()
Operation results:
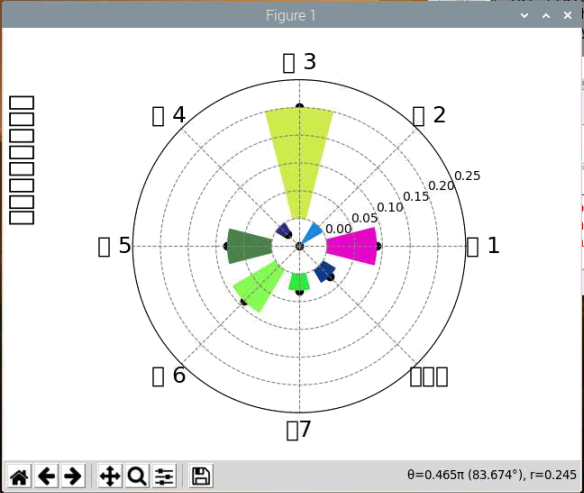
It can be seen that the font in the figure cannot be displayed normally, and there are also errors:
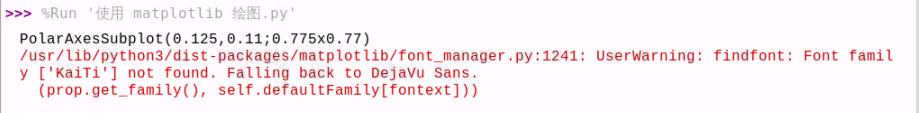
It didn't solve the problem in the end... Many online methods don't work. I hope some big guys can help me solve it.