
Reader: What is symbolization? How do I symbolize locally? Why symbolize online?
Full text 14328 words, estimated reading time 28 minutes.
1. What is symbolization?
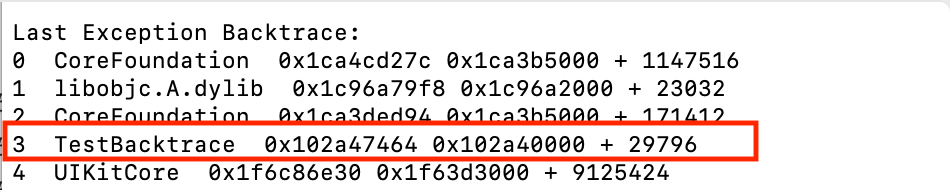
In daily development, applications will inevitably crash. Usually, the crash logs that we export directly from users are unsigned or partially symbolized, a collection of hexadecimal memory addresses that are poorly readable. Unsymbolized or partially symbolized crash logs are hardly helpful in solving the flip-back problem, as shown below:
Last Exception Backtrace:
0  CoreFoundation  0x1ca4cd27c 0x1ca3b5000 + 1147516
1  libobjc.A.dylib  0x1c96a79f8 0x1c96a2000 + 23032
2  CoreFoundation  0x1ca3ded94 0x1ca3b5000 + 171412
3  TestBacktrace  0x102a47464 0x102a40000 + 29796
4  UIKitCore  0x1f6c86e30 0x1f63d3000 + 9125424
Only symbolized crash logs can show function calls from individual threads, not just meaningless virtual memory addresses. The symbolized crash log is shown below, so that we know directly from the stack information that the function when the application TestBacktrace crashes is [AppDelegate Application:didFinishLaunchingWithOptions:], the file where the function crashes is AppDelegate.m, and the line number is 23:
Last Exception Backtrace:
0   CoreFoundation                  0x1ca4cd27c __exceptionPreprocess + 228
1   libobjc.A.dylib                 0x1c96a79f8 objc_exception_throw + 55
2   CoreFoundation                  0x1ca3ded94 -[__NSSingleObjectArrayI objectAtIndex:] + 127
3   TestBacktrace                   0x102a47464 -[AppDelegate Application:didFinishLaunchingWithOptions:] + 29796 (AppDelegate.m:23)
4   UIKitCore                       0x1f6c86e30 -[UIApplication _handleDelegateCallbacksWithOptions:isSuspended:restoreState:] + 411
2. Principles of Symbolization
2.1 What is a dSYM file?
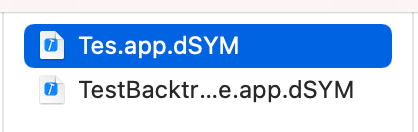
In iOS platform, dSYM file refers to the target file with debug information. The file name is usually xxx.app.dSYM, where XXX usually represents the binary package name of the application, as shown in the following figure:
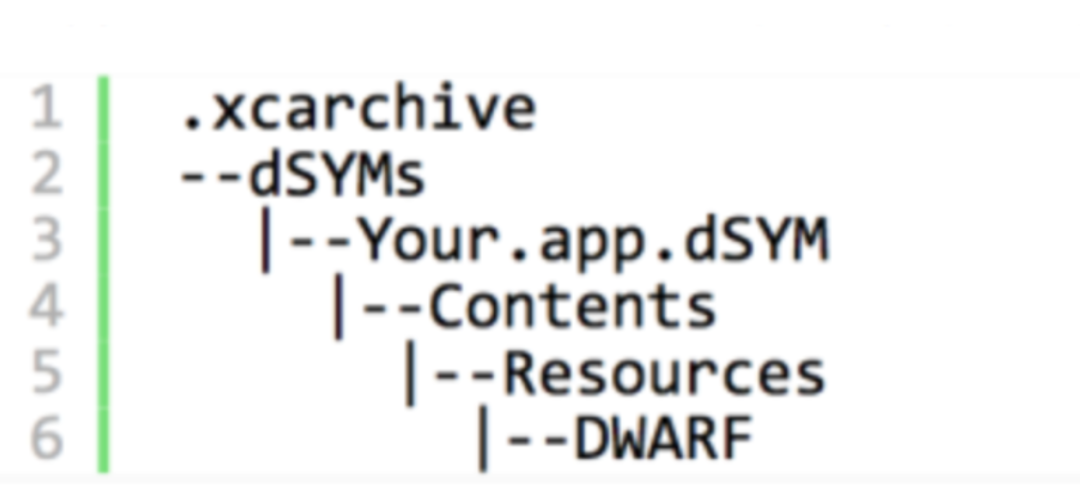
Usually we can see dSYM files and directory schema in the Xcode packaged file xcarchive:
dSYM stores file name, method name, line number and other information, which corresponds to the hexadecimal function address of the executable file. By analyzing the crashed file, we can know exactly the crashed information.
DWARF (Debugging With Arbitrary) Record Format is the standard format for storing and processing debugging information in file formats such as ELF and Mach-O. The data in DWARF is highly compressed and can be extracted with commands such as dwarfdump, otool, and so on. For example, extract critical debug information debug_info, debug_line, you can use commands
dwarfdump --debug-line /Users/xxxx/Desktop/resource/TestBacktrace.app.dSYM > debug_line.txt
Export debug_line information to file debug_ Debug_in line.txt Info can also be exported using similar commands.
ELF, Mach-O are file names used by Linux and MacOS platforms to store binaries, executables, target code, and shared libraries, respectively.
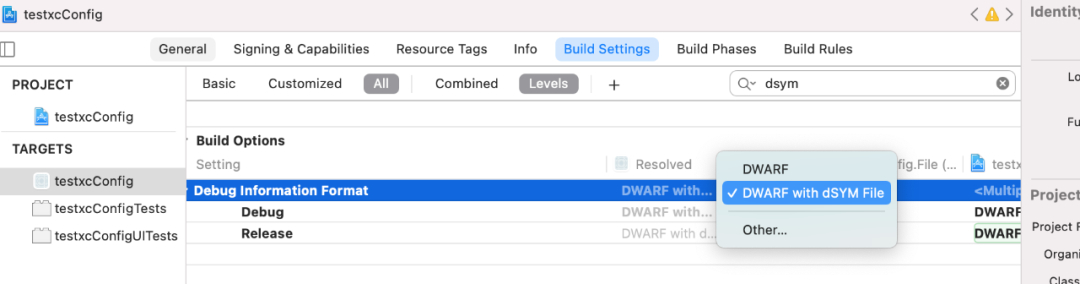
2.2 How to generate dSYM files
When compiling a project, Debug mode checks not to generate a dSYM file by default, which can be configured in Changed in Build Setting|Build Option, dSYM is generated by default in Release mode. In addition, if bitcode optimization is turned on, Apple will do secondary compilation optimization, so the final dSYM will need to be manually downloaded by Apple Connect. The dSYM generated by each compilation is different, usually DSYM has a unique identity, called UUID, to distinguish between different dSYM files.
2.3 How do I find a matching dSYM from the UUID used in the crash log?
When restoring the crash stack, the UUID of the dSYM is required to match the UUID of the application when the crash occurs. Usually, each dSYM file has a UUID, which corresponds to the UUID in the App file, representing an application. Each crash information records the UUID of the application and is used to proofread and match the UUID of the dSYM.
1. First find the UUID of the application from the Binary Images of the crash log, as follows, you can get the UUID of TestBacktrace as follows:
6be881754f573769926b838490e39857.
Binary Images:
0x102a40000 - 0x102a6bfff TestBacktrace arm64  <6be881754f573769926b838490e39857> /var/containers/Bundle/Application/B44844E6-AFF4-491E-8168-F4ED93D644C2/TestBacktrace.App/TestBacktrace
0x102d14000 - 0x102d6bfff dyld arm64  <9c893b6aa3b13d9596326ef6952e7195> /usr/lib/dyld
2. Use the following commands to view the UUID of the dSYM file, remove - and lower case, which is exactly the same as the UUID in the first step, proving that they match, otherwise they do not.
xcrun dwarfdump --uuid < dSYM file>

3. If there are too many local dSYMs, it is too cumbersome to view one by one. You can also use mdfind name to find dSYM locally according to UUID. For example, with the UUID above, simply type the following command in the terminal.
mdfind "com_apple_xcode_dsym_uuids == 6BE88175-4F57-3769-926B-838490E39857"
2.4 Symbolized process
The process of converting the APP binary address in the crash log into a function is as follows:
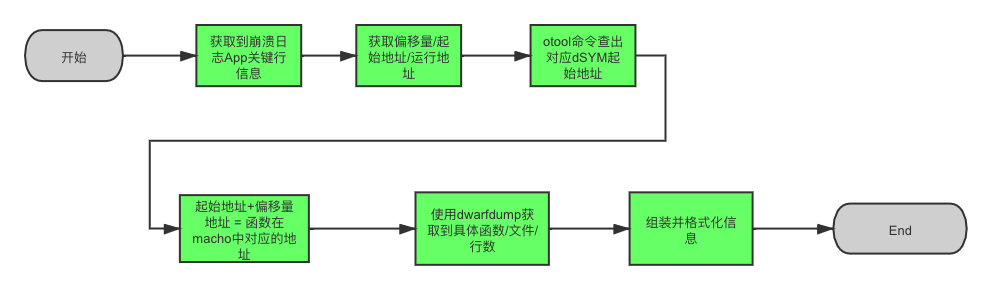
Get crash log App critical line information
As you can see from the diagram above, the behavior of building an APP is:
3 TestBacktrace 0x102a47464 0x102a40000 + 29796
TestBacktrace is our binary package name, and the rest of the rows are system stacks.
Get offset, run-time stack address, run-time APP start address
The TestBacktrace offset from the start address obtained from the key line information is 29796, the run-time stack address is 0x102a47464, and the run-time APP start address is 0x102a40000.
Get dSYM Start Address
The starting address of the TEXT segment of the symbol table saved in the dSYM file can be obtained by following commands:
otool -l /Users/xxxxx/Desktop/TestBacktrace.app.dSYM/Contents/Resources/DWARF/TestBacktrace | grep __TEXT -C 5
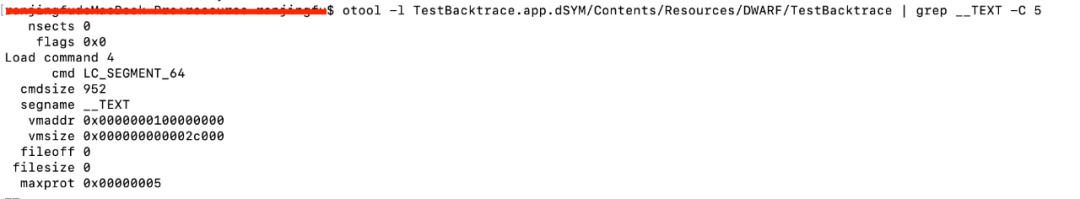
The starting address of the code snippet in dSYM is 0x10000000 as shown in the figure above.
Calculate crash address corresponding to address in dSYM symbol table
Because the ASLR(Address Space Layout Randomization) mechanism is used safely when iOS loads Mach-O files, the first address of binary Mach-O files loaded into memory will be different each time, but the offset, loading address and starting address calculation rules are the same; From above we can get The formula 0x102a47464 (run-time address) = 0x102a40000 (start address) + 29796 (offset). Therefore, the starting address and offset of dSYM can be used to calculate that 0x102a47464 corresponds to 0x100007464 = 0x0000000100000 + 29296 in dSYM.
Get specific functions/lines/files
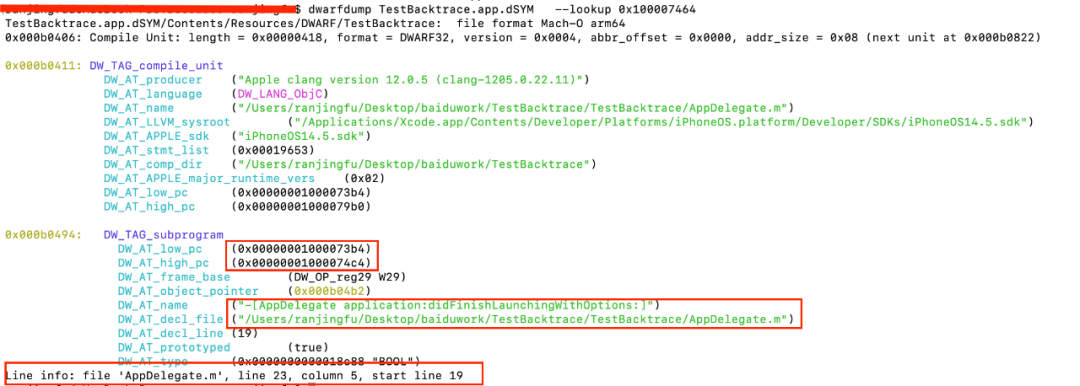
After getting the corresponding address 0x100007464 of the dSYM file for the run stack address, you can find the Debug Information Entry unit that contains the address in the debug-info of the dSYM file and use the command under the Mac OS.
dwarfdump TestBacktrace.app.dSYM --lookup 0x100007464
Get the appropriate information, as shown in the diagram:
-
DW_TAG_Subprogram Indicates that this DIE unit represents a function method.
-
DW_AT_low_pc indicates that this method starts at 0x1000073b4.
-
DW_ AT_ High_ The PC indicates that the method end address is 0x1000074c4. This means that the converted offset address 0x100007464 of 0x102a47464 in the crash log happens to be in this DW_AT_low_p and DW_ AT_ High_ Between PCs.
-
DW_AT_name means our function name is [AppDelegateApplication:didFinishLaunchingWithOptions:].
-
DW_AT_decl_file indicates that the file path where the function is located is AppDelegate.m.
-
DW_AT_decl_line means that the starting number of lines for the function is 19.
Assemble and format
Finally, after format optimization, the crash log 0x102a47464 is symbolized by:
3 TestBacktrace 0x102a47464 -[AppDelegate Application:didFinishLaunchingWithOptions:] + 29796 (AppDelegate.m:23
3. Local Symbolization
3.1 Symbolization Method
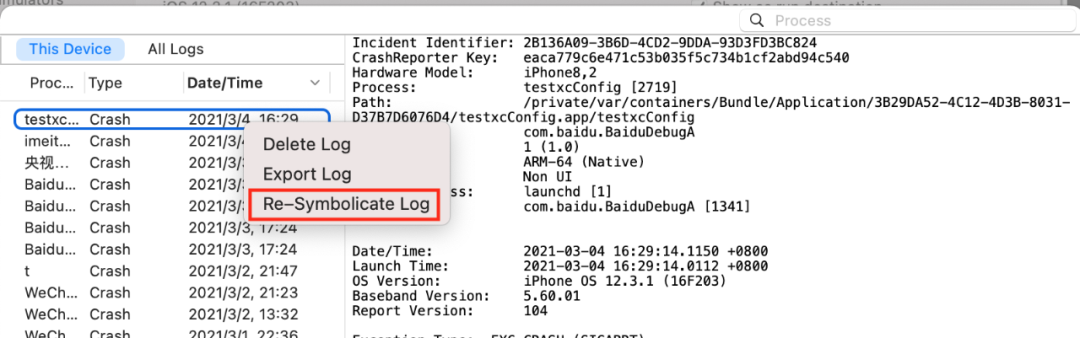
Xcode Symbolization
Put the crash log, dSYM file, and executable in the same directory, then drag the crash log to Devicelog, right-click symbolicate Log Or Re-symbolicate Log Can be symbolized.
Symbolize using the symbolicatecrash command line
- Location symbolicatecrash script
Typically, the path to symbolicatecrash is/Applications/Xcode.App/Contents/SharedFrameworks/DVTFoundation.framework/Versions/A/Resources/symbolicatecrash
- Prerun command
Before running symbolicatecrash, you usually need to run:
export DEVELOPER_DIR="/Applications/XCode.App/Contents/Developer"
- Run the symbolicatecrash command
First copy the crash log, dSYM, and symbolicatecrash into the same folder, then cd to the current folder, run the following command to symbolize
./symbolicatecrash TestBacktrace-2021-07-30-135514.ips TestBacktrace.app.dSYM > symbol.log
3.2 System Log Symbolization
It is worth noting that sometimes there are no App calls in the crash log, but probably all system library calls, as follows:
Thread 32 Crashed:
0    libobjc.A.dylib                 0x19aaf6c10 0x19aad3000 + 146448
1    CFNetwork                       0x187545a28 0x18737d000 + 1870376
2    Foundation                      0x18808db4c 0x187f6c000 + 1186636
3    Foundation                      0x187f8a908 0x187f6c000 + 125192
4    Foundation                      0x18808fde8 0x187f6c000 + 1195496
5    Foundation                      0x187f8a5c4 0x187f6c000 + 124356
6    Foundation                      0x1880907e0 0x187f6c000 + 1198048
7    Foundation                      0x1880902ac 0x187f6c000 + 1196716
8    libdispatch.dylib               0x1869863e4 0x186976000 + 66532
9    libdispatch.dylib               0x1869d7298 0x186976000 + 397976
10   libdispatch.dylib               0x18697c028 0x186976000 + 24616
11   libdispatch.dylib               0x18697b828 0x186976000 + 22568
12   libdispatch.dylib               0x186988bb8 0x186976000 + 76728
13   libdispatch.dylib               0x186989378 0x186976000 + 78712
14   libsystem_pthread.dylib         0x1cf2c5580 0x1cf2ba000 + 46464
The symbolized logs are:
Thread 32 Crashed:0 libobjc.A.dylib _objc_release (in libobjc.A.dylib) 161 CFNetwork __CFNetworkHTTPConnectionCacheSetLimit (in CFNetwork) 1547282 Foundation ___NSBLOCKOPERATION_IS_CALLING_OUT_TO_A_BLOCK__ (in Foundation) 163 Foundation -[NSBlockOperation main] (in Foundation) 1004 Foundation ___NSOPERATION_IS_INVOKING_MAIN__ (in Foundation) 205 Foundation -[NSOperation start] (in Foundation) 7846 Foundation ___NSOPERATIONQUEUE_IS_STARTING_AN_OPERATION__ (in Foundation) 207 Foundation ___NSOQSchedule_f (in Foundation) 1808 libdispatch.dylib __dispatch_block_async_invoke2 (in libdispatch.dylib) 1049 libdispatch.dylib __dispatch_client_callout (in libdispatch.dylib) 1610 libdispatch.dylib __dispatch_continuation_pop$VARIANT$mp (in libdispatch.dylib) 41211 libdispatch.dylib __dispatch_async_redirect_invoke (in libdispatch.dylib) 78412 libdispatch.dylib __dispatch_root_queue_drain (in libdispatch.dylib) 37613 libdispatch.dylib __dispatch_worker_thread2 (in libdispatch.dylib) 12014 libsystem_pthread.dylib __pthread_wqthread (in libsystem_pthread.dylib) 212
It can be seen that the problem caused by the wildpointer occurs when a CFNetwork network request occurs, so we can further investigate the network-related requests.
It can be concluded that symbolizing system libraries is necessary, especially for crash logs that are completely unavailable for some App stack information.
How to symbolize system library symbols
Symbolize the method name of your own App by compiling the resulting dSYM file. To symbolize system libraries as complete method names, symbolic files of iOS system libraries are also required.
-
Match corresponding symbol file version
The user's crash logs come from various system versions and require the corresponding version of the system symbol file to be symbolized. System library symbol files are not generic, but correspond to the system version and CPU model of the device where the crash occurred.
There are several pieces of information in the crash log:
Code Type:       ARM-64
OS Version:      iOS 10.2 (14C82)
.........
Binary Images:
0x102a40000 - 0x102a6bfff TestBacktrace arm64  <6be881754f573769926b838490e39857> /var/containers/Bundle/Application/B44844E6-AFF4-491E-8168-F4ED93D644C2/TestBacktrace.App/TestBacktrace
0x102d14000 - 0x102d6bfff dyld arm64  <9c893b6aa3b13d9596326ef6952e7195> /usr/lib/dyld
Code Type indicates whether the CPU architecture of this device is armv7, armv7s, arm64, or arm64e.
OS Version represents the system version number of the device, and the string in parentheses represents the build number of the system.
The characters in <9c893b6aa3b13d9596326ef6952e7195> in Binary Images represent the UUID of the corresponding system library dyld. Only build + UUID matching system library symbol files can symbolize system symbols.
-
Place the symbol file in the specified location
By placing the corresponding version of the symbol file you get in the ~/Library/Developer/Xcode/iOS DeviceSupport directory of the Mac OS, you can symbolize it using the symbolization tool symbolicatecrash that comes with Xcode. This tool automatically searches the symbolic files of the native system library based on the UUID of the system library in the crash log.
3.3 Two Methods to Get System Symbol Files
Get it from the real machine
Most system library symbol files are only available from the real machine, and Apple does not provide a direct download address. But when you first connect a device with Xcode for real-time debugging, you will see that Xcode displays Processing symbol files, which are copied from the real-time symbol files to the Mac OS system's / Users/xxx/Library/Developer/Xcode/iOS DeviceSupport directory.
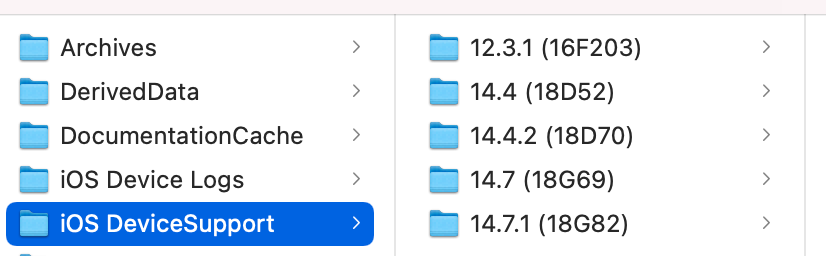
Folders such as 14.7.1 (18G82) in the directory are corresponding symbol files, usually 1-5GB in size.
Extracting symbol files from firmware
There are several ways to extract system library symbol files from the firmware (iPSW). Firmware decryption consists of downloading and extracting system symbols and extracting system library symbols.
1. Download and extract system symbols
- IOS9 and before iOS9
a. Download the corresponding version of the iPSW firmware and decompress it directly. After decompression, there are several mirror files in dmg format. The largest DMG file is the system image.
b. From Firmware_Keys (see reference link at the end of this article) found the decryption key for the corresponding firmware (the key of the Root Filesystem field on the page)
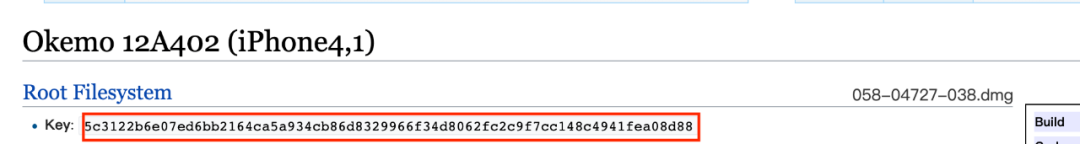
c. Decrypt with the DMG tool. cd to the unpacked iPSW folder, execute. /dmg extract xxx-xxx-xxx.dmg dec.dmg-k <key> . Extract is followed by two parameters, the name of the system mirror DMG and the decrypted file name, and -k is followed by the key obtained in step 2. If the key is not correct, decryption will fail. After successful decryption, a dec.dmg file is generated, and the system image can be loaded by double-clicking the open file.
- iOS10 and beyond
Download the corresponding version of the iPSW firmware, decompress directly, there are several dmg format mirror files inside, the largest dmg file is the system mirror.

2. System Library Symbol Extraction
Starting with iPhone OS 3.1, all system libraries are packaged into one file:
dyld_shared_cache_xxx, where xxx represents the specific architecture, is located in the directory: /System/Library/Caches/com.Apple.dyld.
Dyld_ Shared_ Cache_ Unzip XXX files using dsc_in dyld Extractor.cpp code, but with some changes.
a. First download the source code for the source dyld library on the Apple Open Source website. Note that you need to download the source code for dyld-7 here.
b. After downloading the file dsc_extractor.cpp, the code before and after the main function is changed to the following:
#if 1
// test program
#include <stdio.h>
#include <stddef.h>
#include <dlfcn.h>
typedef int (*extractor_proc)(const char* shared_cache_file_path,const char* extraction_root_path,void (^progress)(unsigned current,unsigned total));
int main(int argc, const char* argv[]){
if ( argc != 4 ) {
fprintf(stderr,"usage: dsc_extractor <dsc_extractor.bundle path> <path-to-cache-file> <path-to-device-dir>\n");
return 1;
    }
void* handle = dlopen(argv[1],RTLD_LAZY);
if ( handle == NULL ) {
fprintf(stderr,"dsc_extractor.bundle could not be loaded\n");
return 1;
    }
    extractor_proc proc = (extractor_proc)dlsym(handle,"dyld_shared_cache_extract_dylibs_progress");
if ( proc == NULL ) {
fprintf(stderr,"dsc_extractor.bundle did not have dyld_shared_cache_extract_dylibs_progress symbol\n");
return 1;
    }
int result = (*proc)(argv[2],argv[3],^(unsigned c, unsigned total) { printf("%d/%d\n", c, total); } );
fprintf(stderr, "dyld_shared_cache_extract_dylibs_progress() => %d\n",r esult);
return 0;
}
#endif
c. Compile and generate dsc_on the terminal command line under launch-cache from cd to dyld source directory Extractor tool.
clang++ -o dsc_extractor dsc_extractor.cpp dsc_iterator.cpp
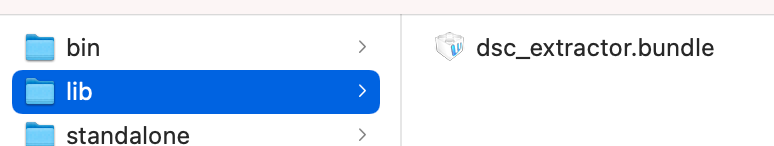
d. Extract dsc_from Xcode package/Applications/Xcode.App/Contents/Developer/Platforms/iPhoneOS.platform/usr/lib Extractor.bundle file. Dsc_ The extractor.bundle is strongly related to the iOS system to be extracted, such as the iOS14 system symbols that need to export dsc_in Xcode12 Extractor.bundle, while iOS15 requires Xcode 13 Beta. If they do not match, it is possible that the system symbols cannot be extracted.
e. Call the following command to extract the system symbols; Following is the final extracted system library in directory 17C81. The files we need to parse system symbols are basically dylib and framework.
dsc_extractor dsc_extractor.bundle /System/Library/Caches/com.Apple.dyld/dyld_shared_cache_arm64 17C81
4. Online Symbolization
4.1 Why do you want to symbolize Online
-
Symbol files are generated by a continuous integration packer when packaging and are locally available at a cost.
-
Convenient for developers to quickly symbolize crash logs. Many times, crashes occur when applications are used by non-developers (products, QA s, etc.); After synchronization to the developer, due to local differences, the developer also needs to be able to quickly symbolize the crash stack without a packaging environment
-
The crash log uploaded by online users is large. Most crashes occur during user usage after publication. If a large number of online logs are synchronized to developers without symbolization, it will increase the burden on developers and reduce the efficiency of problem solving.
-
There are many user systems, so it is difficult to collect them. Users have systems ranging from iOS9 to iOS14, and oddly, it's assumed that developers will be able to interpret all the system symbols locally.
4.2 Online App / Dynamic Library Symbolization
Typically, we only need to symbolize a very small number of crash logs, in which case we can symbolize locally. However, when our apps are released online, the crash logs may be collected at an average magnitude of over a million, which makes it unsuitable to symbolize individual logs using scripts/tools on the MacOS (it takes almost a second or more to symbolize individual logs using the symbolicatecrash command on the MacOS). At this point, you need a more general and fast way to symbolize.
In order to quickly symbolize the iOS crash logs on Linux servers, we have investigated the principles of iOS local symbolization, and after many discussions with the platform on the technical options, we have finally taken the following measures:
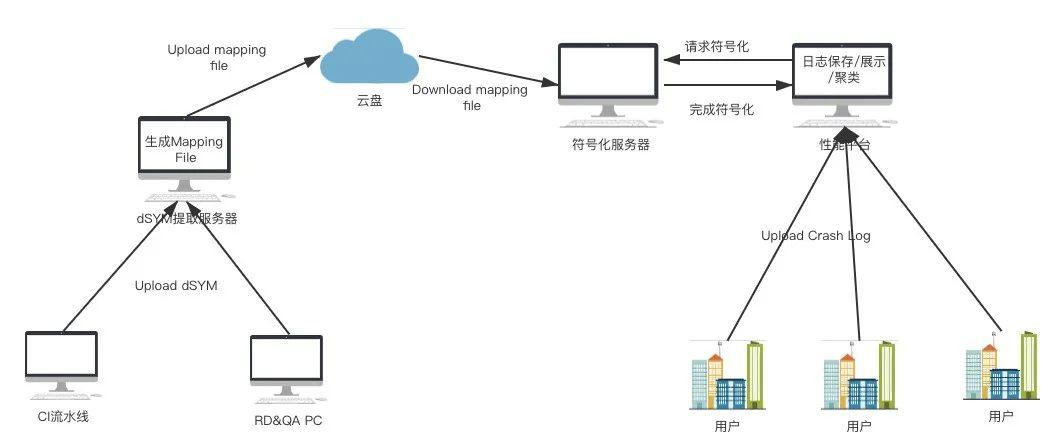
Generate mapping file
The dSYM file is extracted from the script to generate a mapping file in the following format:
Format: Mach-O/64-BitArch: arm64Symbols: 5Tool Version:: 1.0.1File Version: 1.0.0UUID: e569d81abb2c372e89a2410edc3d368fBuilt Time: 2021-07-29 13:31:08Symbol table:6c64 6c78 -[ViewController viewDidLoad] (in TestBacktrace) (ViewController.m:17)6c78 6c84 -[ViewController viewDidLoad] (in TestBacktrace) (ViewController.m:0)
Extraction involves debug_in DWARF Symbolization of line segment data and related extraction algorithms can refer to official DWARF data. Debug_ The line segment contains the detailed code offset address and file name, which can be parsed out according to the DWARF algorithm, and matched one-to-one with the symbols of the Symbol Table function to generate a mapping relationship between the code address offset and the function, file, and line number. It is important to note that most of Apple's Mach-O formats now use DWARF2 and DWARF4 versions, and the compatibility and algorithms of these two formats are different when extracting. Finally, you can see the offset of one symbol per row of the Symbol table.
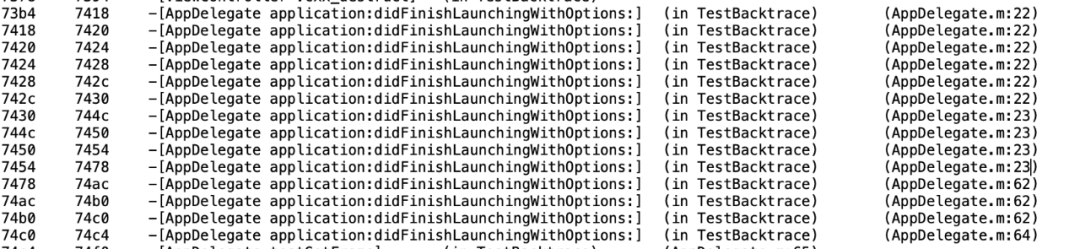
You can see that 7464 happens between 7454 and 7478, matching exactly the symbols - [AppDelegate Application:didFinishLaunchingWithOptions:] (in TestBacktrace) (AppDelegate.m:23) as symbolized by the symbolic tecrash script on Mac OS.
Symbolize according to mapping file
With the symbolic mapping file extracted by the script tool, the server can get rid of platform limitations, match the mapping file according to the UUID in the crash log, symbolize the crash log extremely quickly on Linux, and provide efficient and real-time symbolization services.
4.3 Online Symbolization of iOS System Library Symbols
On the MacOS platform, we can directly symbolize symbols using scripts using symbols from system libraries, but once we symbolize crash logs uploaded by all users, this set of mechanisms will inevitably be limited by speed and platform. And since the iOS system began in 2.0 and has been issuing hundreds of versions of iOS 14, it is almost impossible to manually extract system library symbols. To solve this problem, after learning from the dSYM cross-platform symbolization scheme, we have made a set of automatic symbolization scheme of system symbols, and finally achieved an efficient and real-time symbolization system stack on Linux platform.
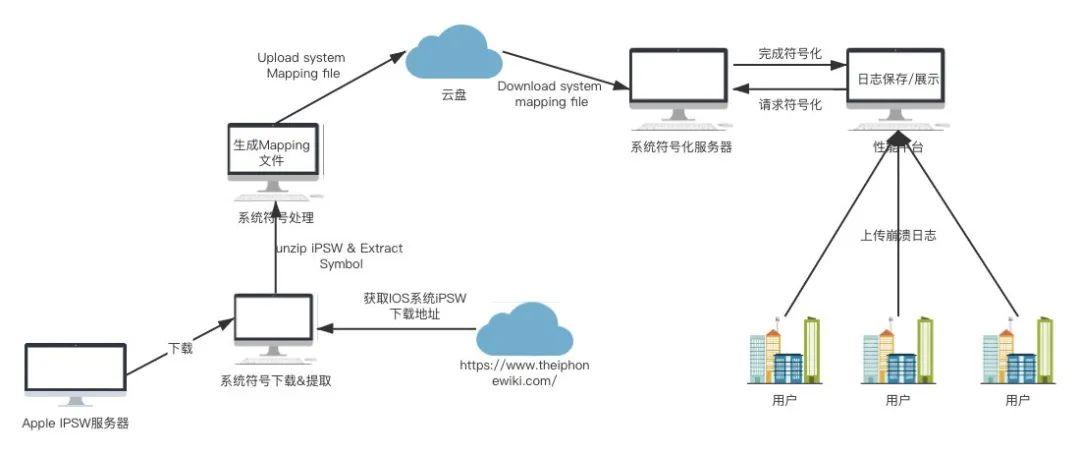
1. Timely export iPSW file download addresses for each system and the latest publishing system from the iphonewiki website.
2. Unzip the iPSW and load the system image dmg file to find dyld_shared_cache_xxx file.
3. Using the tool dsc_extractor exports system library symbol files, which are basically Mach-O type files suffixed with dylib and framework.
4. Extract all dylib s and framework s using tools to generate mapping files in the following format. This step differs from dSYM extraction in that, in general, the system libraries only have symbol table segments and do not require debug_line segment extraction is relatively simple.
20b8 20fa +[ZoomServicesUI enableZoomServices] (in AccessibilitySettingsLoader)20fa 2120 +[ZoomServicesUI disableZoomServices] (in AccessibilitySettingsLoader)2120 21b6 -[ZoomServicesUI init] (in AccessibilitySettingsLoader)21b6 2222 -[ZoomServicesUI dealloc] (in AccessibilitySettingsLoader)
5. After the crash log is uploaded to the symbolized server, the server uniquely determines the mapping file and symbolizes the system stack based on the UUID of the system library in the crash log and the UUID in the mapping file.
V. Effect
1. After the online symbolization system comes online and the user's logs are automatically uploaded to performance by the crash component, the symbolization parsing system symbolizes and clusters the crash logs directly. The final symbolized crash logs are detailed below. Ultimately, the address of the application is function + file + line number, and the system stack will show the crashed function in a real-time and efficient way.
Last Exception Backtrace:
0   CoreFoundation                  0x1ca4cd27c __exceptionPreprocess + 228
1   libobjc.A.dylib                 0x1c96a79f8 objc_exception_throw + 55
2   CoreFoundation                  0x1ca3ded94 -[__NSSingleObjectArrayI objectAtIndex:] + 127
3   TestBacktrace                   0x102a47464 -[AppDelegate Application:didFinishLaunchingWithOptions:] + 29796 (AppDelegate.m:23)
4   UIKitCore                       0x1f6c86e30 -[UIApplication _handleDelegateCallbacksWithOptions:isSuspended:restoreState:] + 411
5   UIKitCore                       0x1f6c88594 -[UIApplication _callInitializationDelegatesForMainScene:transitionContext:] + 3351
6   UIKitCore                       0x1f6c8dd20 -[UIApplication
Thread 0 name: Dispatch queue: com.Apple.main-thread Thread 0 Crashed: 0 libsystem_kernel.dylib 0x00000001ca06a0dc __pthread_kill + 8 1 libsystem_pthread.dylib 0x00000001ca0e3094 pthread_kill$VARIANT$mp + 380 2 libsystem_c.dylib 0x00000001c9fc3ea8 abort + 140 3 libc++abi.dylib 0x00000001c9690788 __cxa_bad_cast + 0
2. Some crash logs from R&D and testing. The platform provides an online symbolized entry. Simply upload the crash logs to the platform manually, and the symbolized crash logs can be downloaded to the appropriate personnel immediately.
6. Income
1. Online problem locating speed has been greatly improved, from new Carton/Crash problems on the line to specific R&D response time has been greatly reduced, from crash to location problems, basically within 10 minutes.
2. Currently, the performance platform symbolizes crashes/Carton logs online more than a million times a day, and the product line is connected in the factory with more than 30+. The symbolization function enables upload-and-parse without the intervention of R&D personnel. Automation, on-line, real-time symbolized crashes, Carton logs, and real-time symbolized problem code to target specific developers, efficient response and solve online problems.
Reference material:
[1] iOS Crash Analysis Requirements: Symbolized System Library Method https://zuikyo.github.io/2016/12/18/iOS%20Crash%E6%97%A5%E5%BF%97%E5%88%86%E6%9E%90%E5%BF%85%E5%A4%87%EF%BC%9A%E7%AC%A6%E5%8F%B7%E5%8C%96%E7%B3%BB%E7%BB%9F%E5%BA%93%E6%96%B9%E6%B3%95/[2] Chat about extracting system library symbols from iOS firmware http://crash.163.com/#news/!newsId=31
[3] Several settings related to symbols in Xcode https://www.jianshu.com/p/11710e7ab661[4] iOS_SDK https://en.wikipedia.org/wiki/IOS_SDK[5] IOS_version_history https://en.wikipedia.org/wiki/IOS_version_history#iOS_14
[6] dyld source download address https://opensource.apple.com/tarballs/dyld/[7] The DWARF Debugging Standard http://www.dwarfstd.org/[8] Firmware_before iOS9 Keys https://www.theiphonewiki.com/wiki/Firmware_Keys
[9] dmg Tool Download Address https://github.com/Zuikyo/iOS-System-Symbols/blob/master/tools/dmg[10] System Symbol Download Address Index wiki https://www.theiphonewiki.com/wiki/Firmware
Recruitment information:
Senior/Senior Engineer in Mobile
We are the Baidu APP mobile technology platform team, responsible for Baidu APP performance optimization, network optimization, architecture upgrade, project performance improvement and new technology exploration. We work hard on online and offline research and development tools, intelligent performance optimization, network library development, network monitoring, compiling and building systems, dynamic schemes, etc., and are technically mobile lighthouse. We support rapid business iteration while ensuring R&D performance of very large teams to serve more than 600 million MAU users.
We are committed to creating the best performance APPs in the industry, with excellent performance stability and fluency on high, medium and low-end machines.
We are committed to building a mobile technology platform suitable for Baidu, enabling Baidu's mobile products, smart speakers and in-vehicle devices.
Technology stack: Java/OC/C/C++/Kotlin/Swift/Ruby/PHP, etc.
Support business: Baidu APP search, Feed, applets, live broadcasting, video and so on; Baidu Poster, good-looking video and other mobile products; IOT devices such as low-pitch speakers; Intelligent transportation, vehicle networking and other on-board devices.
Qualification requirements: general enrollment undergraduate graduation
If you have expertise in one direction, technical depth; If you love to specialize, challenge difficult problems; If you love to break through innovations and solve problems with new technologies like end-smart, this is the stage where you can bring your talents to full play!
Delivery mailbox:
geektalk@baidu.com (Deliver Remarks)
Recommended reading:
High Availability Construction Method and Practice of Baidu Commercial Hosting Page System
The Application of AI in Video Shooting Through People
_iOS Signature Verification Those things
---------- END ----------
Baidu Geek said
Baidu's official technology public number is online!
Technical Dry Goods, Industry Information, Online Salon, Industry Conference
Recruitment Information, Introducing Information, Technical Books, Baidu Peripheral
Welcome to your attention