"
Elasticsearch is a real-time distributed search and analysis engine. Its bottom layer is built on Lucene. In short, Lucene has distributed functions by expanding its search capabilities.
ES usually provides end-to-end log / search analysis together with the other two open source components Logstash (log collection) and Kibana (dashboard), which is often referred to as ELK.
Clickhouse is a relational database for column storage developed by Russian search giant Yandex. Clickhouse is the most popular in the field of OLAP in the past two years and was open source in 2016.
ES is the most popular big data log and search solution. But in recent years, its Kwai Fu status has been challenged. Many companies have begun to migrate their log solutions from ES to Clickhouse.
Comparison of architecture and design
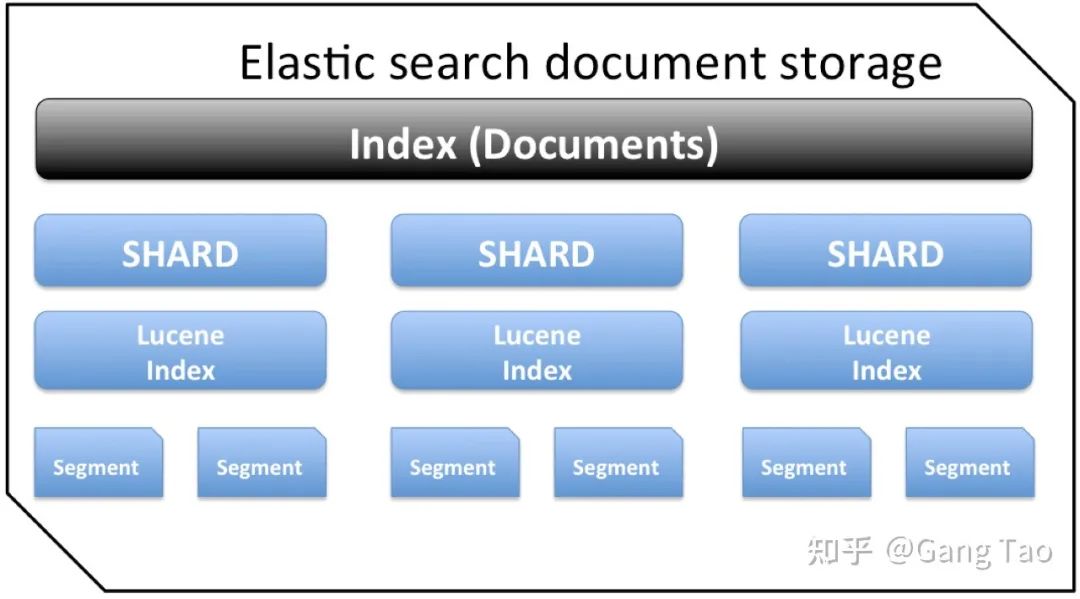
Lucenc is the bottom layer of ES, mainly to solve the problem of search. Search is a common problem to be solved in the field of big data, that is, how to find the required data according to the conditions in the massive amount of data. The core technology of search is inverted index and bloom filter.
Through distributed technology, ES directly solves the problems of search performance and high availability in cluster by using fragmentation and replica mechanism.
ElasticSearch is designed for distributed and has good scalability. In a typical distributed configuration, each node can be configured into different roles.
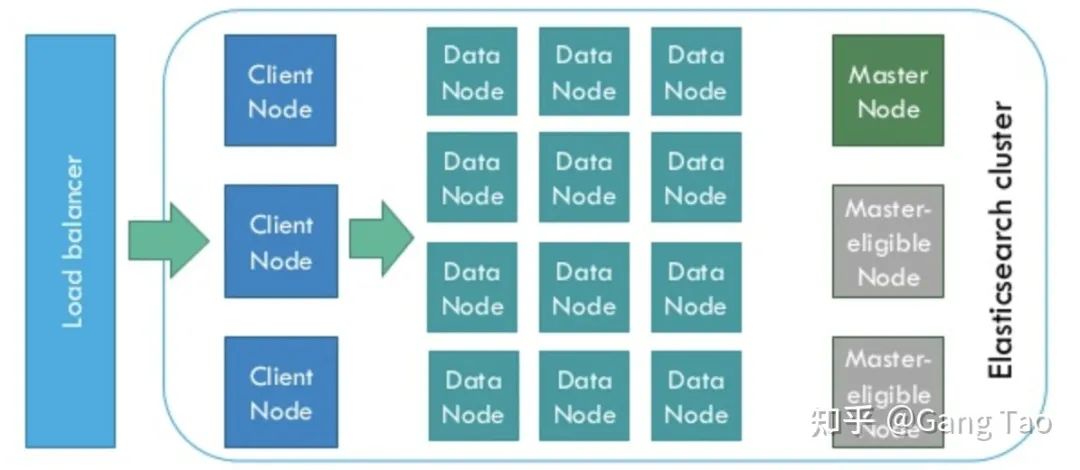
As shown in the figure above:
-
Client Node, which is responsible for API and data access, does not store / process data.
-
The Data Node is responsible for data storage and indexing.
-
Master Node, the management node, is responsible for the coordination of nodes in the Cluster and does not store data.
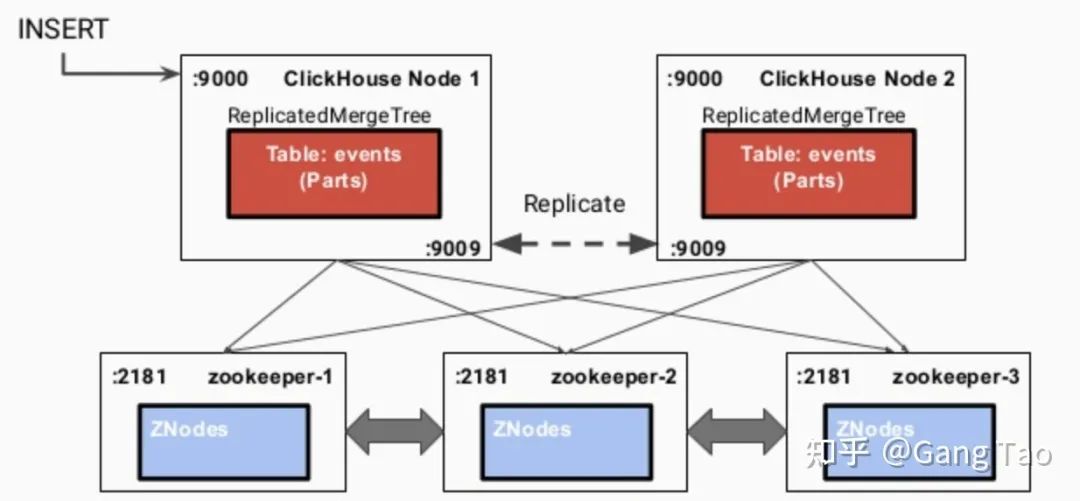
ClickHouse is a distributed ROLAP (relational OLAP) analysis engine based on MPP architecture. Each node has the same responsibility and is responsible for some data processing (no content is shared).
ClickHouse is a real columnar database management system (DBMS). In ClickHouse, data is always stored by column, including the process performed by vectors (vectors or column blocks).
The simplest and effective way to make query faster is to reduce the data scanning range and the size of data transmission, and column storage and data compression can help achieve the above two points.
Clickhouse uses log merge tree, sparse index and CPU functions (such as SIMD single instruction multiple data) to give full play to the advantages of hardware and realize efficient computing.
Clickhouse uses Zookeeper to coordinate among distributed nodes.
To support search, Clickhouse also supports Bloom filters.
Query and contrast actual combat
In order to compare the basic query capabilities of ES and Clickhouse, I wrote some codes to verify:
https://github.com/gangtao/esvsch
The test architecture is as follows:
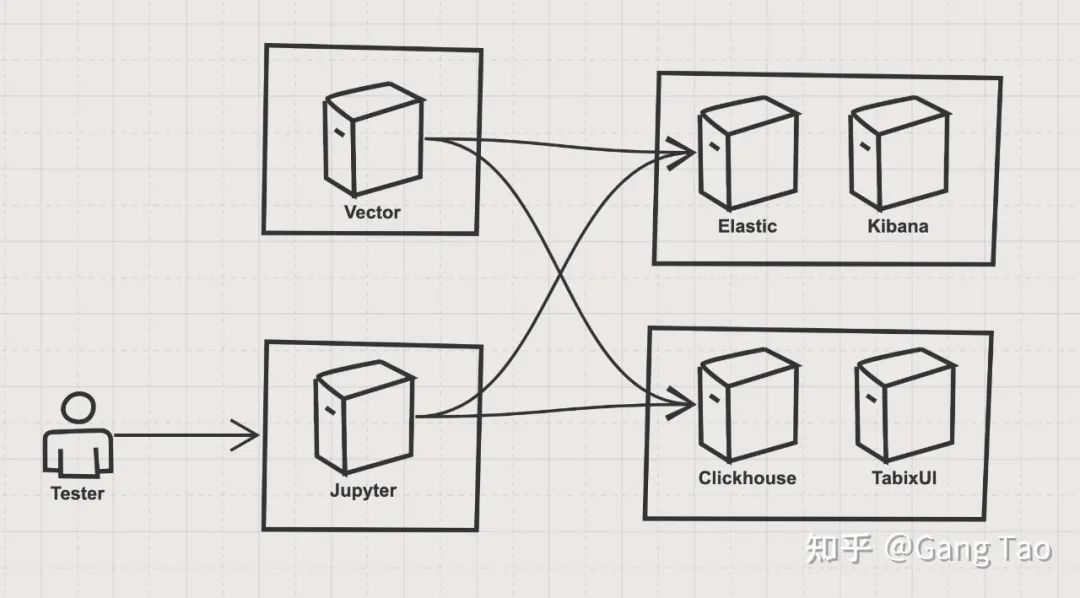
The architecture is mainly composed of four parts:
①ES stack
The ES stack consists of a single node elastic container and a Kibana container. Elastic is one of the tested targets, and Kibana is used as a verification and auxiliary tool.
The deployment code is as follows:
version: '3.7'

services:
  elasticsearch:
    image: docker.elastic.co/elasticsearch/elasticsearch:7.4.0
    container_name: elasticsearch
    environment:
      - xpack.security.enabled=false
      - discovery.type=single-node
    ulimits:
      memlock:
        soft: -1
        hard: -1
      nofile:
        soft: 65536
        hard: 65536
    cap_add:
      - IPC_LOCK
    volumes:
      - elasticsearch-data:/usr/share/elasticsearch/data
    ports:
      - 9200:9200
      - 9300:9300
    deploy:
      resources:
        limits:
          cpus: '4'
          memory: 4096M
        reservations:
          memory: 4096M

  kibana:
    container_name: kibana
    image: docker.elastic.co/kibana/kibana:7.4.0
    environment:
      - ELASTICSEARCH_HOSTS=http://elasticsearch:9200
    ports:
      - 5601:5601
    depends_on:
      - elasticsearch

volumes:
  elasticsearch-data:
    driver: local
②Clickhouse stack
The Clickhouse stack has a single node Clickhouse service container and a TabixUI as the client of the Clickhouse.
The deployment code is as follows:
version: "3.7"
services:
  clickhouse:
    container_name: clickhouse
    image: yandex/clickhouse-server
    volumes:
      - ./data/config:/var/lib/clickhouse
    ports:
      - "8123:8123"
      - "9000:9000"
      - "9009:9009"
      - "9004:9004"
    ulimits:
      nproc: 65535
      nofile:
        soft: 262144
        hard: 262144
    healthcheck:
      test: ["CMD", "wget", "--spider", "-q", "localhost:8123/ping"]
      interval: 30s
      timeout: 5s
      retries: 3
    deploy:
      resources:
        limits:
          cpus: '4'
          memory: 4096M
        reservations:
          memory: 4096M

  tabixui:
    container_name: tabixui
    image: spoonest/clickhouse-tabix-web-client
    environment:
      - CH_NAME=dev
      - CH_HOST=127.0.0.1:8123
      - CH_LOGIN=default
    ports:
      - "18080:80"
    depends_on:
      - clickhouse
    deploy:
      resources:
        limits:
          cpus: '0.1'
          memory: 128M
        reservations:
          memory: 128M
③ Data import stack
The data import part uses vector The vector developed by dev, which is similar to fluent D, can realize the flexible data import of data pipeline.
④ Test control stack
Test control I used Jupyter and the Python SDK of ES and Clickhouse to test the query.
After starting the stack of ES and Clickhouse with Docker compose, we need to import data. We use the generator function of Vector to generate syslog and import es and Clickhouse at the same time.
Before that, we need to create a table on the Clickhouse. The index of ES does not have a fixed pattern, so there is no need to create an index in advance.
The code for creating the table is as follows:
CREATE TABLE default.syslog(
    application String,
    hostname String,
    message String,
    mid String,
    pid String,
    priority Int16,
    raw String,
    timestamp DateTime('UTC'),
    version Int16
) ENGINE = MergeTree()
    PARTITION BY toYYYYMMDD(timestamp)
    ORDER BY timestamp
    TTL timestamp + toIntervalMonth(1);
After creating the table, we can start the vector and write data to the two stack s. The data pipeline of vector is defined as follows:
[sources.in]
  type = "generator"
  format = "syslog"
  interval = 0.01
  count = 100000

[transforms.clone_message]
  type = "add_fields"
  inputs = ["in"]
  fields.raw = "{{ message }}"

[transforms.parser]
  # General
  type = "regex_parser"
  inputs = ["clone_message"]
  field = "message" # optional, default
  patterns = ['^<(?P<priority>\d*)>(?P<version>\d) (?P<timestamp>\d{4}-\d{2}-\d{2}T\d{2}:\d{2}:\d{2}\.\d{3}Z) (?P<hostname>\w+\.\w+) (?P<application>\w+) (?P<pid>\d+) (?P<mid>ID\d+) - (?P<message>.*)$']

[transforms.coercer]
  type = "coercer"
  inputs = ["parser"]
  types.timestamp = "timestamp"
  types.version = "int"
  types.priority = "int"

[sinks.out_console]
  # General
  type = "console"
  inputs = ["coercer"]
  target = "stdout"

  # Encoding
  encoding.codec = "json"


[sinks.out_clickhouse]
  host = "http://host.docker.internal:8123"
  inputs = ["coercer"]
  table = "syslog"
  type = "clickhouse"

  encoding.only_fields = ["application", "hostname", "message", "mid", "pid", "priority", "raw", "timestamp", "version"]
  encoding.timestamp_format = "unix"

[sinks.out_es]
  # General
  type = "elasticsearch"
  inputs = ["coercer"]
  compression = "none"
  endpoint = "http://host.docker.internal:9200"
  index = "syslog-%F"

  # Encoding

  # Healthcheck
  healthcheck.enabled = true
Here is a brief introduction to the pipeline:
-
source.in: generate simulation data of syslog, generate 10w pieces, generation interval and 0.01 seconds.
-
transforms.clone_message: copy the original message so that the extracted information can retain the original message at the same time.
-
transforms.parser: use regular expressions to extract the fields of application, hostname, message, mid, pid, priority, timestamp and version according to the definition of syslog.
-
transforms.coercer: data type conversion.
-
sinks.out_console: print the generated data to the console for development and debugging.
-
sinks.out_clickhouse: send the generated data to the Clickhouse.
-
sinks.out_es: send the generated data to ES.
Run the Docker command to execute the pipeline:
docker run \
        -v $(mkfile_path)/vector.toml:/etc/vector/vector.toml:ro \
        -p 18383:8383 \
        timberio/vector:nightly-alpine
After the data is imported, let's make a comparison for the following queries. ES uses its own query language to query. Clickhouse supports SQL. I simply tested some common queries and compared their functions and performance.
Return all records:
# ES
{
  "query":{
    "match_all":{}
  }
}

# Clickhouse
"SELECT * FROM syslog"
Match a single field:
# ES
{
  "query":{
    "match":{
      "hostname":"for.org"
    }
  }
}

# Clickhouse
"SELECT * FROM syslog WHERE hostname='for.org'"
Match multiple fields:
# ES
{
  "query":{
    "multi_match":{
      "query":"up.com ahmadajmi",
        "fields":[
          "hostname",
          "application"
        ]
    }
  }
}

# Clickhouse,
"SELECT * FROM syslog WHERE hostname='for.org' OR application='ahmadajmi'"
Word lookup to find a field containing a specific word:
# ES
{
  "query":{
    "term":{
      "message":"pretty"
    }
  }
}

# Clickhouse
"SELECT * FROM syslog WHERE lowerUTF8(raw) LIKE '%pretty%'"
Range query to find records with version greater than 2:
# ES
{
  "query":{
    "range":{
      "version":{
        "gte":2
      }
    }
  }
}

# Clickhouse
"SELECT * FROM syslog WHERE version >= 2"
Found a record with a field:
# ES
{
  "query":{
    "exists":{
      "field":"application"
    }
  }
}

# Clickhouse
"SELECT * FROM syslog WHERE application is not NULL"
ES is a document type database. The mode of each document is not fixed, so a field does not exist; The Clickhouse field is null.
Regular expression query: query the data matching a regular expression:
# ES
{
  "query":{
    "regexp":{
      "hostname":{
        "value":"up.*",
          "flags":"ALL",
            "max_determinized_states":10000,
              "rewrite":"constant_score"
      }
    }
  }
}

# Clickhouse
"SELECT * FROM syslog WHERE match(hostname, 'up.*')"
Aggregate count to count the number of occurrences of a field:
# ES
{
  "aggs":{
    "version_count":{
      "value_count":{
        "field":"version"
      }
    }
  }
}

# Clickhouse
"SELECT count(version) FROM syslog"
Aggregate non duplicate values and find the number of all non duplicate fields:
# ES
{
  "aggs":{
    "my-agg-name":{
      "cardinality":{
        "field":"priority"
      }
    }
  }
}

# Clickhouse
"SELECT count(distinct(priority)) FROM syslog "
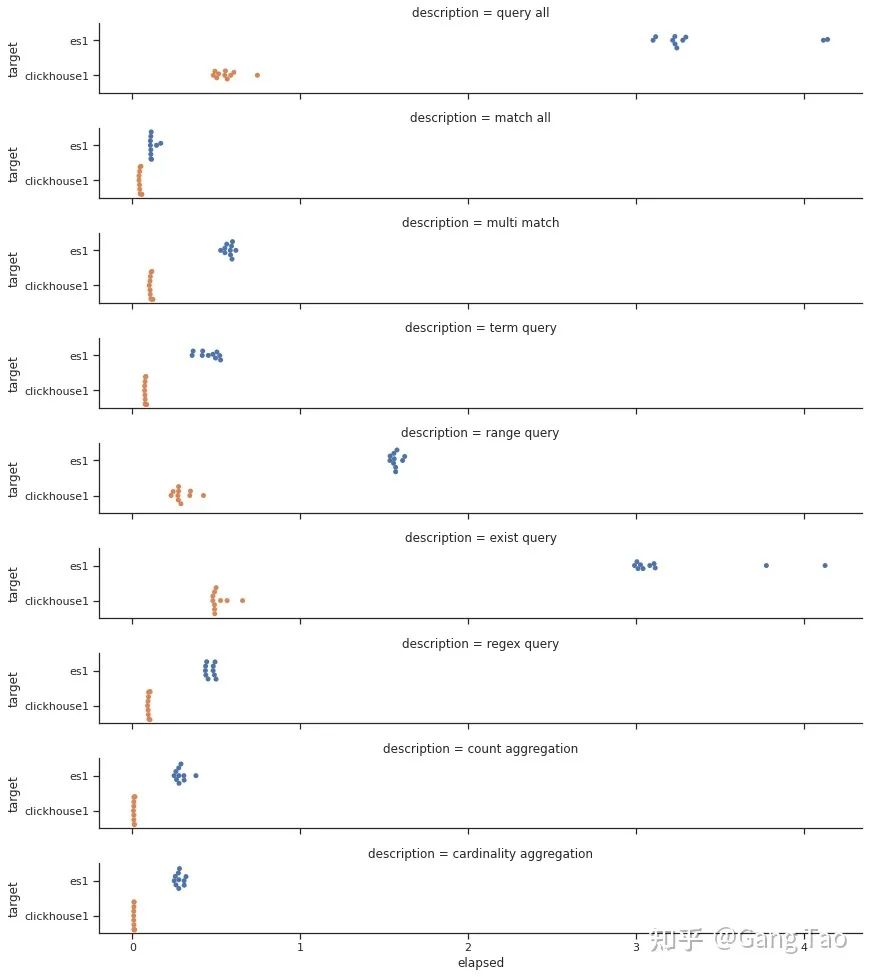
I use Python SDK to run the above query on two stacks for 10 times, and then count the performance results of the query.
We draw the response time distribution of all queries:
The comparison of total query time is as follows:
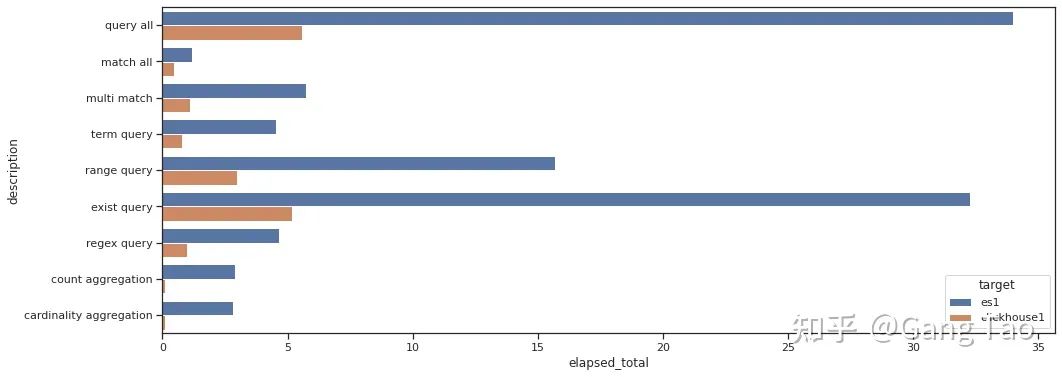
Through the test data, we can see that Clickhouse is obviously better than Elastic in the performance of most queries.
In common search scenarios such as Regex query and Term query, it is not inferior.
In the aggregation scenario, Clickhouse performs exceptionally well, giving full play to the advantages of liecun engine.
Note that my test did not have any optimizations, nor did I turn on the bloom filter for Clickhouse. It can be seen that Clickhouse is indeed a very excellent database, which can be used in some search scenarios.
Of course, ES also supports very rich query functions. There are only some very basic queries here. Some queries may not be expressed in SQL.
summary
By testing some basic queries, this paper compares the functions and performance of Clickhouse and elastic search.
The test results show that Clickhouse performs very well in these basic scenarios and its performance is better than es, which also explains why many companies should switch from ES to Clickhouse.
Author: Gang Tao
Editor: 51CTO technology stack | Tao Jialong
Source: zhuanlan zhihu. com/p/353296392