I. Preface
Using basemap to draw a map is simple and convenient. Using basemap needs to be combined with other libraries. The common one is matplotlib; After reading this article, readers will learn to simply use basemap or world map, country map, province and even specific region, etc; If the author's article is good, please praise and pay attention. Thank you. Don't play whoring for nothing;
II. BaseMap drawing
Map background description
- drawcoastlines(): draw the coastline.
- Fillcontaints(): coloring the interior of the continent (by filling the coastline polygon)
- drawcountries(): draw national boundaries.
- drawstates (): draw the state boundaries of North America.
- drawrivers (): draw rivers.
- drawlsmask(): draws a high-resolution sea land mask as an image, specifying land and ocean colors.
- bluemarble (): draw a NASA blue marble image as the map background.
- shadedrelief (): draws a shadow relief image as the map background.
- Etopo (): draw an etopo relief image as the map background.
- warpimage (): use abitrary image as map background. The image must be global, from the international data line to the East and the south pole to the north, covering the world in latitude / longitude coordinates.
2.1 arcgis REST API service drawing image
Basemap parameter description
- llcrnrlon longitude lower bound
- Lower bound of llcrnrlat latitude
- Upper bound of urcrnrlon longitude
- Upper bound of urcrnrlat latitude
arcgisimage parameter description
- Server remote server address
- service basemap type
- xpixels scaling
- dpi resolution
- verbose prints the URL used to get the remote image
service parameter list
http://server.arcgisonline.com/arcgis/rest/services
# -*- coding: utf-8 -*-
import warnings
warnings.filterwarnings('ignore')

from mpl_toolkits.basemap import Basemap
import matplotlib.pyplot as plt

map = Basemap(llcrnrlon=70,llcrnrlat=3,urcrnrlon=140,urcrnrlat=54)
map.arcgisimage(service='NatGeo_World_Map', xpixels = 1500, ypixels=None,dpi=120, verbose= True)
plt.show()
2.2 drawing coastline
Drawcaselines parameter description
- Linewidth: linewidth
- linestyle: set the line style, refer to matplotlib
- Color: color, refer to matplotlib
- Antialiasing: antialiasing
- axes axis instance
- zorder: shoreline layer location
# -*- coding: utf-8 -*-
import warnings
warnings.filterwarnings('ignore')
from mpl_toolkits.basemap import Basemap
import matplotlib.pyplot as plt
map = Basemap()
# National land fill color, Lake fill color
map.fillcontinents(color='coral',lake_color='aqua')
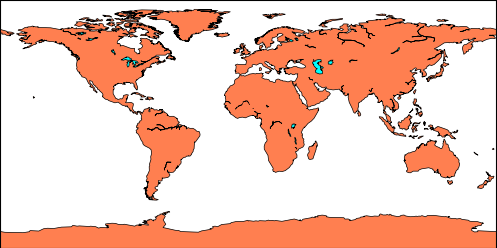
# Draw the coastline
map.drawcoastlines(linewidth=0.5, linestyle='solid', color='k', antialiased=1, ax=None, zorder=None)
plt.show()
result
2.3 mapping the country
The drawcountries parameter is similar to the coastline and will not be repeated
drawcountries(linewidth=0.5,linestyle='solid',color='k',antialiased=1,ax=None,zorder=None)
# -*- coding: utf-8 -*-
import warnings
warnings.filterwarnings('ignore')
from mpl_toolkits.basemap import Basemap
import matplotlib.pyplot as plt
# Specify the projection method; Set the longitude and latitude in the middle of the map of China
map = Basemap(projection='ortho',
lat_0=25, lon_0=105)
# Draw the map boundary and fill it with blue; Set line width
map.drawmapboundary(fill_color='aqua',linewidth=1.0)
# Land fill color, Lake fill color
map.fillcontinents(color='coral',lake_color='aqua')
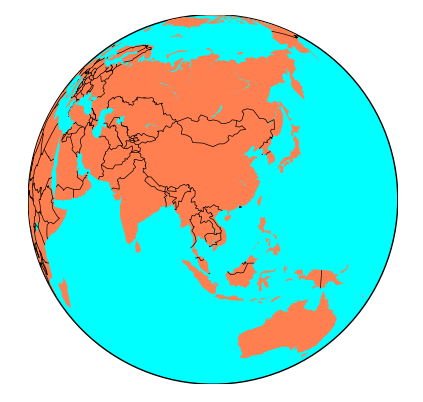
# Draw country
map.drawcountries()
plt.show()
result
2.4 drawing relief map
# -*- coding: utf-8 -*-
import warnings
warnings.filterwarnings('ignore')
from mpl_toolkits.basemap import Basemap
import matplotlib.pyplot as plt
map = Basemap(llcrnrlon=70,llcrnrlat=3,urcrnrlon=140,urcrnrlat=54,
resolution='i', projection='cass', lat_0 = 25, lon_0 = 105)
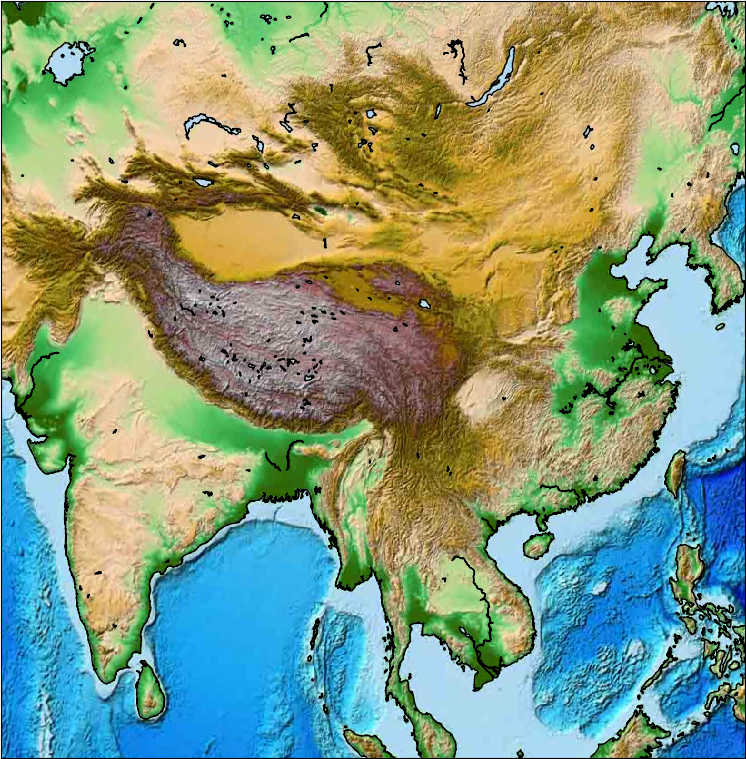
# Relief image
map.etopo()
# coastline
map.drawcoastlines()
# display
plt.show()
result
2.5 mapping with latitude and longitude
# -*- coding: utf-8 -*-
import warnings
warnings.filterwarnings('ignore')
from mpl_toolkits.basemap import Basemap
import matplotlib.pyplot as plt
# Specify the projection method; Set the longitude and latitude in the middle of the map of China
map = Basemap(projection='ortho',
lat_0=25, lon_0=105,
width=25000000, height=25000000)
# Draw the map boundary and fill it with blue; Set line width
map.drawmapboundary(fill_color='aqua',linewidth=1.0)
# Land fill color, Lake fill color
map.fillcontinents(color='coral',lake_color='aqua')
# Draw country
map.drawcountries()
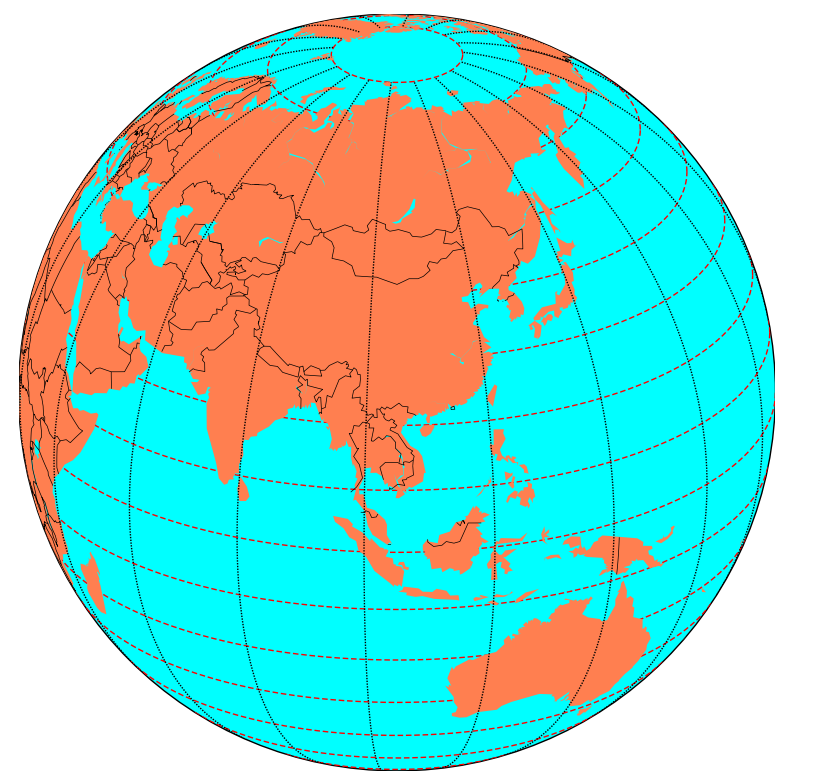
# Set longitude
map.drawmeridians(range(0, 360, 20))
# Set latitude
map.drawparallels(range(-90, 100, 10), dashes=[4, 2], color='r', zorder=0 )
plt.show()
result
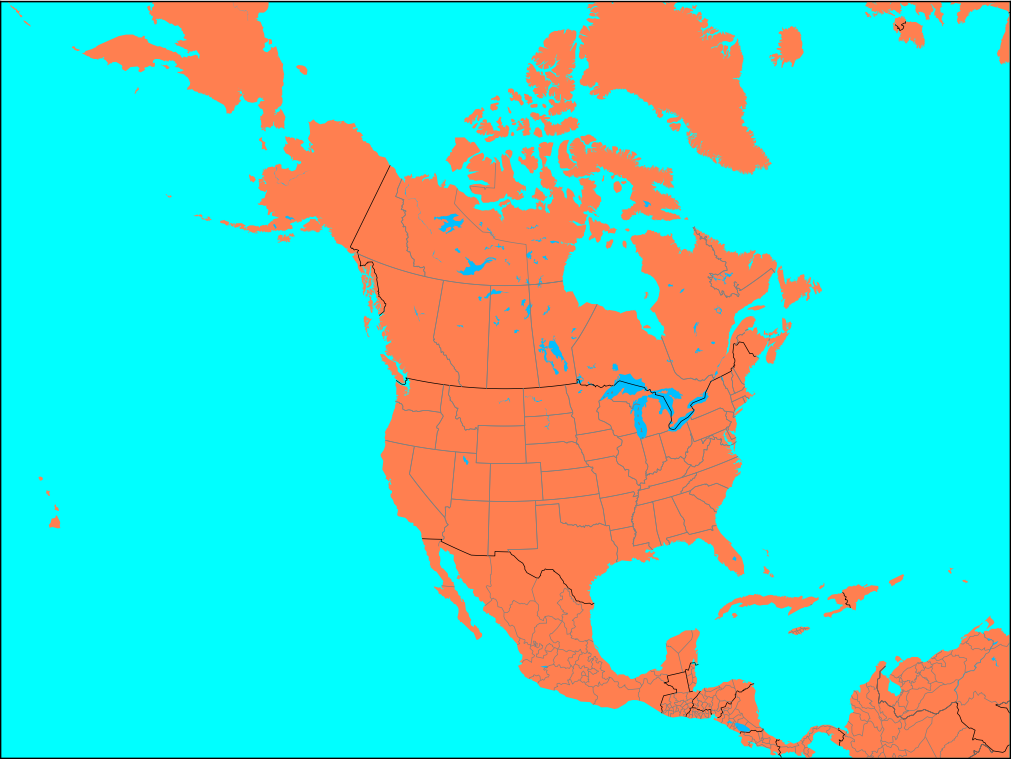
2.6 mapping the Americas
# -*- coding: utf-8 -*-
import warnings
warnings.filterwarnings('ignore')

from mpl_toolkits.basemap import Basemap
import matplotlib.pyplot as plt


map = Basemap(width=12000000,height=9000000,
            rsphere=(6378137.00,6356752.3142),
            resolution='l',area_thresh=1000.,projection='lcc',
            lat_1=45.,lat_2=55,lat_0=50,lon_0=-107.)
# Map boundary
map.drawmapboundary(fill_color='aqua')
# Land ocean filling
map.fillcontinents(color='#FF7F50', lake_color='#00BFFF')
# country
map.drawcountries()
# Map of America
map.drawstates(color='0.5')

plt.show()
result
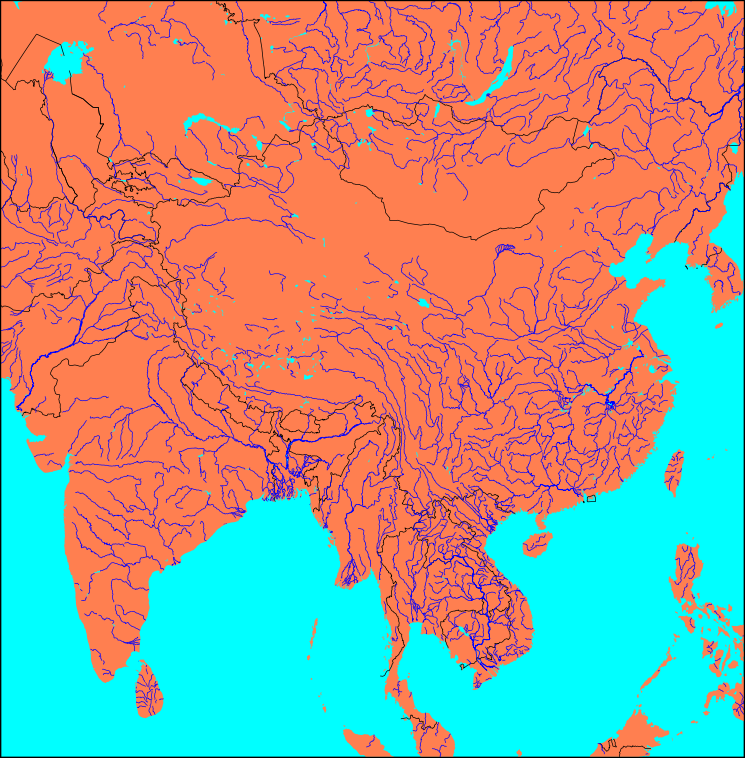
2.7 River mapping
# -*- coding: utf-8 -*-
import warnings
warnings.filterwarnings('ignore')

from mpl_toolkits.basemap import Basemap
import matplotlib.pyplot as plt


map = Basemap(width=25000000, height=25000000,llcrnrlon=70,llcrnrlat=3,urcrnrlon=140,urcrnrlat=54,
             resolution='i', projection='cass', lat_0 = 25, lon_0 = 105)
# Map boundary
map.drawmapboundary(fill_color='aqua')
# Land filling
map.fillcontinents(color='coral', lake_color='aqua')
# Draw country
map.drawcountries()
# Draw River
map.drawrivers(color='#0000ff')

plt.show()
result
Three reference connection
RGB color contrast https://www.sioe.cn/yingyong/yanse-rgb-16/
basemap tutorial: https://basemaptutorial.readthedocs.io/en/latest/
Tutorial matplotmap https://matplotlib.org/basemap/users/geography.html
Classification: python